Maxillofacial bone defects can severely impact quality of life by impairing physiological functions such as chewing, breathing, swallowing, and pronunciation. Polyether ether ketone (PEEK) is commonly used for the repair of maxillofacial defects due to its mechanical adaptability, while its osteogenic properties still need refinement. Herein, we have utilized the piezoelectric effect exhibited by barium titanate (BTO) under low-intensity pulsed ultrasound (LIPUS) to develop an ultrasound responsive PEEK (PDA@BTO-SPEEK, PBSP) through the mediating effect of polydopamine (PDA), for repairing maxillofacial bone defects. After modification by PDA@BTO, PBSP possesses better hydrophilicity, which is conducive to cell growth and adhesion. Simultaneously, by virtue of the piezoelectric characteristics of BTO, PBSP obtains a piezoelectric coefficient that matches the bone cortex. Notably, when PBSP is stimulated by LIPUS, it can generate stable electricity and effectively accelerate the osteogenic differentiation of osteoblasts through the regulation of the Piezo1-induced calcium (Ca2+) influx and Akt/GSK3β/β-catenin pathway. In addition, PBSP presents satisfactory therapeutic effects in rat skull defect models, and its osteogenic efficiency can be further improved under LIPUS stimulation with high tissue penetration. Collectively, PBSP + LIPUS exhibits great potential as a promising alternative strategy for the repair of maxillofacial bone defects.
Research Article
Ultrasound-Triggered Piezoelectric Polyetheretherketone with Boosted Osteogenesis via Regulating Akt/GSK3β/β-Catenin Pathway
https://doi.org/10.21203/rs.3.rs-4698854/v1
This work is licensed under a CC BY 4.0 License
Journal Publication
published 05 Sep, 2024
Read the published version in Journal of Nanobiotechnology →
You are reading this latest preprint version
polyether ether ketone
barium titanate
low intensity pulsed ultrasound
piezoelectric effect
osteogenesis
Cranio-maxillofacial bone defects caused by trauma, inflammation and tumor lead not only to physiological functional disorders (chewing, swallowing, pronunciation, etc.), but also seriously trouble patients due to aesthetic deficiencies [1]. At present, the clinical treatment of maxillofacial defects mainly relies on surgical implantation of bone repair materials to reconstruct the structure and function of the defect area. Polyether ether ketone (PEEK) is the leading repaired material applied in cranio-maxillofacial defects, mainly for its biocompatibility, radiation transmittance and elastic modulus similar to natural bone. However, the biological inertness of PEEK weakens its osseointegration with host bone tissue after implantation to a certain degree, which has raised a high concern in bone restorations [2, 3]. With the increasing demand for optimizing treatment efficiency and upgrading patients’ quality of life, there is an urgent need for improved PEEK implants to provide efficient osteogenic activity.
In recent years, scholars have devoted themselves to proposing admirable surface functional design of PEEK, among which biomaterial coating is one of the most common surface modified strategies [4–6]. With the development of stimuli-responsive materials, electrical stimulus has been confirmed to play a crucial role in bone tissue engineering [7, 8]. Piezoelectric materials can generate electrical signals in response to mechanical stress with their unique ability of mechano-electric conversion, providing a new idea for promoting bone growth and remodeling [9, 10]. Barium titanate (BaTiO3, BTO) is one of the most common piezoelectric materials, which can produce high efficiency piezoelectric effect under low strength mechanical force stimulation. A variety of composite membranes and gels have been constructed in view of the piezoelectric properties of BTO to promote bone formation under the action of external mechanical forces [11, 12].
Low intensity pulsed ultrasound (LIPUS) is a non-invasive exogenous mechanical force stimulation approved by the United States Food and Drug Administration (FDA), which has been proven to have potential application value in fracture healing, angiogenesis, cell differentiation and other fields [13, 14]. However, some studies have shown that LIPUS therapy alone does not treat all bone defects, especially the lesions in deep sites, resulting in prolonged treatment time and unsatisfactory prognosis [15–17]. Therefore, there is an urgent need for further exploration to optimize the therapeutic effect of LIPUS in order to shorten the treatment duration and expand its application range. Ricotti et al. have proposed a nanocomposite hydrogel containing BTO nanoparticles with ultrasonic response, which can significantly promote chondrocyte differentiation under ultrasound stimulation [18]. Chen et al. have applied BTO to titanium surface modification to accelerate osteogenesis, and found that its osteogenic activity was further enhanced under LIPUS stimulation [19]. As far as we know, there are few researches on the role and mechanism of BTO in enhancing osteogenic activity of PEEK.
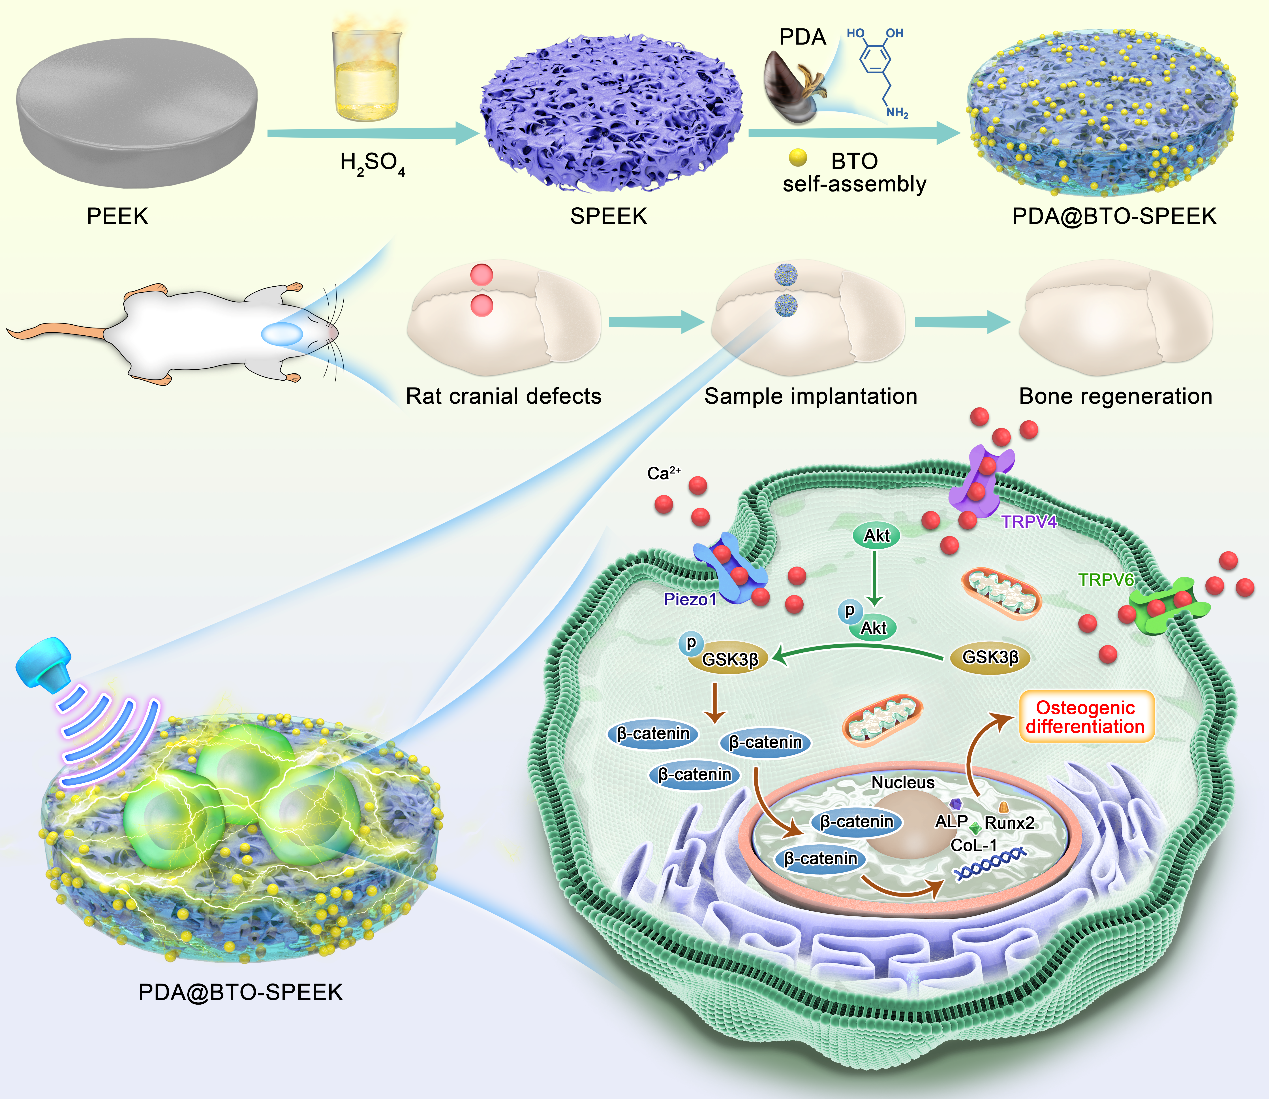
Based on the above discussion, we propose to obtain an ameliorative PEEK with ultrasonic responsiveness for the restoration of maxillofacial bone defects (Scheme 1). Initially, PEEK substrate with three-dimensional porous structure (SPEEK) was obtained by sulfonation. Polydopamine (PDA) exhibits strong adhesion to the vast majority of substrate materials due to its rich functional groups such as catechol and amino groups [20]. Herein, BTO was effectively decorated on SPEEK surface by using PDA as a medium (PDA@BTO-SPEEK, PBSP for short). After modification by PDA@BTO, PBSP possessed better hydrophilicity, which was conducive to cell growth and adhesion. By virtue of the piezoelectric characteristics of BTO, PBSP effectively accelerated osteogenic differentiation of osteoblasts by regulating Akt/GSK3β/β-catenin pathway under the action of LIPUS, and also presented satisfactory therapeutic effects in rat skull defect model.
2.1. Materials
PEEK substrates were purchased from Xinye Plastic Materials Co., Ltd. (Dongguan, China). Low intensity pulse ultrasound (LIPUS) instrument was purchased from SXULTRASONIC Co., Ltd. (Shenzhen, China). Barium titanate, dopamine hydrochloride and sulfuric acid (H2SO4) were purchased from Macklin Biochemical Technology Co., Ltd. (Shanghai, China). Alpha modified eagle medium (αMEM) and fetal bovine serum (FBS) were bought from Gibco (USA). β-glycerophosphate disodium salt, ascorbic acid, and dexamethasone were purchased from Sigma (USA). Cell viability staining kit, ghost pen peptide, alizarin red S (ARS) staining kit, nuclear protein separation kit, and laminB antibody were purchased from Solarbio Technology Co., Ltd. (Beijing, China). Cell counting kit-8 (CCK-8), calcein-acetoxymethyl ester (Calcein-AM) propyl iodide (PI) cell viability/cytotoxicity assay kit, and DAPI were purchased from Beyotime Biotechnology Co., Ltd. (Shanghai, China). LY294002 was purchased from Selleckchem (Houston, TX, USA). Akt, phosphorylated Akt (P-Akt), GSK3β, phosphorylated GSK3β (P-GSK3β), and β-catenin antibodies were purchased from Cell Signaling Technology Co., Ltd. (Danvers, USA). Primers were provided from Tsingke Biotech Co., Ltd. (Shanghai, China). Runt-related transcription factor 2 (Runx2) and alkaline phosphatase (ALP) antibodies were purchased from Proteintech Co., Ltd. (Wuhan, China).
2.2. Synthesis of PBSP
PEEK substrates were immersed in H2SO4 and stirred for 5 min, following a water bath (120℃, 12 h) to remove excess sulfuric acid to obtain sulfonated PEEK (SPEEK). 0.3 g of tris-base was weighed and dissolved in 50 mL of pure water firstly, then concentrated hydrochloric acid was added dropwise to adjust the pH of the solution to 8.5. Afterwards, 100 mg of dopamine hydrochloride (DA) was added and polymerized in a dark environment to obtain a PDA solution. For the immobilization of BTO, BTO powders (1.0 mg/mL) were added into PDA solution to obtain PDA@BTO suspension, then SPEEK substrates were soaked in PDA@BTO suspension and incubated with shaking at 37°C for 24 h at room temperature avoiding light. To remove the unattached PDA molecules, the reacted substrates were washed in an ultrasonic cleaner (SB25-12DT, SCIENTZ, China) with distilled water until the water became clear. Finally, the substrates were taken out and dry at room temperature to obtain PDA@BTO-SPEEK (PBSP).
2.3. Characterizations
The morphology and elemental composition of all synthesized samples were examined by scanning electron microscopy (SEM, Zeiss SIGMA, UK) and atomic force microscope (AFM, BRUKER Dimension Icon, Germany). The X-ray diffraction (XRD, BRUKER-D8 ADVANCED, Germany) and X-ray photoelectron spectroscopy (XPS, Thermo SCIENTIFIC ESCALAB250Xi, USA) were adopted to analyze the chemical structure of all samples. Water contact angles were measured by a contact angle measuring instrument (Dataphysics-OCA20, Germany). The piezoelectric properties of the samples were tested using a quasi-static d33 tester (ZJ-3AN, China). The output voltage of each group of samples was detected by a digital oscilloscope (DHO1000, China) under LIPUS triggering, and the following parameters were set: center frequency of 1 MHz, pulse repetition frequency of 1000 Hz, pressure intensity of 30 mW/cm2 and duty ratio of 50%. The concentration of Ba element in the extracts of PBSP after immersion in phosphate buffer saline (PBS) for 21 days was determined by inductively coupled plasma mass spectrometry (ICP-MS, Agilent 5110, USA). The hardness of samples was analyzed using a microhardness tester (HV-1000, China).
2.4. Cell Viability
Mouse embryo osteoblast precursor (MC-3T3-E1) cells were incubated in αMEM medium supplemented with 10% FBS and 1% streptomycin/penicillin at 37℃ in a CO2 incubator. CCK-8 assay was performed to evaluate the cytotoxicity of different samples when combined with LIPUS. The extracts were obtained according to ISO1099312:2007. When MC-3T3-E1 cells reach the logarithmic growth phase, they were seeded onto 96-well plates at a density of 2.0 × 10³ cells per well, followed by 24 h of incubation in an incubator (37℃, 5% CO2). Then, the cells were irradiated with LIPUS stimulation for 10 min once a day. After 24, 48, and 72 h co-culture, the CCK-8 solution was added to each well (100 µL per well) and the cells were incubated for another 4 h. The absorbance value of each well at 450 nm was determined by a multifunctional microplate reader (VICTOR Nivo, Perkin Elmer, USA). The survival rate of cells was calculated by the following formula:

Where A was the absorbance of the experimental group, A0 was the absorbance of the PEEK group, and A1 was the absorbance of the negative group.
Besides, the live/dead staining was conducted to verify the viability of MC-3T3-E1 cells. Briefly, MC-3T3-E1 cells were seeded into 6-well plates at a density of 1.0 × 10⁵ cells per well and then co-cultured for 24 h. The live cells were stained green by Calcein-AM, and the dead cells were stained red by PI. The stained cells were photographed in the dark with an inverted fluorescence microscope (IX73, Olympus, Japan).
2.5. Cell Adhesion
To detect the adhesion of cells after co-culture with the different substrates, MC-3T3-E1 cells (1.0 × 10⁵ cells) were inoculated on the surface of each sample (with a diameter of 30 mm) combined with LIPUS. After 24 h, the culture medium was removed, and cells were fixed with 4% paraformaldehyde. Then the cells were permeated by 1% TritonX-100 solution. After that, TRITC and DAPI solution (100 nM) were added successively. The images of stained cells were captured by a confocal laser scanning microscope (CLSM, TCS SP8, Leica, Germany) in a dark environment.
2.6. Osteogenesis Induced Cell Culture
To detect the cell osteogenic differentiation phenotypes, MC-3T3-E1 cells were cultured with complete medium, in which included 10 mM β-glycerophosphate disodium salt, 50 µg/mL ascorbic acid, and 10 nM dexamethasone. MC-3T3-E1 cells (1.0 × 10⁵ cells per well) were seeded in 6-well plates and incubated with the extract of different samples. The cell medium was changed and LIPUS stimulation was given to the corresponding group every three days.
2.7. ARS Staining
To assess extracellular matrix mineralization, the MC-3T3-E1 cells were immersed in ARS solution and photographed by an inverted fluorescence microscope (IX73, Olympus, Japan) on day 7 and day 14. Then, to conduct semiquantitative statistical analysis, the cells were co-incubated with 10% cetylpyridinium chloride (PHR1226, Sigma, Missouri, USA), for 30 min with shaking. After centrifugation for 15 min, the optical density (OD) values of collected supernatant were measured at a wavelength of 562 nm using a multifunctional microplate reader (VICTOR Nivo, Perkin Elmer, USA).
2.8. ALP Staining
The ALP activity of MC-3T3-E1 cells was evaluated after 7 days and 14 days by BCIP/NBT Alkaline Phosphatase Color Development Kit (Beyotime, China), according to the manufacturer’s instructions. At the pre-set timepoints, the ALP staining solution was added to each well. The cells were photographed by an inverted fluorescence microscope (IX73, Olympus, Japan). The spread area and integrated optical density (IOD) of different groups of stained cells were analyzed by Image-pro Plus J software.
2.9. Expression of Osteogenesis-Related Genes
The osteogenic induction solution and cell culture procedure used were the same as above. After culture for 14 days, MC-3T3-E1 cells on various samples were harvested by TRIzol (Solarbio, China). The extracted RNA was then reverse transcribed into cDNA using a reverse transcription system (Toyobo, Japan). The expression of osteogenic genes including runt-related transcription factor 2 (Runx2), collagen type I alpha 1 chain (COL1A1), and osteopontin (OPN) were examined with quantitative reverse transcription polymerase chain reaction (qRT-PCR). GAPDH was selected as the internal control. The forward and reverse primers for the selected genes were listed in Table S1.
2.10. Expression of Osteogenesis-Related Proteins
The expression of osteogenesis-related protein was evaluated by applying the western blotting method at a preset time point. The total protein was extracted from Radio Immunoprecipitation Assay (RIPA) lysis buffer (Solarbio, China) with 1% protease inhibitor mixture (Beyotime, China) and 1% phosphatase inhibitor (Solarbio, China). The protein sample (30 µg) was then subjected to 7.5% sodium dodecyl sulfate-polyacrylamide gel electrophoresis (SDS-PAGE) and then blotted onto polyvinylidene fluoride (PVDF) membranes according to standard protocols. After blocking with 5% (w/v) BSA, the membranes were incubated with primary antibodies at 4℃. After washing, the membrane was incubated with the secondary antibodies coupled with horseradish peroxidase (HRP) at room temperature for 1 h, and the immune response signal was detected with ECL reagent (Yatase, China). β-actin was selected as the internal control to detect the protein expression levels of ALP and Runx2. The results were analyzed and quantified by Image-pro Plus J software.
2.11. Activation of Mechanically Sensitive Ion Channels
To investigate the mRNA expression levels of the mechanically sensitive ion channels markers, including piezo type mechanosensitive ion channel component 1 (Piezo1), transient receptor potential vanilloid (TRPV) 4 and TRPV6, qRT-PCR and western blotting were carried out. In short, MC-3T3-E1 cells (1.0 × 10⁵ cells per well) were seeded in 6-well plates and incubated with the extract of different samples for 24 h. After that, total RNA and proteins were extracted respectively according to the methods described above. Then, the expression of target genes was tested using the same procedures mentioned before. The forward and reverse primers for the selected genes are listed in Table S1.
2.12. Intracellular Ca2+ Detection
After coculture, the culture medium was removed and the cells were washed with PBS. Fluo-4 AM working solution (1.0 µM) was added to cover the cells sufficiently. Then the cells underwent another incubation at 37℃ for 30 min for fluorescence probe loading. After washing with PBS for 3 times, the fluorescence of Fluo-4 AM was observed by an inverted fluorescence microscope (IX73, Olympus, Japan) to determine the change in intracellular Ca2+ concentration.
2.13. Transcriptome Analysis
To unveil the potential mechanism of PBSP + LIPUS mediated Ca2+ influx during osteogenesis, transcriptome sequencing (RNA-seq) analysis was performed. Specifically, MC-3T3-E1 cells (1.0 × 10⁶ cells/mL) were co-cultured with PBSP and PBSP + LIPUS, respectively, in 6-well plates for 14 days, and the gene expression profile of each group was investigated. Total RNA of each group was collected using TRIzol reagent following the manufacturer’s instructions and stored at − 80°C before sequencing. RNA-seq was performed by the Novogene Bioinformatics Institute (Beijing, China). The differentially expressed genes (DEGs) were examined using volcano plots and heatmap. Meanwhile, gene ontology (GO) analysis and Kyoto Encyclopedia of Genes and Genomes (KEGG) pathway analysis were conducted to determine potential signaling pathways.
2.14. Akt/GSK-3β/β-catenin Signaling Pathway Validation
To confirm the activation of Akt/GSK-3β/β-catenin signal by PBSP + LIPUS, western blotting was conducted to assess the protein expression of Akt, phosphorylated Akt (p-Akt), GSK3β, phosphorylated GSK3β (p-GSK3β), and β-catenin in MC-3T3-E1 cells. LY294002 was introduced to selectively inhibit the PI3K activation. The expression of target genes was tested using western blotting mentioned before. The results were analyzed and quantified via Image-pro Plus J software.
2.15. Establishment of Skull Defect Model in Rats
The animal experiments were approved by the Animal Care and Use Committee of Zhongnan Hospital of Wuhan University (No. ZN2022282). A total of twenty-four SD rats were utilized in the calvarial defect model as previously reported. Firstly, the rats were anesthetized by intraperitoneal injection of pentobarbital sodium solution (40 mg/kg). Then, two critical sized full-thickness bone defects (with a diameter of 4 mm) were created at the center of each parietal bone in the rats using a saline cooled ring drill, and different samples were implanted according to grouping. The surgical area was washed and sutured in layers and positions. LIPUS stimulation was performed on the second day after surgery.
2.16. Microcomputed tomography (Micro-CT) Test
Whole calvarias were dissected from the sacrificed rats for bone formation evaluation at week 4 and 8 post-implantation. Before the Micro-CT analysis, all the samples were fixed with a 4% paraformaldehyde solution for 48 h. Micro-CT (Skyscan 1276, Bruker, Germany) scanning was used to evaluate the healing conditions of each specimen. Then, the bone parameters including bone volume per tissue volume (BV/TV), trabecular thickness (Tb.Th) and trabecular separation (Tb.Sp) were measured by three-dimensional reconstruction.
2.17. Histological Staining
Rat calvarias fixed with 4% paraformaldehyde were rinsed with water, dehydrated with ethanol, cleaned with xylene, and then embedded in methyl methacrylate. Each specimen was cut into slices and subsequently processed with immunofluorescent staining for evaluating the expression of Runx2. The Runx2-positive stained sites were observed by a fluorescence scanner (PANNORAMIC MIDI, 3DHISTECH, Hungary). Masson staining was also carried out for assessing collagen fibrogenesis. All the staining images were captured using a high-resolution microscope (ECLIPSE Ci, Nikon, Japan). The quantification was conducted via Image-pro Plus J software.
2.18. In Vivo Biosafety
For the evaluation of the in vivo biosafety of PBSP + LIPUS, hematoxylin and eosin (H&E) staining of major organs dissected from the above rats was performed at week 8 post-implantation. Meanwhile, the whole blood was collected for the blood routine examination.
2.19. Statistical Analyses
All data in graphs were presented as the means ± standard deviations (s.d.). Statistical analysis among groups was performed using one-way analysis of variance (ANOVA) followed by t test. All measurements were conducted at least in three replicates. The GraphPad Prism was employed to carry out the data processing and statistical analysis, in which asterisks indicated the significant differences (*p < 0.05, **p < 0.01, ***p < 0.001, ****p < 0.0001).
3.1. Synthesis and Characterization of PBSP
Sample preparation is shown in Fig. 1A. Before the surface modification of PEEK, the concentration of BTO was determined by CCK-8 experiment. As shown in Figure S1, when MC-3T3-E1 cells were co-cultured with BTO at a concentration of less than 1.0 mg/mL for 72 h, the survival rate was still greater than 80%. While the concentration was more than 1.0 mg/mL, the cell survival was inhibited. Therefore, the BTO nanoparticles with the concentration of 1.0 mg/mL was utilized for the subsequent experiments. The morphology of BTO and the surface structure of each sample were detected by scanning electron microscopy (SEM). As found in Figure S2, BTO appeared as circular nanoparticles. After PEEK was treated with sulfuric acid, a three-dimensional (3D) network porous morphology structure replaced the originally smooth structure, and additional BTO particles were found on the surface of SPEEK (Fig. 1B). Sulfonation is an effective strategy to prepare porous structures on PEEK surface, which favors the loading and delivery of small molecules or nanoparticles [21–23]. For better biological activity of SPEEK, it was dipped into PDA@BTO solutions to form the PBSP. The pH of the solution was also kept at 8.5 to maximize the interactions [24, 25]. According to Fig. 1B, BTO nanoparticles were distributed uniformly on the surface and pore structure of PBSP.
The elemental profiles of Ba, Ti and O were identified using energy dispersive spectroscopy (EDS) indicating the successful introduction of BTO (Figure S3 and S4). The XPS spectra of PEEK, SPEEK and PBSP were exhibited in Fig. 1C. The presence of Ba and Ti elements was certified by XPS survey spectrum, which was compatible with the EDS results. The high-resolution XPS spectra denoted that the Ba 3d spectrum of PBSP could be deconvoluted into two peaks centered at 793.9 eV and 778.6 eV, which were indexed to Ba 3d3/2 and Ba 3d5/2, manifesting that the Ba element in the samples existed in a trivalent form. Besides, the Ti 2p spectrum of PBSP could be mostly fitted into two subpeaks at 463.9 eV and 458.1 eV, which were separately ascribed to Ti 2p1/2 and Ti 2p3/2 (Fig. 1D and 1E). Moreover, in X-ray diffraction XRD pattern of PBSP, the characteristic peaks at 18.6°, 20.6°, 22.5°, and 28.5° were corresponding to the (110), (111), (200), and (211) crystal planes of PEEK, respectively. To note, the other two characteristic peaks at 31.4° and 45.0° belonged to the (110) and (200) planes for the diffraction phase of BaTiO3 (JCPDS Card No. 34–0129) was also exhibited (Figure S5 and S6), which further confirmed that BTO was stably loaded on PBSP substrate.
Meanwhile, the surface micromorphology and roughness of each sample were detected by atomic force microscope (AFM). As indicated in Fig. 1F, the AFM images showed the similar micromorphology compared to SEM images. According to Figure S7, the roughness of SPEEK significantly increased from (Ra = 27.93 ± 4.05 nm) to (Ra = 185.67 ± 64.29 nm), while the roughness of PBSP just increased to 99.53 ± 20.86 nm, which might be ascribed to the introduction of BTO. Water contact angle (WCA) was assessed to evaluate the surface hydrophilicity of samples via using the sessile drop method. It could be observed from Fig. 1G that the hydrophilicity of PBSP was significantly improved, while the corresponding WCAs of PEEK, SPEEK and PBSP were 85.73 ± 4.09°, 61.40 ± 1.99°, and 27.23 ± 5.24°, respectively (Fig. 1H). Although PBSP did not have the same roughness as SPEEK, its hydrophilicity was superior to SPEEK, which might be due to the presence of a large number of hydrophilic hydroxyl groups [26]. ICP-MS data also revealed increased Ba content in the extracts of PBSP after 21 days of immersion in PBS (Figure S8).
Furthermore, the electrical stability test results under simulated physiological conditions showed that compared with unmodified PEEK, the continuous stable piezoelectric coefficient of the PBSP was about 5.1 pC/N (Fig. 1I), which was closer to that of natural bone (4–11 pC/N) [27]. Studies have confirmed that the larger the piezoelectric constant of biological piezoelectric materials, the smaller the water contact angle and the better the hydrophilicity [28]. In order to further confirm the piezoelectric properties of PBSP, the output voltage of PBSP under LIPUS stimulation was tested. As shown in Fig. 1J, there was no significant change in the output voltage of SPEEK compared to PEEK. Profited from the introduction of BTO, PBSP could generate significantly increased electrical signals. The mechanical properties similar to bone are a major advantage of PEEK applied in the field of bone tissue defect repair, so we conducted hardness tests on different samples. We excitingly found that the hardness of PBSP showed no significant difference compared to PEEK, while the hardness of SPEEK after sulfonation treatment was significantly lower than PEEK (Figure S9). All the aforementioned results imply the successful synthesis of a novel PEEK (PBSP) with piezoelectric properties, which can provide an electrical stimulation under external stimulation (LIPUS) and form an admirable electrical microenvironment for bone tissue regeneration.
3.2. Cytocompatibility of Different Samples When Combined with LIPUS
The biocompatibility of implantable materials is a prerequisite for their clinical application [29]. First, the proliferation of MC-3T3-E1 cells on different samples combined with LIPUS after 72 h coculture was evaluated by CCK-8 assay. After statistical analysis, the cell viability of each group remained more than 95%, and no significant difference among these groups was found, manifesting the desirable cytocompatibility (Fig. 2A). The proportion of living and dead cells was also evaluated by staining MC-3T3-E1 cells with Calcein-AM/PI 24 h after culture. Few dead cells were detected on the surface of each sample (Fig. 2B), indicating the satisfactory biosafety of PBSP.
Considering osteoblast adhesion on materials is the first step in bone integration, the enhanced adhesion of osteoblasts has become one of the main goals in optimizing the surface properties of bone implant materials [30]. We further evaluated the effect of different samples on the ability of cells to attach. The adherent cells on the substrate surface in each group were stained with DAPI and phalloidine, and then observed by confocal laser scanning microscope (CLSM). As signified in Fig. 2C, MC-3T3-E1 cells stretched better and even interconnected with each other on PBSP when compared to those on the PEEK and SPEEK, indicating that the hydrophilic properties of PBSP were conducive to cell adhesion. In addition, when LIPUS was introduced, it did not significantly affect cell adhesion on different samples. The above results denoted the favorable biosecurity of PBSP when combined with LIPUS.
3.3. In Vitro Osteogenic Differentiation
During the process of osteogenic differentiation, the basic biological characteristics of osteoblasts are bone matrix synthesis, secretion, mineralization and maturation. Osteoblasts first synthesize extracellular matrix such as collagen type I (COLI), osteocalcin (OCN) and osteopontin (OPN) [31]. In addition, calcium ions are released through the matrix vesicles and precipitate on the collagen filament under the action of enzymes such as alkaline phosphatase (ALP), thereby completing the matrix mineralization process, and finally forming bone tissue [32].
Mineralized nodules are the mark of differentiation and maturation of osteoblasts, and also the main morphological feature of osteoblasts performing osteogenic function [33]. Thereafter, the effect of different groups on osteogenic differentiation of MC-3T3-E1 cells was first visualized by Alizarin red S (ARS) staining for 14 days. In Fig. 3A, ARS staining images revealed that MC-3T3-E1 cells in the PBSP + LIPUS group showed more abundant induced mineralization nodules compared with the other groups. According to the semiquantitative data in Fig. 3B, compared with the unmodified samples (PEEK and SPEEK), PBSP obviously increased the formation of calcium nodules. After 14 days of osteogenic induction, calcium nodule deposition in the PBSP + LIPUS group was significantly higher than that in the PBSP group. However, there was no significant difference in mineralization nodules between the PBSP and PBSP + LIPUS groups after coculture for 7 days, which might be due to the fact that extracellular matrix calcium deposition was considered as a late stage biochemical marker of osteogenesis. Alkaline phosphatase (ALP) is an early marker of osteoblast differentiation, which appears in the bone matrix synthesis stage and reaches its peak in the mineralization stage [34]. We detected the effect of different treatments on the activity of ALP by observing the color development of endogenous ALP in cells. Similar to the trend of ARS staining, the higher ALP expression was detected in the PBSP group, and the introduction of LIPUS further promoted the calcium deposition of MC-3T3-E1 cells (Fig. 3C and 3D).
Meanwhile, the expression of several pivotal pro-osteogenic genes and proteins was evaluated by qRT-PCR assay, and western blotting to validate the pro-osteogenic differentiation of MC-3T3-E1 cells. As demonstrated in Fig. 3E, MC-3T3-E1 cells co-cultured with PBSP resulted in higher osteogenic gene expression, including collagen type I alpha 1 chain (COL1A1), OPN and runt-related transcription factor 2 (Runx2), when compared with other five groups on day 14 (p < 0.05). More specifically, the expression levels of COL1A1 and Runx2 in MC-3T3-E1 cells were increased by about 6.0 and 4.2 times, respectively. Compared to COL1A1 and Runx2, the increase in OPN expression was not as significant, which might be due to the cells had not yet reached the late stage of osteogenic differentiation at the time of detection [35]. Western blotting also confirmed that the MC-3T3-E1 cells cultured in the PBSP + LIPUS group expressed higher levels of Runx2 and ALP proteins than other groups (Figure S10). All these results demonstrated that a more favorable environment for osteogenesis was constructed in the PBSP + LIPUS group.
3.4. Possible Molecular Mechanism of PBSP + LIPUS to Promote Osteogenesis
The activation of mechanically sensitive ion channels may be triggered by mechanical or electrical stimulation, thus contributing to calcium (Ca2+) influx [36]. Piezo1 is one of the most critical mechanically sensitive piezoelectric channels that exists on the surface of many cell types, including osteoblasts. It can be activated under mechanical stimulation to regulate ion conduction pores and further mediate multiple biological mechanisms [37, 38]. Transient receptor potential vanilloid (TRPV) channels, such as TRPV4 and TRPV6, are also proven to functionally regulate osteoblast proliferation and differentiation through selective Ca2+ transport [39]. Vignesh et al. proposed that TRPV4-mediated Ca2+ influx contributes to osteoblast differentiation and bone formation [40].
To understand the role of PBSP + LIPUS in regulating Ca2+ influx and following signals, qRT-PCR and western blotting analysis were conducted to investigate the expression levels of Piezo1, TRPV4 and TRPV6 in MC3T3-E1 cells treated with different samples and LIPUS stimulation. As expected, the PBSP + LIPUS treated cells expressed significantly upregulated Piezo1 and TRPV4 mRNA levels (Fig. 4A and 4B). The western blotting results showed that Piezo1 and TRPV6 expression levels were significantly higher in the PBSP + LIPUS group compared to that in the PEEK group (Fig. 4C and 4D). We also detected intracellular Ca2+ levels in different groups by Fluo 4 fluorescence staining. It was observed that the introduction of LIPUS triggered more Ca2+ influx compared to the application of materials alone, indicating that the influx of Ca2+ was more susceptible to ultrasound stimulation (Fig. 4E).
3.5. Regulation of Osteoblast Transcriptome by PBSP + LIPUS
Subsequently, to elucidate the underlying mechanism of Ca2+ influx mediated by PBSP + LIPUS in osteogenesis, RNA-seq analysis of MC-3T3-E1 cells was performed. After treatment with PBSP + LIPUS, a total of 2146 DEGs were identified in the gene expression profiling of MC-3T3-E1 cells with statistical significance, including 984 up-regulated genes (red) and 1162 down-regulated genes (green), as demonstrated in the volcano plot analyses (Fig. 5A). In order to further clarify the impact of PBSP combined with LIPUS on the biological function of MC-3T3-E1 cells, GO analysis was performed on DEGs (Fig. 5B and Table S2). We found that DEGs were enriched in biological processes, cellular component, and molecular function, among which representative GO terms contained ribosome biogenesis, preribosome and snoRNA binding. In DEGs, the clustering heatmap exhibited some significantly changed genes, which were correlated with osteogenic biogenesis (Fig. 5C).
Thereafter, the KEGG pathway result illustrated that DEGs were predominantly in PI3K-Akt pathway (Fig. 5D and Table S3). A growing body of scientific literature has demonstrated that Akt plays a key role in regulating cell differentiation via phosphorylating targeted genes, such as GSK3β. can be deactivated to promote the accumulation of β-catenin [41–43]. To validate the activation of PI3K-Akt signal and involved downstream genes by PBSP + LIPUS, we carried out western blotting to assess the protein expression of Akt, phosphorylated Akt (P-Akt), GSK3β, phosphorylated GSK3β (P-GSK3β), and β-catenin in MC-3T3-E1 cells in response to treatment with PBSP + LIPUS. We found that the ratio of p-Akt/Akt, p-GSK3β/GSK3β, and β-catenin was reduced at 24 h after PBSP + LIPUS treatment (Fig. 5E-G). While, after intervention with PI3K inhibitor (LY294002), the phosphorylation of Akt and GSK3β by PBSP + LIPUS was significantly inhibited, and the accumulation of β-catenin was further weakened. These results indicate that PBSP + LIPUS facilitates osteogenic differentiation of MC-3T3-E1 cells via the Akt/GSK-3β/β-catenin signaling pathway.
On the other hand, the interaction between voltage-dependent anion channel (VDAC) and hexokinase II (HK2) was enhanced in the PBSP + LIPUS group from the data of the protein–protein interactions (Figure S11). This interaction is crucial for the maintenance of mitochondrial membrane potential (MMP) and energy metabolism [44]. There are evidences that mitochondrial metabolism is involved in regulating the proliferation and differentiation of osteoblasts [45–47]. Xue et al. found that GSK3β could disrupt the binding of HK2 to VDAC by phosphorylation of VDAC [48]. We have confirmed that GSK3β was phosphorylated to P-GSK3β in Fig. 5F. Therefore, it can be speculated that PBSP + LIPUS activates Piezo1-induced Ca2+ influx, and enhances the interaction between VDAC and HK2 via Akt/GSK-3β/β-catenin signaling pathway, thereby positively regulating the osteogenic differentiation of osteoblasts (Fig. 5H).
3.6. In Vivo Osteogenic Evaluation
To investigate the effect of PBSP combined with LIPUS on bone defect repair, a rat skull defect model was established (Fig. 6A). To investigate the effect of different treatments on bone formation after surgery, the skull defect sites were scanned by Micro-CT at week 4 and week 8 post-surgery. As evidenced in Fig. 6B and 6D, compared to the PEEK and SPEEK groups, the PBSP group promoted more new bone formation at defect regions. When combined with LIPUS stimulation, the osteogenic effect of PBSP was further enhanced. In particular, the defect site was almost completely filled with newly regenerated bone in the PBSP + LIPUS group, whereas only sporadic new bone formation was observed in other groups after 8 weeks of implantation. In addition, from the perspective of coronal plane, bone formation began at the very bottom of the defect, and each group had partial or even complete connection between the two ends of the defect. Based on these phenomena, we speculated that the porous structure on the surface of PBSP might promote the adhesion and growth of cells, providing a favorable osteogenic microenvironment for the later stage. Through 3D reconstructions, the bone parameters such as bone volume per tissue volume (BV/TV), trabecular thickness (Tb.Th), and trabecular separation (Tb.Sp) were calculated. As expected, the quantitative analysis results showed that PBSP + LIPUS led to a substantial increase in BV/TV as well as Tb.Th, and a slight decrease in trabecular separation (Tb.Sp), demonstrating that PBSP + LIPUS could promote osteogenesis (Fig. 6C and 6E).
Further inspection on immunohistochemical and Masson staining of the calvarias tissue sections was also carried out. As illustrated in Fig. 7A and 7C, there were massive positive staining sites (blue fluorescence) for Runx2 in the PBSP group, and the promotion effects of Runx2 were more pronounced when combined with LIPUS. Further quantitative analysis showed that the expression of Runx2 increased in PBSP + LIPUS compared to other groups (Fig. 7B and 7D). As for Masson staining, the red staining represents the mineralized collagen and mature bone matrix, while the blue staining depicts the non-mineralized collagen and immature bone matrix. As exhibited in Fig. 7E and 7G, the PBSP + LIPUS group showed abundant red staining, indicating that the regenerated skull was calcifying and that much of it was matured. The corresponding semiquantitative analysis in Fig. 7F and 7H revealed PBSP + LIPUS could enhance the collagen deposition, which was in accordance with the above results of bone parameters analysis. Taken together, PBSP + LIPUS exerted a satisfactory osteogenic effect.
To test the in vivo biocompatibility, the body weights of all rats were recorded every week. As shown in Figure S12, the weight of rats treated with different implants combined with LIPUS gradually increased as time extended. After 8 weeks, H&E staining of major organs dissected from the rats was performed, and there was no obvious inflammation in the organs of the PBSP + LIPUS group (Figure S13). In addition, we also assessed the blood routine, and all indexes were within the normal range (Table S4). All these data demonstrated the favorable in vivo biosafety of PBSP + LIPUS.
Collectively, we have proposed the ultrasound-responsive PBSP with accelerated osteogenic functions for the therapy of maxillofacial bone defects. After surface modification, PBSP not only possesses admirable mechanical properties comparable to PEEK, but also shows excellent hydrophilicity conducive to cell growth and adhesion. In addition, due to the presence of BTO, PBSP has a piezoelectric coefficient similar to bone tissue, thereby exerting a piezoelectric effect under LIPUS stimulation. PBSP + LIPUS can generate stable electric signals and significantly promote the osteogenic differentiation of osteoblasts when applied to in vitro osteogenic induction experiments. To note, PBSP + LPIUS can activate the mechanosensitive ion channel such as Piezo1 on the surface of the cytomembrane to induce the influx of Ca2+, and further activate Akt/GSK-3β/β-catenin signaling to promote the expression of osteogenic genes. The osteogenic effect of PBSP + LIPUS has been further verified in vivo in rat skull defect model. However, it must be acknowledged that the stability and long-term biosafety of PBSP still need to be systematically studied. To sum up, this safe and effective ultrasound-responsive PEEK-based implant material with boosted osteogenic functions holds a promise to provide rapid, accurate and efficient treatment strategies for bone injuries in other sites such as femur, tibia, spine, joints and so on.
The list of abbreviations is shown in Table S5 according to the order of appearance.
Acknowledgements
Not applicable.
Author contributions
Y. L. and Y. F. contributed equally to this work. B. C. and S. Z. guided the project. S. Z. and Y. L. conceived the idea and conceptualized the manuscript. Y. L., S. Z. and Y. F. participated in the design of sample. Y. L. and S. Z contributed to experimental method development, sample analysis, data processing and manuscript writing. B. C. reviewed and edited the manuscript. All authors have given approval to the final version of the manuscript.
Funding
This work was funded by the Hubei Province Unveiled the List System of Science and Technology Projects (2021BEC027 to Bo Cheng), Translational Medicine and Interdisciplinary Research Joint Fund of Wuhan University (ZNJC202242 to Bo Cheng), Hubei Provincial Natural Science Foundation Project (2022CFB761 to Siyu Zhao), Youth Science Fund Cultivation Project (CXPY2022018 to Siyu Zhao), Fundamental Research Funds for the Central Universities (2042022kf115 to Siyu Zhao), and Excellent Doctoral Research Launch Fund of Zhongnan Hospital (ZNYB2021033 to Siyu Zhao). The authors also sincerely appreciate the assistance from the School of Basic Medicine, Wuhan University.
Availability of data and materials
The data that support the findings of this study are available from the corresponding author upon reasonable request.
Ethics approval and consent to participate
The animal experiments were approved by the Animal Care and Use Committee of Zhongnan Hospital of Wuhan University (No. ZN2022282).
Consent for publication
All authors agree to be published.
Competing interests
All authors declared that no conflict of interest existed.
Author details
a Department of Stomatology, Zhongnan Hospital of Wuhan University, Wuhan University, Wuhan 430071, China.
- Weng Y, Wang H, Wu D, Xu S, Chen X, Huang J, et al. A novel lineage of osteoprogenitor cells with dual epithelial and mesenchymal properties govern maxillofacial bone homeostasis and regeneration after MSFL. Cell Res. 2022;32:814–30.
- Sun T, Huang H, Zhao Y, Li Z, Wang H, Zhou G. Low-Temperature Deposited Amorphous Poly(aryl ether ketone) Hierarchically Porous Scaffolds with Strontium-Doped Mineralized Coating for Bone Defect Repair. Adv Healthc Mater. 2024;e2400927.
- Huang H, Liu X, Wang J, Suo M, Zhang J, Sun T, et al. Strategies to improve the performance of polyetheretherketone (PEEK) as orthopedic implants: from surface modification to addition of bioactive materials. J Mater Chem B. 2024;12:4533–52.
- He M, Huang Y, Xu H, Feng G, Liu L, Li Y, et al. Modification of polyetheretherketone implants: From enhancing bone integration to enabling multi-modal therapeutics. Acta Biomater. 2021;129:18–32.
- Xu X, Zuo J, Zeng H, Zhao Y, Fan Z. Improving Osseointegration Potential of 3D Printed PEEK Implants with Biomimetic Periodontal Ligament Fiber Hydrogel Surface Modifications. Adv Funct Mater. 2024;34:2308811.
- Toita R, Kitamura M, Tsuchiya A, Kang J-H, Kasahara S, Releasable. Immune-Instructive, Bioinspired Multilayer Coating Resists Implant-Induced Fibrosis while Accelerating Tissue Repair. Adv Healthc Mater. 2024;13:e2302611.
- Sun J, Zhao D, Wang Y, Chen P, Xu C, Lei H, et al. Temporal Immunomodulation via Wireless Programmed Electric Cues Achieves Optimized Diabetic Bone Regeneration. ACS Nano. 2023;17:22830–43.
- Chen L, Yang J, Cai Z, Huang Y, Xiao P, Wang J et al. Electroactive Biomaterials Regulate the Electrophysiological Microenvironment to Promote Bone and Cartilage Tissue Regeneration. Advanced Functional Materials. n/a:2314079.
- Nain A, Chakraborty S, Barman SR, Gavit P, Indrakumar S, Agrawal A, et al. Progress in the development of piezoelectric biomaterials for tissue remodeling. Biomaterials. 2024;307:122528.
- Liu X, Wan X, Sui B, Hu Q, Liu Z, Ding T, et al. Piezoelectric hydrogel for treatment of periodontitis through bioenergetic activation. Bioact Mater. 2024;35:346–61.
- Wu P, Shen L, Liu H-F, Zou X-H, Zhao J, Huang Y, et al. The marriage of immunomodulatory, angiogenic, and osteogenic capabilities in a piezoelectric hydrogel tissue engineering scaffold for military medicine. Mil Med Res. 2023;10:35.
- Dai X, Heng BC, Bai Y, You F, Sun X, Li Y, et al. Restoration of electrical microenvironment enhances bone regeneration under diabetic conditions by modulating macrophage polarization. Bioact Mater. 2021;6:2029–38.
- Xie S, Li G, Hou Y, Yang M, Li F, Li J, et al. A synergistic bactericidal effect of low-frequency and low-intensity ultrasound combined with levofloxacin-loaded PLGA nanoparticles on M. smegmatis in macrophages. J Nanobiotechnol. 2020;18:107.
- Wu M, Yong J, Zhang H, Wang Z, Xu ZP, Zhang R. 2D Ultrathin Iron Doped Bismuth Oxychloride Nanosheets with Rich Oxygen Vacancies for Enhanced Sonodynamic Therapy. Adv Healthc Mater. 2023;12:e2301497.
- Palanisamy P, Alam M, Li S, Chow SKH, Zheng Y-P. Low-Intensity Pulsed Ultrasound Stimulation for Bone Fractures Healing: A Review. J Ultrasound Med. 2022;41:547–63.
- Harrison A, Alt V. Low-intensity pulsed ultrasound (LIPUS) for stimulation of bone healing–A narrative review. Injury. 2021;52:S91–6.
- Yao H, Zhang L, Yan S, He Y, Zhu H, Li Y, et al. Low-intensity pulsed ultrasound/nanomechanical force generators enhance osteogenesis of BMSCs through microfilaments and TRPM7. J Nanobiotechnol. 2022;20:378.
- Ricotti L, Cafarelli A, Manferdini C, Trucco D, Vannozzi L, Gabusi E, et al. Ultrasound Stimulation of Piezoelectric Nanocomposite Hydrogels Boosts Chondrogenic Differentiation in Vitro, in Both a Normal and Inflammatory Milieu. ACS Nano. 2024;18:2047–65.
- Chen J, Li S, Jiao Y, Li J, Li Y, Hao Y-L, et al. In Vitro Study on the Piezodynamic Therapy with a BaTiO3-Coating Titanium Scaffold under Low-Intensity Pulsed Ultrasound Stimulation. ACS Appl Mater Interfaces. 2021;13:49542–55.
- Hemmatpour H, De Luca O, Crestani D, Stuart MCA, Lasorsa A, van der Wel PCA, et al. New insights in polydopamine formation via surface adsorption. Nat Commun. 2023;14:664.
- Chen Z, Chen Y, Wang Y, Deng J, Wang X, Wang Q, et al. Polyetheretherketone implants with hierarchical porous structure for boosted osseointegration. Biomater Res. 2023;27:61.
- Zheng Z, Hu L, Ge Y, Qi J, Sun Q, Li Z, et al. Surface Modification of Poly(ether ether ketone) by Simple Chemical Grafting of Strontium Chondroitin Sulfate to Improve its Anti-Inflammation, Angiogenesis, Osteogenic Properties. Adv Healthc Mater. 2022;11:e2200398.
- Bai X, Zhang X, Xiao J, Lin X, Lin R, Zhang R, et al. Endowing Polyetheretherketone with Anti-Infection and Immunomodulatory Properties through Guanidination Carbon Dots Modification to Promote Osseointegration in Diabetes with MRSA Infection. Adv Healthc Mater. 2024;13:e2302873.
- Tan L, Zhu T, Huang Y, Yuan H, Shi L, Zhu Z, et al. Ozone-Induced Rapid and Green Synthesis of Polydopamine Coatings with High Uniformity and Enhanced Stability. Adv Sci (Weinh). 2024;11:e2308153.
- Lan R, Sun J, Shen C, Huang R, Zhang Z, Zhang L, et al. Near-Infrared Photodriven Self-Sustained Oscillation of Liquid-Crystalline Network Film with Predesignated Polydopamine Coating. Adv Mater. 2020;32:e1906319.
- Zhang N, Dong J, Li X, Wang S, Ou J, Ye M. One-step synthesis of hydrophilic microspheres for highly selective enrichment of N-linked glycopeptides. Anal Chim Acta. 2020;1130:91–9.
- Prokhorov E, Bárcenas GL, España Sánchez BL, Franco B, Padilla-Vaca F, Hernández Landaverde MA, et al. Chitosan-BaTiO3 nanostructured piezopolymer for tissue engineering. Colloids Surf B Biointerfaces. 2020;196:111296.
- Li Y, Dong X, Xu Z, Wang M, Wang R, Xie J, et al. Piezoelectric 1T Phase MoSe2 Nanoflowers and Crystallographically Textured Electrodes for Enhanced Low-Temperature Zinc-Ion Storage. Adv Mater. 2023;35:e2208615.
- Wang H, Meng Z, Zhao C-Y, Xiao Y-H, Zeng H, Lian H et al. Research progress of implantation materials and its biological evaluation. Biomed Mater. 2023;18.
- Lin Z, Wu M, He H, Liang Q, Hu C, Zeng Z, et al. 3D Printing of Mechanically Stable Calcium-Free Alginate-Based Scaffolds with Tunable Surface Charge to Enable Cell Adhesion and Facile Biofunctionalization. Adv Funct Mater. 2019;29:1808439.
- Zhu Y-S, Mo T-T, Jiang C, Zhang J-N. Osteonectin bidirectionally regulates osteoblast mineralization. J Orthop Surg Res. 2023;18:761.
- Zhang Y, Ma S, Nie J, Liu Z, Chen F, Li A, et al. Journey of Mineral Precursors in Bone Mineralization: Evolution and Inspiration for Biomimetic Design. Small. 2024;20:e2207951.
- Xu Y, Luo Y, Weng Z, Xu H, Zhang W, Li Q, et al. Microenvironment-Responsive Metal-Phenolic Nanozyme Release Platform with Antibacterial, ROS Scavenging, and Osteogenesis for Periodontitis. ACS Nano. 2023;17:18732–46.
- Vimalraj S. Alkaline phosphatase: Structure, expression and its function in bone mineralization. Gene. 2020;754:144855.
- An J, Yang H, Zhang Q, Liu C, Zhao J, Zhang L, et al. Natural products for treatment of osteoporosis: The effects and mechanisms on promoting osteoblast-mediated bone formation. Life Sci. 2016;147:46–58.
- Li J, Hou B, Tumova S, Muraki K, Bruns A, Ludlow MJ, et al. Piezo1 integration of vascular architecture with physiological force. Nature. 2014;515:279–82.
- Guan H, Wang W, Jiang Z, Zhang B, Ye Z, Zheng J, et al. Magnetic Aggregation-Induced Bone-Targeting Nanocarrier with Effects of Piezo1 Activation and Osteogenic-Angiogenic Coupling for Osteoporotic Bone Repair. Adv Mater. 2024;36:e2312081.
- Unnithan AR, Sasikala ARK, Shrestha BK, Lincoln A, Thomson T, El Haj AJ. Remotely Actuated Magnetic Nanocarpets for Bone Tissue Engineering: Non-Invasive Modulation of Mechanosensitive Ion Channels for Enhanced Osteogenesis. Adv Funct Mater. 2022;32:2201311.
- Liu N, Lu W, Dai X, Qu X, Zhu C. The role of TRPV channels in osteoporosis. Mol Biol Rep. 2022;49:577–85.
- Kaliannagounder VK, Raj NPMJ, Unnithan AR, Park J, Park SS, Kim S-J, et al. Remotely controlled self-powering electrical stimulators for osteogenic differentiation using bone inspired bioactive piezoelectric whitlockite nanoparticles. Nano Energy. 2021;85:105901.
- Smith CO, Eliseev RA. Energy Metabolism During Osteogenic Differentiation: The Role of Akt. Stem Cells Dev. 2021;30:149–62.
- Wei X, Chen Q, Bu L, Wan X, Jiao Z, Han Z, et al. Improved Muscle Regeneration into a Joint Prosthesis with Mechano-Growth Factor Loaded within Mesoporous Silica Combined with Carbon Nanotubes on a Porous Titanium Alloy. ACS Nano. 2022;16:14344–61.
- Zhong Y-T, Liao H-B, Ye Z-Q, Jiang H-S, Li J-X, Ke L-M, et al. Eurycomanone stimulates bone mineralization in zebrafish larvae and promotes osteogenic differentiation of mesenchymal stem cells by upregulating AKT/GSK-3β/β-catenin signaling. J Orthop Translat. 2023;40:132–46.
- Li R, Yang W. Gomisin J inhibits the glioma progression by inducing apoptosis and reducing HKII-regulated glycolysis. Biochem Biophys Res Commun. 2020;529:15–22.
- Wang H, Fu X, Shi J, Li L, Sun J, Zhang X, et al. Nutrient Element Decorated Polyetheretherketone Implants Steer Mitochondrial Dynamics for Boosted Diabetic Osseointegration. Adv Sci (Weinh). 2021;8:e2101778.
- Lin C, Yang Q, Guo D, Xie J, Yang Y-S, Chaugule S, et al. Impaired mitochondrial oxidative metabolism in skeletal progenitor cells leads to musculoskeletal disintegration. Nat Commun. 2022;13:6869.
- Suh J, Kim N-K, Shim W, Lee S-H, Kim H-J, Moon E, et al. Mitochondrial fragmentation and donut formation enhance mitochondrial secretion to promote osteogenesis. Cell Metab. 2023;35:345–e3607.
- Xue Y-N, Yu B-B, Li J-L, Guo R, Zhang L-C, Sun L-K, et al. Zinc and p53 disrupt mitochondrial binding of HK2 by phosphorylating VDAC1. Exp Cell Res. 2019;374:249–58.
Scheme 1 is available in the Supplementary Files section.
No competing interests reported.
- image1.png
Scheme 1. Schematic illustration of the construction of PBSP and its therapeutic mechanisms of bone defects when combined with LIPUS.
- Supplementarymaterial.docx
Supplementary Material Supplementary Material is available in the online version of the paper. Supplementary Material 1: Figure S1. The cytotoxicity of BTO with different concentrations after culture with MC-3T3-E1 cells for 24, 48 and 72 h. Figure S2. SEM image of BTO. Figure S3. EDS patterns of PEEK, SPEEK, and PBSP. Figure S4. EDS mapping of PBSP (scale bar=10 μm). Figure S5. XRD pattern of BTO. Figure S6. XRD patterns of PEEK, SPEEK, and PBSP. Figure S7. Roughness comparation between PEEK, SPEEK, and PBSP. Figure S8. The content of Ba element in the extracts of PBSP after immersion in PBS for 21 days. Figure S9. Hardness of PEEK, SPEEK, and PBSP. Figure S10. The protein expression of osteogenesis-related proteins in different groups. Figure S11. The protein–protein interactions in MC-3T3-E1 cells treated with PBSP+LIPUS. Figure S12. Body weight variation of rats in different groups. Figure S13. The representative H&E staining images of major organs in different groups after implantation for 8 weeks (scale bar = 100 μm). Table S1. The primers used in this study. Table S2. GO analysis referred to Figure 5b. Table S3. KEGG pathways enrichment analysis referred to Figure 5d. Table S4. Blood routine markers of rats after implantation for 8 weeks in diverse groups. Table S5. List of abbreviations in order of appearance.