Screening of DEGs and immune microenvironment characteristics in IDD
Batch correction, normalization, and DEGs analysis were performed on microarray data (GSE124272, GSE70362, GSE147383, and GSE34095) between normal and IDD, the CIBERSORT method was used to the immune microenvironment in IDD. Figure 1A-D show that T follicular helper T cells and M2 macrophages were significantly increased in IDD, while resting mast cells were significantly decreased (P < 0.05).
Identification of immune cell-related genes infiltrating degenerative intervertebral discs
WGCNA was used to identify genes related to immune cell infiltration among the DEGs. As shown in Fig. 2A-C, These DEGs were then divided into modules with different colors, we selected the blue module, as it is the most important module associated with M1 macrophages, with a positive correlation of 0.87 and P < 0.001 (Fig. 2D), and GO enrichment analysis of genes in the blue module showed mainly enriched in the macrophage activation, myeloid leukocyte activation, and Toll-like receptor 4 signaling pathways (Fig. 3A). The genes enriched in the above three signaling pathways included VAMP8, TLR4, JUN, PLA2G4A, NMI, RORA, IFNGR1, IFNGR2, NINJ1, TNIP1, and CD81, which are considered immune cell infiltration-related genes.
Changes in the proportions of infiltrating immune cells in degenerated intervertebral discs of rats
The gating strategies are presented in Fig. 4A., including leukocytes (CD45+), lymphocytes (CD45 + CD11b/c-), T lymphocytes (CD3+), CD4 + T cells (CD3 + CD4+), CD8 + T cells (CD3 + CD8+), B lymphocytes (CD11b/c-CD45R+), NK cells (CD3-CD161+), NKT cells (CD3 + CD161+), M1 macrophages (CD11b/c + CD86+), and M2 macrophages (CD11b/c + CD206+). Figure 4B shows On the 14th day after puncture, the proportion of leukocytes in intervertebral disc tissue was the greatest (P < 0.05). The proportions of other types of immune cells, although not significantly different, exhibited the following trend: On the 14th day, CD4 + T cells accounted for the greatest percentage. On the 3rd day, the percentage of CD8 + T cells was greatest, whereas on the 7th day, the proportions of M2 macrophages and B cells were greatest (Supplementary Fig. 1).
Supplementary Fig. 1
Single-cell transcriptome data show cellular heterogeneity in intervertebral disc degeneration tissues
We first performed gene filtering and quality control on the gene expression matrix. Then, the UMAP cell groups and cell subpopulations of intervertebral disc tissue were annotated (Fig. 5A). The results showed a high degree of cellular heterogeneity, in which intervertebral disc cells were separated into seven main clusters, namely, nucleus pulposus cells, annulus fibrosus cells, macrophages, monocytes, vascular endothelial cells, smooth muscle cells, and fibroblasts, and a proportion analysis of seven types of cells was performed (Fig. 5B), which were measured using classical markers (Fig. 5C). The expression of Cd14 and Vcan in different cell populations is shown in violin plots (Fig. 5D). The heatmap displays different marker genes in each cell group (Fig. 5E). The UMAP plots of immune cell infiltration-related gene distribution and expression in the IVD cell subpopulation showed that Jun, Cd81, Rora, Vamp8, Ninj1, and Tnip1 were strongly expressed (Fig. 6A).
Intercellular communication in intervertebral disc degeneration
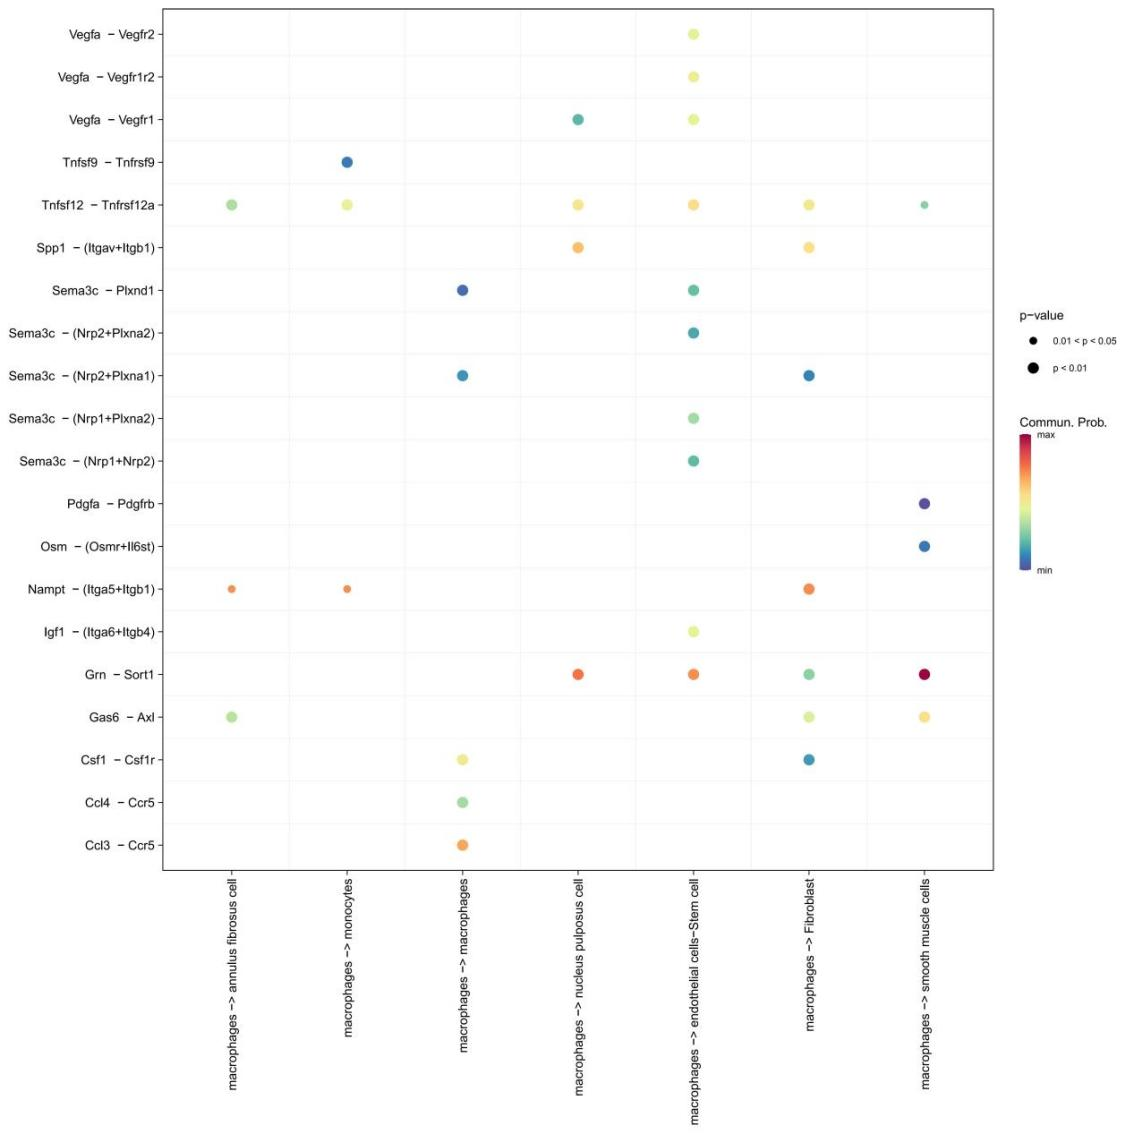
To further understand the key factors involved in the pathological mechanism of IDD, we investigated the cellular communication network between the main cell types involved in IDD. CellPhoneDB analysis of these 7 subpopulations in IDD revealed the intercellular communication signaling network. Supplementary Fig. 2 shows the probabilities of ligand receptor pairs communicating between macrophages and nucleus pulposus cells, annulus fibrosus cells, monocytes, endothelial cells, smooth muscle cells and fibroblasts. Receptor–ligand pairs, including VEGF, play important roles in intercellular communication.
Supplementary Fig. 2
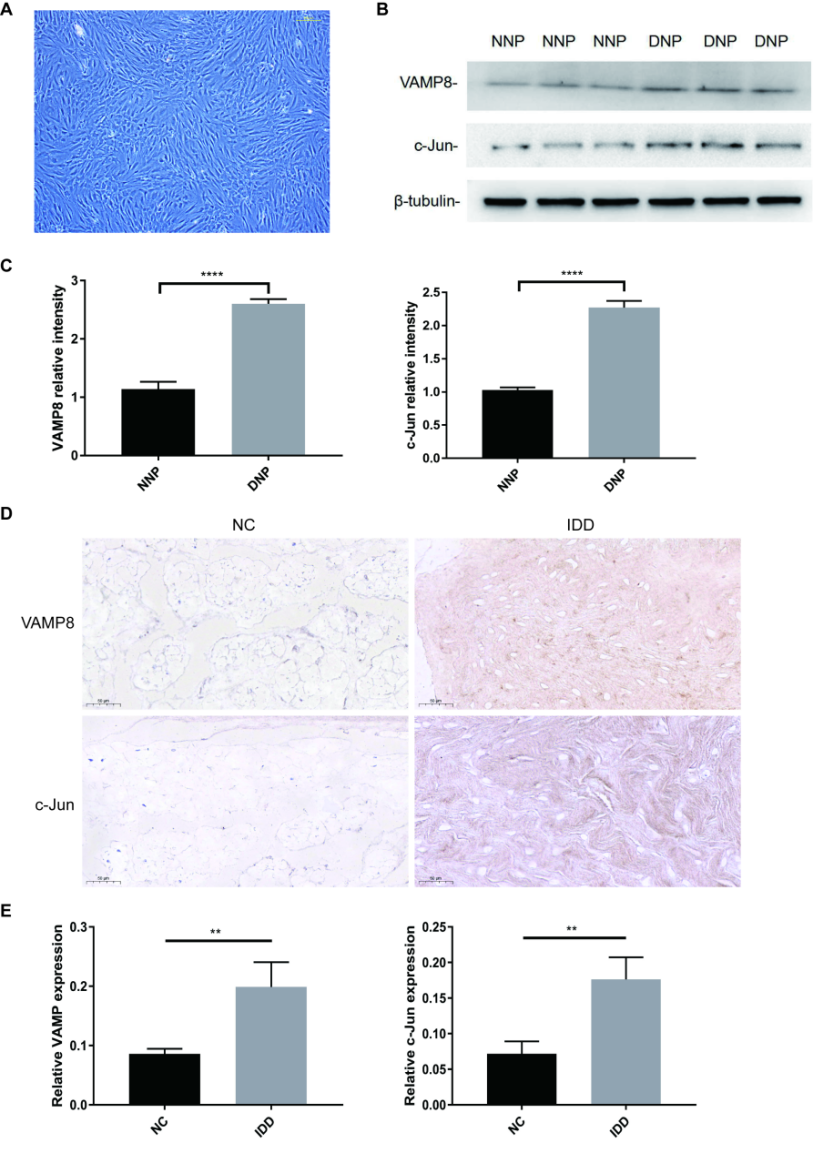
Changes in VAMP8 and c-Jun in DNP and IDD rats
The human primary NP cells that were extracted had a spindle-shaped morphology and robust growth, as shown in Fig. 7A. The protein blot findings indicated that the levels of VAMP8 and c-Jun were increased in the DNP group (Fig. 7B-C). Immunohistochemical analysis revealed elevated levels of VAMP8 and c-Jun expression in IDD discs compared to those in normal discs in rats (Fig. 7D-E).