Antibodies and chemicals
OZ-001 used in this study was synthesized as previously reported1,16. Antibodies against cleaved PARP-1, cleaved caspase 9, cleaved caspase 3, total STAT3, and phosphor STAT3 were purchased from Cell Signaling Technology (Danvers, MA, USA). Antibodies against β-actin, BAX, BCL-2, BAK, CDK4, CDK6 Mcl-1, cyclin D1, Cyclin D2, Cyclin D3, survivin, Cav 3.2, CamKII-2 and glyceraldehyde 3-phosphate dehydrogenase (GAPDH) were purchased from Santa Cruz Biotechnology Inc (Santa Cruz, CA, USA). Mounting medium with 4’,6-diamidino-2-phenylindole (DAPI), Paclitaxel, and Gemcitabine were purchased from Sigma-Aldrich (St. Louis, MO, USA). IL-6 was purchased from the R&D system (Minneapolis, USA). Z-VAD-FMK (Z-Val-Ala-Asp-fluoromethyl ketone) was obtained from MP Biomedicals (Santa Ana, CA, USA).
Cell culture
MDA-MB-231 cells and MIA PaCa-2 cells were obtained from the Korean cell line Bank (Seoul, Republic of Korea). The cells were cultured in RPMI medium containing 1% antimycotic/antibiotic solution (100 units/ml of penicillin, 100 micrograms per milliliter (ug/ml) of streptomycin), along with 10% heat-inactivated FBS, in a 5% CO2 atmosphere at 37 ℃.
Animals care and management
All studies followed regulations established by the Institutional Animal Care and use committee at Jeonbuk national university, protocol number JBNU 2019 − 00382, NON2023-092. All methods were conducted in accordance with relevant guidelines, regulations, and protocols approved by Jeonbuk national university IACUC. The reporting in this manuscript follows the ARRIVE guidelines46. Six- to eight-week old BKINbt:BALB/c/nu/nu mice were obtained from Damul, Daejeon Republic of Korea, and were used for tumor xenografts. Mice were housed and maintained at the animal facility of Jeonbuk Medical School under standard temperature (22℃±2℃) and humidity (45% relative humidity) conditions, according to ethics guidelines. Sterilized wood shaving bedding and cardboard cylinder enrichment were used in every case with a 12-h light/dark cycle. All the mice were provided with ad libitum access to sterilized food and filtered water, and handling was performed after an adaptation period of 3 days. For euthanasia, mice were administered intraperitoneal (IP) with Ketamine (Yuhan, Korea) at a dose of 50 mg/kg and Xylazine (Hongik medicare, Korea) at a dose of 10 mg/kg based on their body weight for anesthesia.
In vivo tumor xenograft model
Post acclimatization, BKINbt:Balb/c nude male mice were randomly divided into 5 groups(n = 7/group). MDA-MB-231 cells (8 x 10⁶) and MIA PaCa-2 (5 x 10⁶) in 50% matrigel (Corning, NY, USA) were pre-injected with subcutaneous implantation into the mice. Volumes were injected into mice by subcutaneous implantation. Volumes were calculated using the equation [tumor volume (cubic millimeters (mm3)) = (tumor length) × (tumor width)2 × 0.5] 47. After tumor volume reached about 100 mm3, MDA-MB-231 derived xenograft mice were treated with ethanol, cremophor, and distilled water in 1:1:18 (Group 1, vehicle). Similarly, Groups 2, 3, and 4 xenograft mice received 15, 30, and 60 mg/kg OZ-001 orally. Group 5, positive control group, xenograft mice received 10 mg/kg of paclitaxel (intraperitoneal injection (IP)). All the mice received treatment for 66 days. The dosage schedule for each group is shown in Fig. 6A. On day 66, mice were sacrificed using 50mg/kg doses of Ketamine and 10mg/kg does of Xylazine, after which tumor tissues were obtained. Similarly, MIA PaCa-2-derived xenograft mice were treated with ethanol, cremophor, and distilled water in 1:1:18 (Group1, vehicle). Group 2, 3, and 4 xenograft mice received 15, 30 and 60 mg/kg OZ-001 orally. Group 5, positive control group, xenograft mice received 20 mg/kg of gemcitabine (IP). On day 53, mice were sacrificed sacrificed using 50mg/kg doses of Ketamine and 10mg/kg does of Xylazine, after shich tumor tissue obtained. Throughout the treatment, tumor volume and body weight were measured twice a week in both xenograft models.
Cytotoxicity assay
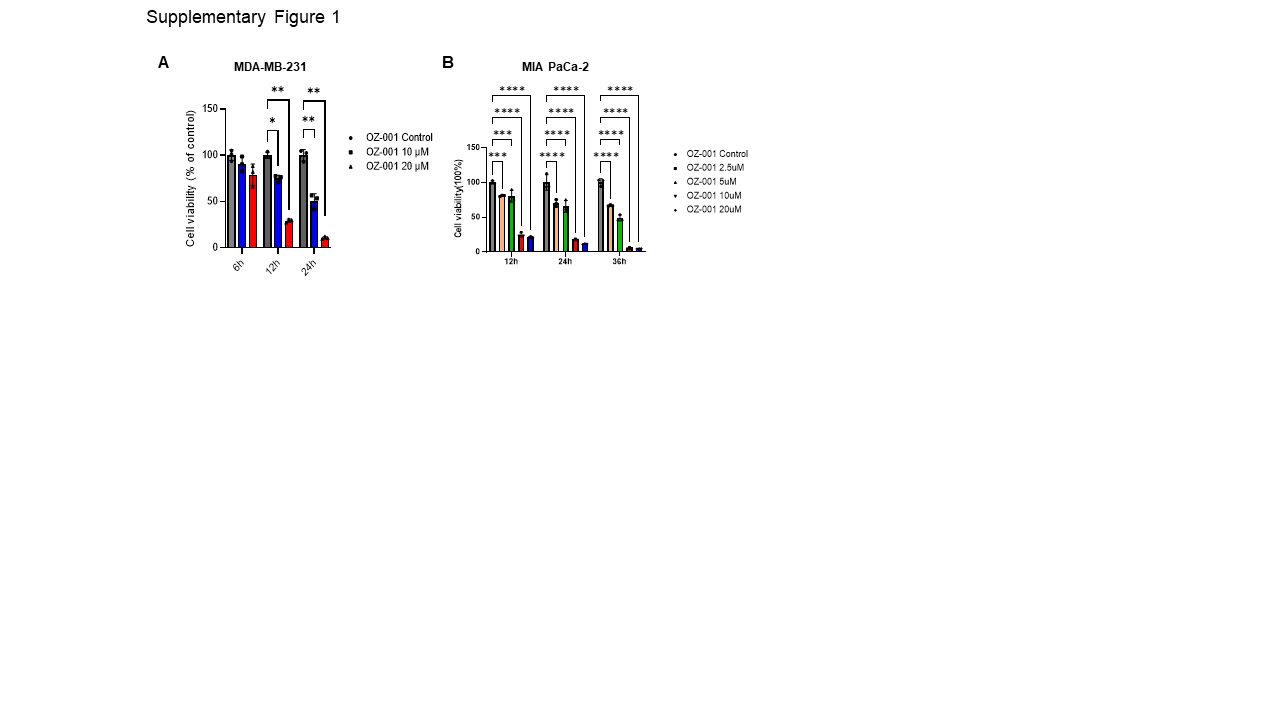
Cytotoxicity of OZ-001 in MDA-MB-231 and MIA PaCa-2 cells were analyzed using MTT assay. The cells were treated with various concentrations of OZ-001 and incubated for 6, 12, or 24h. To investigate the effect of caspase inhibitor, cells were pre-treated with Z-VAD-FMK for 1h and then treated with OZ-001. Following the predetermined OZ-001 treatments, the cells in the culture medium were removed, and incubated with 5 ug/ml MTT for 3 h. Next, the cells were dissolved in the reduced formazan crystals in 100 microliter (ul) DMSO by incubating at 37℃ in the dark. Finally, cell viability was measured using a microplate reader by recording the absorbance at 540 nanometer (nm).
Annexin V-FITC (Fluorescein Isothiocyanate) and Propidium Iodide (PI) Double Staining Assay
To detect apoptotic cells, cells were treated with OZ-001 harvested by trypsin and washed twice with phosphate-buffered saline (PBS). The cell pellets were added in 100 ul of suspension buffer, having 5 microliter (µL) fluorescein isothiocyanate (FITC)-conjugated annexin V and 5 µL PI. The cell suspension was gently vortexed and then incubated in the dark at room temperature for 15 min. Following the incubation, 400ul of binding buffer was added, and cells were analyzed by Fluorescence-activated cell sorting (FACS) cytometer (Cytomics FC500, Beckman Coulter, CA, USA).
Terminal deozynucleotidyl transferase dUTP nick end labeling (TUNEL) assay
TUNEL assay was performed using the DeadEnd™ fluorometric TUNEL system (Promega, WI, USA). OZ-001 treated cells were fixed and permeabilized, while tumor tissues were fixed in 10% paraformaldehyde (PFA) and embedded in paraffin. Subsequently, the TUNEL mixture was applied according to the manufacturer’s instructions. All the samples were analyzed using an LSM510 confocal microscope (Carl Zeiss, Baden-Wurttemberg Germany) and AxioVision software
Cell cycle analysis
MDA-MB-231 and MIA PaCa-2 cells were treated with various concentrations of OZ-001 for 24 h. The treated cells were fixed by adding 70% EtOH to the cell suspension for at least 1h at 4 ℃. The fixed cells were incubated in a staining buffer (PB) containing 100 µg/ml RNase A. Then, 1.0 ml of 50 µg/ml propidium iodide is added and incubated at 4℃ for 4 h. Cell cycle analysis was performed using flow cytometry BD FACS Calibur II, BD Biosciences (CA, USA).
Western Blot Analysis
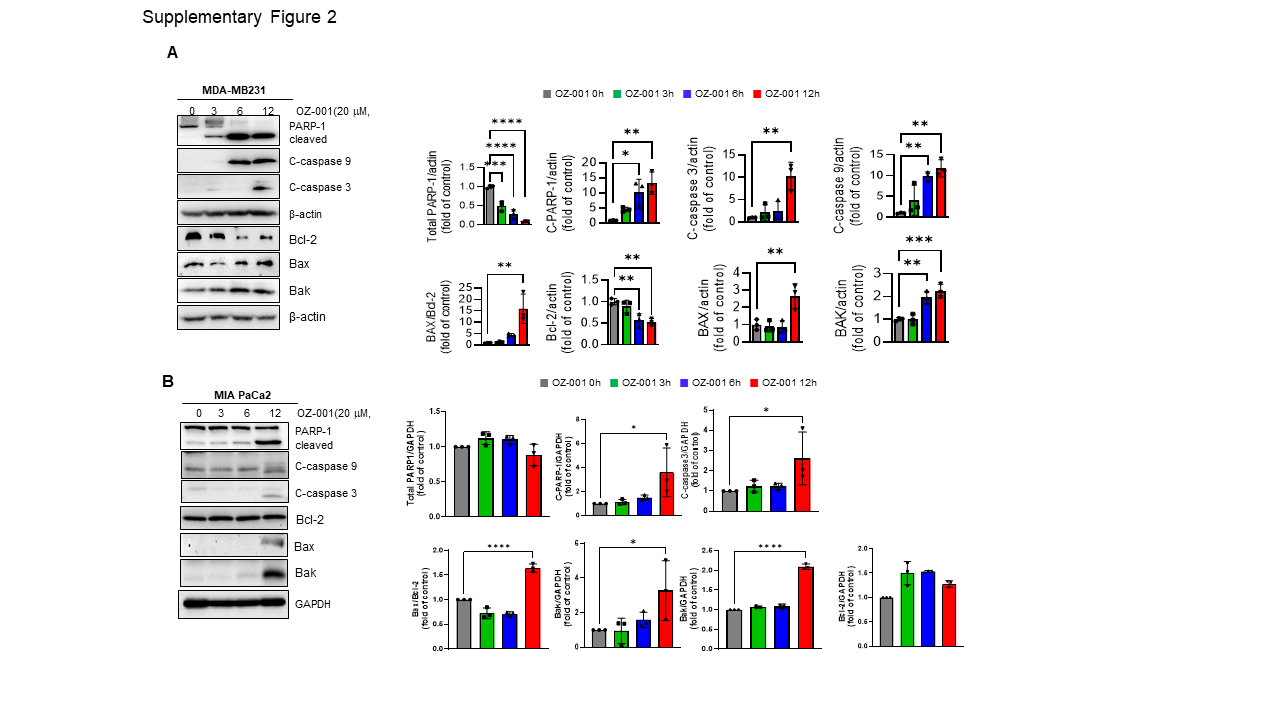
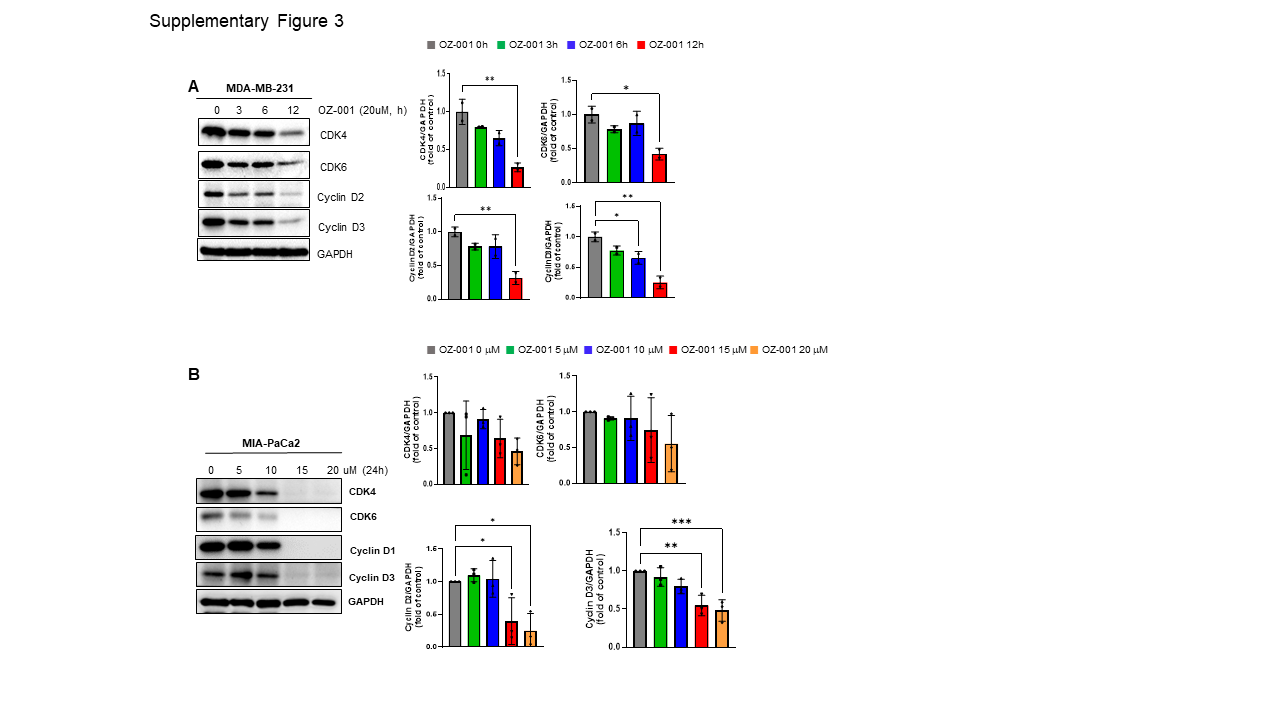
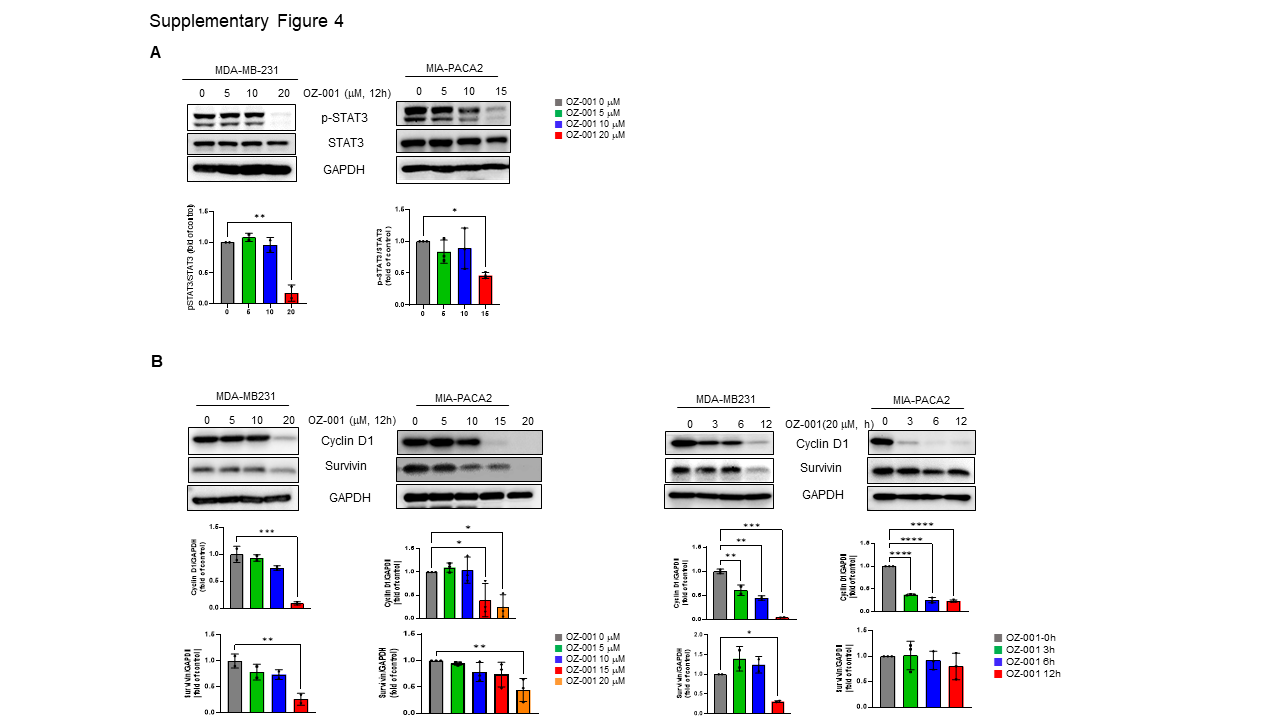
Immunoblotting was performed to investigate changes in the specific protein expression upon OZ-001 treatment. The cells/tissues were lysed in lysis buffer for 30 min at 4 ℃, and homogenates were separated by 7–12% SDS-PAGE and transferred onto Polyvinylidene difluoride (PVDF) membrane. The membrane was subsequently incubated in 5% skim milk for 1h at room temperature to block the non-specific binding of the protein. Next, the membrane was incubated with the primary antibody overnight at 4 ℃. Later, blots were washed thrice with Tris-buffered saline (TBS) containing 0.1% Tween-20 and then incubated with horseradish peroxidase (HRP)-conjugated secondary antibody for 2h at room temperature. The blots were again washed thrice with Tween-20-Tris-buffered saline and finally detected using the ECL system (Super Signal™ West Pico PLUS Chemiluminescent substrate, Thermo Fischer, MA, USA). Quantification of protein signals was done using Image J (National Institutes of Health, Bethesda, MD).
Intracellular calcium measurement
The intracellular calcium level ([Ca2+]) was measured using Ca2+ sensitive dyes as described previously [8]. MDA-MB231 cells were treated with 20 µM of OZ-001 for 1h. Cells were then incubated with 4µM Fluo-2 acetoxymethyl ester (Fluo-4-AM) dissolved hanks’ balanced salt solution − 4-(2-hydroxyethl)-1-piperazineethanesulfonic acid (HBSS-HEPES) buffer for 20 min at 37 0C. Then, washed cells with 100µl of HBSS-HEPES buffer loaded into a FlexStation® (Molecular Devices, CA, USA), to measure fluorescence intensity. All compounds were prepared in dimethyl sulfoxide (DMSO) as a stock solution (100 mM) and diluted three to four times with HBSS-HEPES buffer to achieve the final concentrations.
FP assay
Fluorescence polarization (FP) assay was measured as reported earlier 25. Briefly, 100nM full-length glutathione S-transferase (GST)-tagged human STAT3 protein (Abcam, Cambridge, UK) along with varying concentrations of OZ-001, S31-201.1066, Stattic and S3I-1757 were incubated in assay buffer consisting of 10mM HEPES, pH7.5, 50 mM NaCl, 1 mM ethylenediaminetetraacetic acid (EDTA), 2 mM dithiothreitol (DTT), and 0.01% Triton-X100 for 1h at room temperature in 96-well black plates (Corning, NY, USA) with mild agitation. In all assays, a fluorescent peptide 5-FAM-G(pTyr) LPQTV-CONH2 (Genscript Biotech, Piscataway, NJ, USA) was added to each well at a final concentration of 10 nM. and incubated with fluorescent peptide for 30 min at room temperature with a mild agitation. The plates were examined for FP using a Fluorescein Dual instrument equipped with an excitation filter FITC FP 480 and an emission filter FITC FP P-pol 535 and S-pol 535. The data obtained from these experiments were analyzed % C = (mPdrug-mPfree)/(mPSTAT3-mPfree) *100, where mP represents the value for the fluorescence polarization measurement. All the data were expressed in percentage control.
Immunofluorescence analysis
MDA-MB-231 and MIA PaCa-2 cells seeded onto confocal dishes (SPL). After OZ-001 treatments, the cells were rinsed in PBS and fixed in 4% PFA (Thermo fisher Sceintific, MA, USA) for 20 min. The cells were blocked with 0.1% bovine serum albumin (BSA) (Sigma Aldrich) for 30min and then incubated overnight at 4˚C with STAT3-p antibody. The cells were incubated fluorescein secondary antibody for 1 h. The specimens were mounted with Prolong Gold anti-fade reagent containing DAPI(Invitrogen). Images were analyzed with LSM510 confocal microscope (carl Zeiss) and AxioVision software.
Immunohistochemistry
All tumor tissue from MDA-MB231/ MIA PaCa-2 derived xenograft mice were fixed with 10% formaldehyde and embedded paraffin. After de-paraffinization and rehydration, tissue sections were immersed in 10mM sodium citrate solution (Vector Laboratories, INC, Newark, CA, USA) for heat-induced epitope retrieval using a pressure cooker. Sections were then incubated with peroxidase blocking solution for 10 min at room temperature (RT). After washing with 1xTBST buffer (Scytek Lab, Logan, UT, USA), sections were subjected to a non-specific protein block for 10min at RT and subsequently incubated at 4℃ with primary antibodies against p-STAT3 and PCNA. After incubation with secondary antibodies for 1 hour at RT, AEC substrate chromogen (DAKO, Glostrup, Denmark) was added in the sections. Finally, the sections were mounted using an aqueous medium (Scytek Lab).
Analysis of expression differences of CACNA1H genes in cancers and normal tissues
To explore the differential expression of the CACNA1H gene between cancer and normal tissues in breast and pancreatic cancers, gene expression data were obtained from the GDC Data Portal within the TCGA (https://portal.gdc.cancer.gov/). For prostate cancer, the limited number of normal tissue samples available in TCGA (n = 4) necessitated the use of an alternative source. Consequently, gene expression data for prostate cancer were retrieved from the TCGA TARGET GTEx study within the UCSC Xena database (https://xena.ucsc.edu/) 48 to include additional normal tissue samples from the GTEx project.
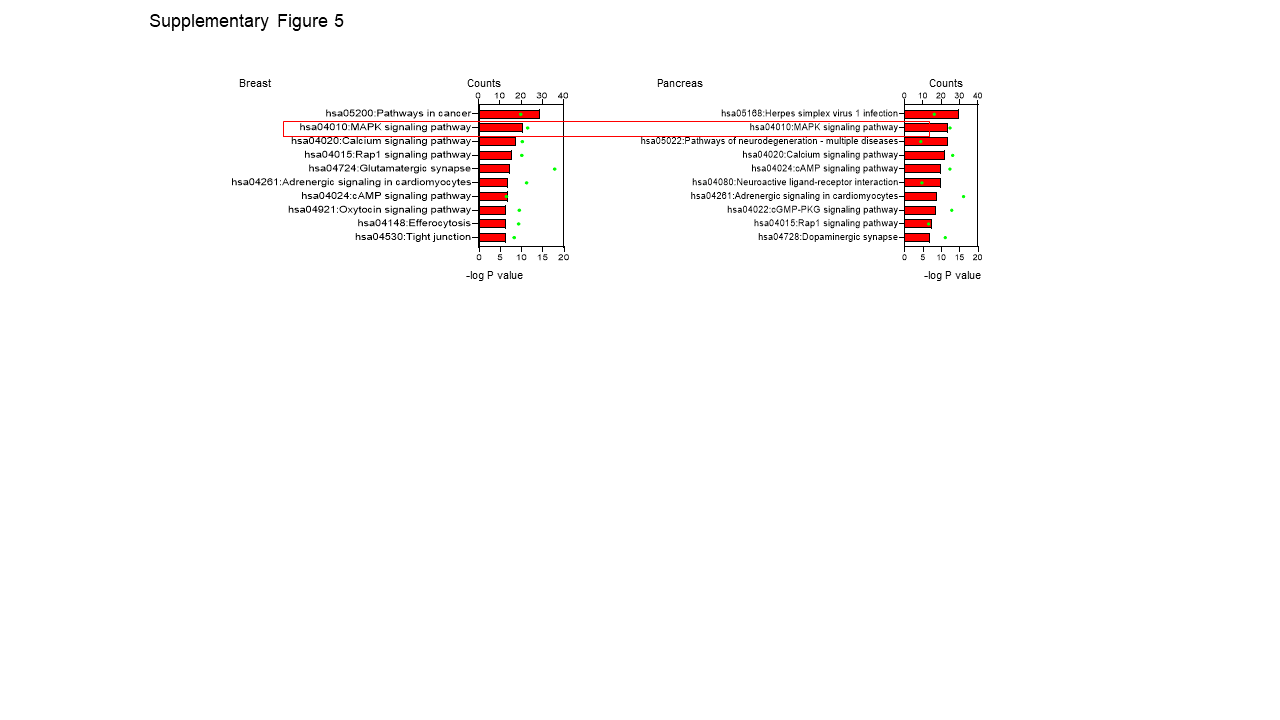
Correlation and Gene Ontology Analysis
We performed a correlation analysis of the CACNA1H gene in breast and pancreatic cancer patient groups. The analysis was conducted using the Correlation AnalyzeR web tool (https://gccri.bishop-lab.uthscsa.edu/shiny/correlation-analyzer/)49. Only genes with a Pearson's correlation coefficient (R-score) of 0.5 or higher were considered to have a significant correlation with CACNA1H gene expression. Gene ontology analysis was conducted using the significantly correlated gene list via the DAVID platform 50.
Statistical Analysis
All statistical analysis was performed using Prism v9.4.1 software (GraphPad, San Diego, CA, USA). Data represent the mean ± standard deviation (SD) from three independent experiments. Statistical differences were detected with Student’s unpaired t-test, one-way ANOVA followed by Tukey’s post hoc test, and two-way ANOVA followed by Bonferroni’s post hoc test. *p < 0.05; **p < 0.01, ***p < 0.001, ****p < 0.0001 vs. untreated control group.
Ethics approval
All animal experiments were performed in accordance with the guidelines for the care and use of laboratory animals of Jeonbuk National University Institutional Animal Care and Use Committee (JBNU 2019 − 00382, NON2023-092). Patients’ data from public database TCGA, UCSC Xena and AnalyzeR web tool have obtained. Additionally, all procedures and methods were performed in accordance with ARRIVE guidelines46.