High-throughput screening for Mango II RNA-binding fragments
To develop a novel TO-derived fluorophore, we first analyzed the binding pockets for ligands within the Mango aptamers. The binding modes of TO1-based ligands in all four Mango aptamers were compared qualitatively and using ICM MolSoft Pocketfinder software (Figure S1). Analysis of the co-crystal structure of TO1-Mango II complex (PDB: 6C63) revealed that the ligand binding pocket is hydrophobic and within acceptable volume for recognizing small molecule ligands. When bound to the aptamer, TO1-Biotin stacks on the guanine tetrads and interacts with A12 and A17, while the biotin sidechain was solvent exposed and not resolved in the crystal structure. By docking a structure of TO (which lacks the biotin-bearing sidechain) to the Mango II aptamer, we found that an empty space exists within the pocket. We reasoned that this space could accommodate a separate fragment, potentially linked through the methyl group on TO, that could be leveraged to improve binding (Fig. 1A and S2).
To efficiently identify a TO co-binder, we developed fragment microarrays that could be used to screen tagged Mango aptamers in the presence or absence of the TO ligand. Briefly, a total of 2,214 fragments were curated and purchased from Enamine, all of which contained amine and alcohol groups compatible with array manufacture. Fragments were printed onto isocyanate-modified glass slides based on previously reported methods for small molecule microarray (SMM) fabrication.40 In parallel, a screening construct consisting of the Mango II RNA tagged with a poly-A tail was annealed with a Cy5-poly(dT) oligonucleotide. This construct was dissolved in a folding buffer containing140 mM KCl, annealed, and analyzed by circular dichroism (CD) to confirm proper aptamer folding. The screening construct exhibited a maximum at 263 nm and a minimum at 240 nm, consistent with a folded, parallel G4 structure. These features were not observed in LiCl buffer (Figure S3). Once proper folding was confirmed, arrays were incubated with the screening construct, and the fluorescence intensity for each spot was quantified (using Z-scores, across two replicates). In parallel, a second screen was performed in the presence of a saturating concentration (10 equivalents) of TO. Pearson correlation coefficient (r) values for Mango II and Mango II + TO assays were 0.81 and 0.84, respectively, confirming a reproducible screen (Figure S4A). In contrast, comparing the two different screening results yielded a Pearson correlation of 0.04, indicating that distinct sets of compounds scored as hits in the presence versus absence of TO (Fig. 1B). A total of 30 fragments (F1-F30) were identified as hits for Mango II RNA (Figure S4B). Binding of 11 fragments was non-competitive with TO (F1-F11, Figure S5), while the remaining 19 were identified as competitive (F12-F30, Figure S6). We hypothesized that some of the non-competitive hits may bind to the available pocket in the Mango aptamer (Fig. 1A).
Characterization of Fragment Binding to Mango II
For the 11 fragments showed non-competitive binding behavior with TO by SMM, we explored whether any fragments impacted ligand fluorescence. We performed a fluorescence intensity assay by titrating fragments into a solution containing the TO-Mango II complex. Titrations contained a TO concentration of 500 nM so that binding to the Mango II pocket (KD = 100 nM) was fully saturated. Fluorescence was measured as a function of fragment concentration. Six non-competitive fragments (F1, F2, F3, F5, F6, and F10) significantly enhanced the TO fluorescence (ranging from 5–116%), while the other five showed weak or no effects (Fig. 2A). Several fragments (F1-F3) capable of enhancing fluorescence contained similar structural chemotype (Figure S7). In addition, competitive binders, including three representative fragments (F28, 29 and 30) and two G4 stacking ligands (BRACO19 and PhenDC3), were also tested and indeed showed competition in fluorescence assay, emphasizing our ability to identify co-binding fragments. Among all the fragments, F2 showed the most promising fluorescence enhancement behavior with an EC50 value of 52 ± 19 µM and 95% improvement in fluorescence intensity (Fig. 2A and S7), along with high Z scores (Fig. 2B) and was selected for further study. F2 itself is not fluorescent, emphasizing that the fragment enhanced the fluorescence of TO itself (Figure S8). Together, these observations both validate the ability of SMMs to identify noncompetitive ligands, and also remarkably revealed that noncompetitive and non-covalently binding ligands can enhance the fluorescence of TO.
Characterization of F2 as a co-binder with TO to Mango II RNA
Binding of F2 to the TO-Mango II complex was characterized by multiple approaches. Surface plasmon resonance (SPR) was performed using polyA-containing Mango II RNA annealed a with biotinylated poly(dT) oligo, immobilized on a streptavidin surface. Injection of F2 (500 µM) or TO (1 µM) yielded binding signals of 10 ± 1 and 41 ± 2 response units (RU), respectively. Injecting both TO and F2 resulted in an observed binding level of 52 ± 4 RU, roughly equivalent to the sum of the response observed for individual components (Fig. 2C), and thus confirming co-binding. Fitting titrations of F2 showed a KD of 700 ± 260 µM. In a parallel experiment, samples were pre-equilibrated with saturating (500 nM) TO and then titrated with F2. In the presence of TO, the dissociation constant remained similar (KD= 450 ± 120 µM), indicating that TO binding to the RNA does not significantly impact the KD of F2. (Figure S9). In parallel, fluorescence titrations were used to confirm the observation that F2 binding does not influence the KD of TO for the aptamer. (Figure S10).
Binding of F2 was also evaluated using water ligand observed gradient spectroscopy (waterLOGSY) NMR. Here, positive phasing of the ligand peaks identifies a binding interaction (Fig. 2D). Under these conditions, F2 only bound to Mango II RNA in the presence of TO. In contrast, omitting other components (TO or RNA) led to the negative-phasing NMR spectrum, indicating no interaction. Together, these results confirm that F2 occupies an RNA binding site distinct from TO.
Linking TO and F2 yields a dye with enhanced fluorescence
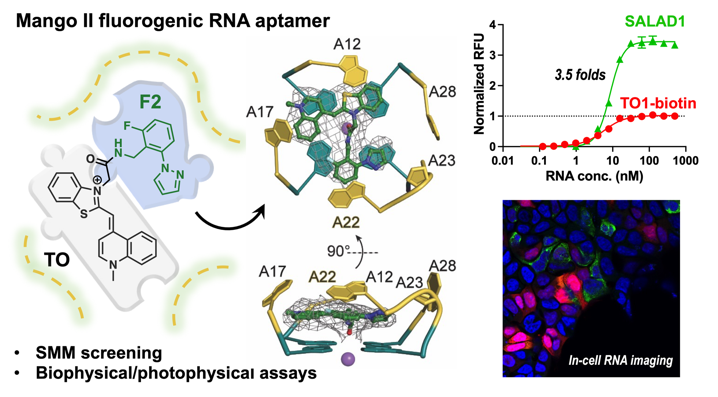
Encouraged by the observation that non-covalently bound F2 enhanced the fluorescence of TO, we designed and synthesized new fluorescent probes by linking TO with F2 and related compounds. We developed a four-step route to synthesize a new dye, consisting of F2 linked to TO through an amide linker adjacent to the benzothiazole ring of TO (Fig. 3A, Supplementary Methods). The new ligand, Structure-informed, Array-enabled LigAnD, was named SALAD1. In addition, we synthesized three additional analogs lacking functional groups on the fragment benzyl ring—one lacking the fluorine (SALAD3), one lacking the pyrazole ring (SALAD4), and another lacking both groups (SALAD2) (Fig. 3A, Supplementary Methods).
Relative to TO (\(\:\lambda\:\)ex = 510 nm, \(\:\lambda\:\)em = 533 nm) and TO1-Biotin (\(\:\lambda\:\)ex = 510 nm, \(\:\lambda\:\)em = 535 nm), SALAD1 has a similar but slightly red-shifted excitation and emission profile (\(\:\lambda\:\)ex = 511 nm, \(\:\lambda\:\)em = 540 nm) (Table 1, Fig. 3B). SALAD1 also displayed a slightly larger Stokes shift of 29 nm relative to TO (22 nm) and TO1-Biotin (25 nm). Similar excitation and emission profiles were observed for the other analogs (Figure S11). Relative fluorescence intensities of the dyes were compared through a fluorescence intensity assay (Fig. 3C). The SALAD1 compound displayed greater than 3.5-fold brighter fluorescence than TO and TO1-Biotin at high RNA concentrations. Our other analogs showed lower fluorescence intensities than did SALAD1 and TO, emphasizing that all molecular features of F2 are necessary to enhance fluorescence.
Further photophysical characterization revealed that SALAD1 displays properties similar to existing TO-based dyes (Table 1). When bound to Mango II, SALAD1 shows a 514-fold fluorescence enhancement, compared to 643- and 647-fold turn-on for TO and TO1-Biotin, respectively. The extinction coefficient of SALAD1 (45,422 M− 1cm− 1) is also comparable to the extinction coefficients for TO (53,784 M− 1cm− 1) and TO1-Biotin (77,500 M− 1cm− 1). SALAD3 is the only other analog that displayed similar properties, with a turn-on of 711-fold and an extinction coefficient of 30,235 M− 1cm− 1. SALAD2 and SALAD4 showed significantly weaker fluorescence enhancement values and lower extinction coefficients indicating that the pyrazole ring plays a critical role for these properties.
Apparent KD values were determined for each compound using dose-dependent fluorescence intensity assays (Fig. 3C, S12, and Table 1). SALAD1 (KDapp = 0.69 ± 0.1 nM) binds 7.5-fold more tightly to Mango II compared to TO (KDapp = 5.9 ± 1.4 nM), demonstrating that the new dye had a significantly improved binding affinity to the aptamer. The observed binding affinity is comparable to TO1-Biotin (KDapp = 0.85 ± 0.2 nM), despite the difference in fluorescence intensities. Intriguingly, SALAD2 (KDapp = 0.27 ± 0.03 nM), SALAD3 (KDapp = 0.29 ± 0.02 nM), and SALAD4 (KDapp = 0.21 ± 0.03 nM) all displayed tighter binding affinities to Mango II in fluorescence intensity assays, indicating that binding affinity and fluorescence intensity are not directly related for this system.
TO is known to bind nonspecifically to nucleic acid structures, limiting its utility in targeted imaging applications.41 We assessed the selectivity of SALAD1 by measuring fluorescence when incubated with representative RNA and DNA structures, including several G-quadruplexes (Table S1). SALAD1 showed changes in fluorescence intensity in the presence of all four generations of Mango and fluoresced brightest when bound to Mangos II and III (Fig. 3D). In contrast, weaker or no binding was observed to other G4 and with non-G4 nucleic acid structures, indicating selective interactions at relevant concentrations.
Table 1
Photophysical properties of TO-based fluorophores
| Dye | Free dye abs. max (nm) | \(\:\:{\varvec{\lambda\:}}_{\varvec{e}\varvec{x}\varvec{c}}^{\varvec{m}\varvec{a}\varvec{x}}\)(nm) | \(\:{\varvec{\lambda\:}}_{\varvec{e}\varvec{m}}^{\varvec{m}\varvec{a}\varvec{x}}\)(nm) | \(\:{}_{\varvec{a}\varvec{b}\varvec{s}}^{\varvec{m}\varvec{a}\varvec{x}}\)(M− 1cm− 1) | Turn-on (fold) | KD (nM) |
| TO | 500 | 510 | 533 | 53,784 | 643 | 5.9 ± 1.4 |
| TO1-Biotin | 510 | 510 | 535 | 77,500a | 647 | 0.85 ± 0.2 |
| SALAD1 | 497 | 511 | 540 | 45,422 | 514 | 0.69 ± 0.1 |
| SALAD2 | 496 | 510 | 532 | 14,307 | 11 | 0.27 ± 0.03 |
| SALAD3 | 497 | 515 | 541 | 30,235 | 711 | 0.29 ± 0.02 |
| SALAD4 | 497 | 509 | 532 | 22,448 | 19 | 0.21 ± 0.03 |
a Obtained in a previous study25
X-ray crystal structures reveal unique binding mode of new dyes
We determined co-crystal structures of our new fluorophores with the Mango II RNA at 2.85–3.0 Å resolution (Table S2, Supplementary Methods). All of the new fluorophores bind the aptamer RNA with a 1:1 stoichiometry, and in the same binding pocket as occupied by TO1-Biotin (Figure S13).19 Two of the new ligands (SALAD1 and SALAD3) fill the binding pocket to a larger extent than TO1-Biotin (Fig. 4 and S14). The buried solvent-accessible area for SALAD1 and SALAD3 are 590.4 Å2 and 594.0 Å2, respectively, whereas Mango II buried 529.1 ± 5.1 Å2 (average of two well-resolved crystallographically-independent complexes in the structure ± s.d.) In contrast, SALAD2 and SALAD4 have a less extensive RNA interface than TO1-Biotin (burying 514.6 Å2 and 514.8 Å2, respectively). Regardless of the degree of occupancy of the binding site, the fluorophores exhibit multiple binding poses in all of our co-crystal structures. Thus, the new ligands do not completely resolve the binding-site promiscuity originally noted for the Mango II-TO1-Biotin complex (PDB:6C63).19
When TO1-Biotin binds to Mango II, it creates an unoccupied a cavity adjacent to RNA residue A22. This purine nucleotide adopts a similar conformation in the TO1-Biotin complex and in complexes with the new fluorophores, except in the SALAD1 complex. In the SALAD1-containing structure, A22 adopts the syn- glycosidic bond conformation (rather than the anti- conformation present in all other Mango II complex structures), and the purine base is displaced to the top of the fluorophore (Fig. 4B and S15). Binding of SALAD1 thus results in a substantial rearrangement of the fluorophore-binding pocket of the RNA. Further, the carbonyl oxygen of the amide group of SALAD1 is uniquely within coordination distance (3.1 Å) from the K+ ion of the adjacent G-quadruplex (at the precision of the current atomic coordinates; Table S2). Altogether, the larger interfacial area, the enhanced interaction with A22 resulting from the RNA conformational change, and the additional metal ion coordination are consistent with the improved properties of SALAD1.
In-cell confocal imaging of Mango II RNA using the improved dye
Historically, efforts to improve fluorescent aptamers as in-cell imaging tools have focused on altering brightness, photostability, and background signal. Mango II-TO1-Biotin has been used to image RNA localization in cells via single molecule fluorescence microscopy,13 but only limited work has been published using confocal microscopy to image Mango systems,25, 42 likely due to insufficient brightness. Confocal microscopy enables the capture of high-resolution images of in-focus light, making it a powerful technique for imaging RNA fluorogenic aptamers that might otherwise display background fluorescence. HEK293T cells were transfected with the previously described24 mCherry-Mango II x 24 plasmid which allows both protein and RNA expression levels to be monitored in cells in the same imaging experiment. Cells were fixed and treated with 2 µM of either SALAD1 or TO1-Biotin and prepared for imaging.
In cells with stained with Hoechst dye to image nuclei (Fig. 5A and E), Mango II-containing RNA transcription (Fig. 5B and F) and mCherry expression (Fig. 5C and G) were observed via fluorescent imaging. The new SALAD1 dye visually fluoresces brighter than TO1-Biotin when bound to Mango II in cells (Figure. 5B and F). Additionally, mean fluorescence intensity is 3-fold brighter (Figure. 5I). Thus, SALAD1 as a dramatically brighter fluorophore, is suitable for confocal imaging and holds notable potential for imaging RNA in whole cells.