Data description
Diseases and conditions of interest were selected from the Disease Database provided by the Unified Medical Language System (UMLS) (28, 29) and combined into the Health Conditions Data Set (HCDS) comprising a total of 122 terms, which are categorized into seven groups: Dementia (24 conditions), Diabetes (12 conditions), Arthritis (9 conditions), Heart Conditions/Diseases (14 conditions), Hypertension (11 conditions), Cancer (12 conditions), and Substance Use Disorders (SUD) (40 conditions/substances). All the selected terms are formal names for diseases and health conditions and the last group (SUD) additionally contains the most common substances of abuse (Table 1).
Table 1
Health Condition Data Set. Diseases, conditions, and substances are grouped by the type and color coded regarding their attribution.
| # | Name | UMLS code | # | Name | UMLS code | # | Name | UMLS code | # | Name | Code | # | Name | UMLS code |
| Dementia | 26 | Monogenic Diabetes | c3888631 | 52 | Atrial Fibrillation | c0004238 | 77 | Osteosarcoma | c0029463 | 103 | Methadone | c0025605 |
| 1 | Aids Dementia Complex | c0001849 | 27 | Steroid-Induced Diabetes | c0342269 | 53 | Cardiac Arrhythmia | c0003811 | 78 | Pancreas Carcinoma | c0235974 | 104 | Hydrocodone | c0020264 |
| 2 | Alcohol Amnestic Disorder | c0001940 | 28 | Type 1 Diabetes Mellitus | c0011854 | 54 | Rheumatic Heart Disease | c0035439 | 79 | Prostate Cancer | c0376358 | 105 | Meperidine | c0025376 |
| 3 | Alcohol-Induced Mental Disorders | c0033936 | 29 | Type 2 Diabetes Mellitus | c0011860 | 55 | Myocardial Infarction | c0027051 | 80 | Melanoma | c0025202 | 106 | Oxycodone | c0030049 |
| 4 | Alzheimer Disease, Early Onset | c0750901 | 30 | Maturity Onset Diabetes Mellitus In Young | c0342276 | 56 | Cardiomyopathies | c0878544 | Substance abuse disorder | 107 | Oxymorphone | c0030073 |
| 5 | Alzheimer Disease, Late Onset | c0494463 | 31 | Cystic Fibrosis Related Diabetes | c2242728 | 57 | Atrial Septal Defects | c0018817 | 81 | Alcohol Abuse | c0085762 | 108 | Diacetylmorphine | c001189 |
| 6 | Amyotrophic Lateral Sclerosis | c0002736 | 32 | Gestational Diabetes | c0085207 | Hypertension | 82 | Ethanol | c0001962 | 109 | Mitragynine | c0066619 |
| 7 | Corticobasal Degeneration | c0393570 | 33 | Wolfram Syndrome 1 | c4551693 | 58 | High Blood Pressure | c0020538 | 83 | Amphetamine | c0002658 | 110 | Hydromorphone | c0012306 |
| 8 | Dementia Associated with Alcoholism | c0236656 | Arthritis | 59 | Chronic Hypertension | c0745114 | 84 | Cannabicyclohexanol | c3492502 | 111 | Loperamide Hydrochloride | c0282221 |
| 9 | Dementia, Vascular | c0011269 | 34 | Arthritis | c0003864 | 60 | Essential Hypertension | c0085580 | 85 | Synthetic Cannabinoids | c0006864 | 112 | Delysid | c0024334 |
| 10 | Frontotemporal Dementia | c0338451 | 35 | Ankylosing Spondylitis | c0038013 | 61 | Malignant Hypertension | c0020540 | 86 | Cannabidiol | c0936079 | 113 | Ketamine | c0022614 |
| 11 | Hand | c4285693 | 36 | Psoriatic Arthritis | c0003872 | 62 | Hypertensive Crisis | c0020546 | 87 | Central Nervous System Depressants | c0007681 | 114 | Mescaline | c0025460 |
| 12 | Hiv Encephalopathy | c0276548 | 37 | Pyogenic Arthritis | c0003869 | 63 | Isolated Systolic Hypertension | c0745133 | 88 | Dextromethorphan | c0011816 | 115 | Ecstasy Abuse | c0743247 |
| 13 | Huntington's Disease | c0020179 | 38 | Rheumatoid Arthritis | c0003873 | 64 | Resistant Hypertension | c0745130 | 89 | Barbiturates, Benzodiazepines | c0004745 | 116 | Psilocybin | c0033850 |
| 14 | Lewy Body Disease | c0752347 | 39 | Fibromyalgia | c0016053 | 65 | Gestational Hypertension | c0852036 | 90 | Flunitrazepam | c0016296 | 117 | Salvia | c3668955 |
| 15 | Major Neurocognitive Disorder | c4087461 | 40 | Reactive Arthritis | c0085435 | 66 | Secondary Hypertension | c0155616 | 91 | Rohypnol | c0699927 | 118 | Phencyclidine | c0031381 |
| 16 | Mild Cognitive Disorder | c1270972 | 41 | Gout | c0018099 | 67 | Cerebrovascular Accident | c0038454 | 92 | Opium | c0029112 | 119 | Nandrolone | c0027368 |
| 17 | Mild Neurocognitive Motor Disorder | c2609165 | 42 | Degenerative Polyarthritis | c0029408 | 68 | Transient Ischemic Attack | c0007787 | 93 | Sodium Oxybate | c0037537 | 120 | Oxandrolone | c0029995 |
| 18 | Parkinson's Disease | c0030567 | Heart disease/condition | Cancer | 94 | Cathine | c0069021 | 121 | Oxymetholone | c0030072 |
| 19 | Presenile Dementia | c0011265 | 43 | Angina Pectoris | c0002962 | 69 | Breast Cancer | c0006142 | 95 | Tobacco | c0040329 | 122 | Testosterone Cypionate | c0076181 |
| 20 | Prion Disease | c0162534 | 45 | Heart Failure | c0018801 | 70 | Cervical Cancer | c0007847 | 96 | Nicotine | c0028040 | |
| 21 | Senile Dementia | c0002395 | 46 | Congenital Heart Defects | c0018798 | 71 | Colorectal Cancer | c0009402 | 97 | Khat | c1386575 |
| 22 | Senile Psychosis | c1457889 | 47 | Heart Valve Disease | c0018824 | 72 | Leukemia | c0023418 | 98 | Benzoylmethylecgonine | c0009170 |
| 23 | Subcortical Vascular Dementia | c0393561 | 48 | Coronary Artery Disease | c1956346 | 73 | Lymphoma | c0024299 | 99 | Methylphenidate | c0025810 |
| Diabetes | 49 | Peripheral Artery Disease | c1704436 | 74 | Malignant Lung Neoplasm | c0242379 | 100 | Codeine | c0009214 |
| 24 | Prediabetes Syndrome | c0362046 | 50 | Coronary Arteriosclerosis | c0010054 | 75 | Malignant Neoplasm Of Skin | c0007114 | 101 | Morphine | c0026549 |
| 25 | Latent Autoimmune Diabetes in Adults | c1739108 | 51 | Disorder Of Pericardium | c0265122 | 76 | Neuroblastoma | c0027819 | 102 | Loperamide | c0023992 |
We hypothesized that there are spatial clusters within the AGATHA space that correspond to different groups of health conditions (Table 1). This implies that by mapping genes within the AGATHA space and analyzing their positions relative to disease groups, we can uncover previously unrecognized links between specific gene sets and health conditions. These genes are specifically evaluated for potential drug repurposing opportunities.
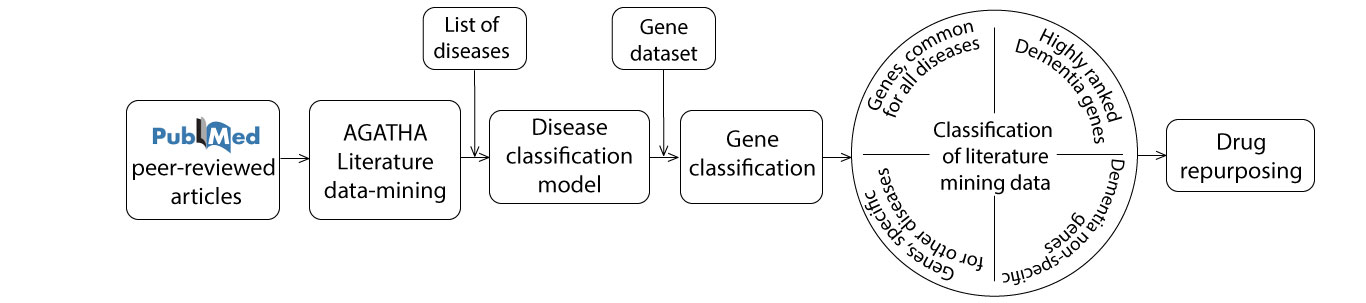
A general logical workflow is represented in Scheme 1 below. Disease-categorized data from a variety of databases was mapped to the AGATHA space for further characterization. Then, classification methods were used to build a discrimination model that extracted four lists of genes: 1) genes specific for each disease class; 2) Dementia genes, highly ranked in other disease classes; 3) Disease genes, highly ranked in Dementia class, and 4) genes common for all diseases. These groups of genes were used for pathway analysis performed using g:profiler tool (23), which helped to select the candidates for drug repurposing evaluation.
Exploratory analysis of semantic links revealed by the AGATHA embedding space.
The complex relationships between the selected health condition terms (30, 31) (Table 1), described across multiple diverse scientific articles, were assessed using AGATHA text mining software. Following semantic embedding, these health condition terms are represented as points within a high-dimensional latent space, the embedding space we named earlier as AGATHA space (see the first paragraph of the Results section). The coordinates of these terms are calculated to reflect their semantic properties in such a way that words or phrases with similar meanings are represented by points that are closer to each other within the space. The number of dimensions in an embedding space is typically influenced by the volume and complexity of the text data being analyzed. However, it is also determined by the specific requirements of the model and the task at hand. While a larger and more complex dataset might benefit from a higher-dimensional space to capture more nuanced semantic relationships, the choice of dimensionality also depends on computational constraints and the desired balance between detail and efficiency. In our case, preliminary studies indicated that an efficient embedding of the information contained within the PubMed database of scientific abstracts is achieved by using an embedding space with 512 dimensions (8). In Fig. 1, we see the relative positions of HCDS groups as visualized in 3D space. This visualization is the result of condensing the original 512-dimensional data into a more comprehensible three-dimensional space using Principal Component Analysis (PCA). Two distinct clusters are formed by two non-overlapping sets of health conditions: SUD (green diamonds) and Dementia (red diamonds). The five remaining sets — Diabetes, Arthritis, Heart Diseases, Hypertension, and Cancer — form a tight spatial cluster that is separated from both the SUD and Dementia clusters. Subclusters corresponding to these five groups of health conditions remain distinguishable. However, they are positioned close to each other resulting in the overlap of certain groups. These observations have led us to hypothesize that the AGATHA space contains a spatial pattern characteristic of the health condition groups. In further sections we implement advanced statistics to identify and characterize such patterns.
Classification analysis of health condition groups mapped to the AGATHA space.
The validity of spatial patterns in the AGATHA space associated with health condition groups was tested using PLSDA, a standard partial least square classification approach. In this study, we leverage both the interpretability of the multiclass PLSDA models and their capability to effectively handle collinear data. The strong predictive performance of the PLSDA models was subsequently employed to investigate gene/health condition associations.
PLSDA classification has been demonstrated to be a successful method for addressing multivariate data, offering tunable model complexity (18). We used PLSDA to build a supervised classification model (Fig. 2) with classes defined by health condition groups (Table 1). Extensive preliminary classification trials (not reported here) enabled the identification of optimal data preprocessing and classification parameters. For the final classification model, the input matrix containing coordinates in 512-dimensional AGATHA space for all health conditions was preprocessed using normalization by the total area and auto-scaling. Despite the high dimensionality of the input data generated through complex algorithms implemented in the AGATHA text mining software, four latent variables were sufficient to produce a robust classification of health conditions. Generally, latent variables are calculated so that each subsequent latent variable captures the shared variance remaining after the extraction by the previously calculated variables. A total of 16.31% of the data was covered by the first four latent variables.
The stability of the PLSDA classification model was verified using the Venetian blinds cross-validation approach, which involves dividing the data into ten equally sized folds. The final classification model effectively categorizes health conditions into seven predefined groups, as shown in Fig. 2.A, demonstrating cross-validated sensitivity and specificity parameters within the range of 0.786 to 0.990. As expected from the exploratory analysis (Fig. 1), the Dementia and SUD classes exhibited the best classification performance. The Dementia panel in Fig. 2.A reveals that all health conditions initially selected for the Dementia group have a probability close to 100% of being classified as part of the Dementia class. Note that the 0–1 range on the Y-axis in the panel corresponds to a 0-100% range of probabilities. These observations suggest that all the health conditions we originally selected for the Dementia group constitute a distinct spatial cluster in the AGATHA space. Furthermore, should a small portion (one-tenth) of the Dementia set be omitted as 'unknown' health conditions during the training phase, these 'unknowns' are likely to be accurately classified in subsequent classification analysis. Interestingly, this observation holds true not only for Dementia and SUD, but also for Diabetes. In Fig. 1, Diabetes is the most distant from the Dementia and SUD groups, neighboring but not overlapping with the other groups. Discriminating between the Arthritis, Cancer, Heart Disease/Condition, and Hypertension groups is also achievable, as shown in the Discussion section, despite overlapping regions. Two distinct pairs of groups can be identified: the Heart Disease/Condition and Hypertension pair, and the Arthritis and Cancer pair (Fig. 2.A corresponding panels). Health conditions originally selected for these four groups overlap and show a non-zero probability of being assigned to another class of the pair. The proximity and overlap of the Heart Disease/Condition and Hypertension groups can be explained by the shared physiological characteristics of these disorders(32). There are also certain connections between Cancer and Arthritis, such as associations with chronic inflammation and paraneoplastic arthritis(33). While considering the physiological origins of connections within these two pairs of health condition groups is beyond the scope of this proof-of-concept study, we will later demonstrate that, upon more detailed analysis of the overlapping groups (see black circles in Figs. 2.B and C), it is possible to build a robust classification model for discrimination of all groups.
Assigning human genes to health condition groups using AGATHA latent space and advanced statistical methods.
Text mining algorithms provide a unique opportunity to connect scientific concepts using lexical context. As demonstrated above, the AGATHA algorithm successfully condensed scientific information within the PubMed database, capturing lexical context characteristics of the health condition groups we selected for this proof-of-concept study. In this section, we explore the ability of the AGATHA system to uncover hidden connections between genes and health conditions. This was achieved by mapping all human genes to the AGATHA space and categorizing them into health condition groups using the PLSDA classification model. This step was followed by an in-depth analysis of the identified gene clusters in the context of diseases, physiological pathways, and drugs known to interact with these pathways.
The complete list of human genes, mapped to the AGATHA space as a matrix with 20,889 rows and 512 columns, was analyzed using the PLSDA model developed for HCDS. Figure 3 illustrates the distribution of genes among all disease classes, with the color bar showing their attribution to the Dementia class in each category.
As seen in the figure above, the distribution of Dementia genes does not follow the same pattern across all other classes. At this point, the evaluation of gene distribution in the Dementia class is necessary to show that the calculated model is coherent from the biological point of view. To achieve this, genes with a probability exceeding 80% were analyzed using hierarchical clustering. This approach aided in investigating the internal structure of the data, followed by the pathway analysis of the calculated clusters.
A total of 1079 genes with high probability to be associated with dementia were identified by the classification model and further subjected to unsupervised cluster analysis using agglomerative Ward’s method with a total of four principal components and Mahalanobis distance that accounts for the variations of multivariate data (Fig. 4).The selected threshold allowed for gene separation into four distinct clusters that were further subjected to a pathway analysis to justify the biological meaning of data distribution.
The dendrogram in Fig. 4 shows four well-separated gene clusters, each defined by specific biological processes and mechanisms. These assignments were determined through pathway analysis, which can be summarized as follows:
Compared with Clusters 2–4, Cluster 1 is separated from the remaining data at the initial threshold level, indicating its unique characteristics. Pathway analysis revealed that the processes within Cluster 1 do not show direct connections to specific physical or behavioral anomalies and cannot be linked to any specific disease category. However, this information is still useful when genes from this cluster are mapped as high-ranked in other disease categories. Cluster 2 has a strong connection to several kinds of pathways known to be altered in neurodegenerative conditions including but not limited to Alzheimer's disease, Amyotrophic lateral sclerosis, Parkinson's disease, and Apoptosis - multiple species as labeled by g-profiler. Cluster 3 has characteristics analogous to Cluster 2, such as nervous system development, presynaptic endocytosis, neuron projection organization, visual perception, regulation of neuron projection development, dendrite morphogenesis, and regulation of cell projection organization, and neuron projection. Some of the pathways discussed here are relevant to conditions such as Parkinsonism, disturbances in higher cognitive functions, central motor function disruptions, Ataxia, speech impairments related to the nervous system, and the life cycle of the HIV-1 virus. Cluster 4 is different from the other three by having pathways related to substance abuse. It includes nicotine, cocaine, amphetamine addictions, alcoholism, and some pathways connected to the nervous system such as neuroactive ligand-receptor interaction, dopaminergic synapse, retrograde endocannabinoid signaling, axon guidance, and many more (Additional Table 1. Summary of pathways and genes for the Dementia class).
As a result, we acquired a list of genes with a high probability of being connected to Dementia as well as being simultaneously highly ranked in the remaining six classes. After evaluation by the GeneCards database, these genes were separated into one specific group (Additional Table 2. Dementia non-specific genes, highly ranked in other disease groups). Subsequently, highly ranked genes from the Diabetes, Arthritis, Heart, Hypertension, Cancer, and SUD classes were extracted for each disease/condition and were mapped in the Dementia group (Fig. 5). For most of the classes, they were not presented at the top of the probability scale, so only the ones with the highest likelihood to be connected to Dementia were combined. (Additional Table 3. Disease-specific genes, highly ranked in Dementia).
In addition to the described analyses, we followed the same procedure and extracted the top 1079 genes for each disease resulting in six lists: Diabetes, Arthritis, Heart conditions/diseases, Hypertension, Cancer, and SUD. These lists were reduced by retaining only genes distinct to each specific class of disorders to remove excessive overlapping of biological information. Based on these results, pathway analysis was performed for the specific gene lists and summarized in Table 2.
Table 2
Main pathways identified for the lists of specific genes for all disease classes.
| Disease | Number of genes | Significant pathways |
| Dementia | 518 | Glutamatergic synapse pathway, neuron development, axon development, Alzheimer disease, Amyotrophic lateral sclerosis, Dementia, Brain atrophy, Frontotemporal dementia, Parkinsonism, regulation of synaptic plasticity |
| Diabetes | 109 | Insulin and sugar metabolism-related pathways, glucose transmembrane transporter activity, insulin secretion, monosaccharide transmembrane transport, Type II diabetes mellitus, Abnormal hemoglobin |
| Arthritis | 32 | Immune response-activating cell surface receptor signaling pathway, activation of immune response, regulation of B cell receptor signaling pathway, protein deglutamylation, Abnormal lymphocyte proliferation |
| Heart | 67 | Blood circulation, regulation of blood circulation, regulation of heart contraction, regulation of heart rate, heart development |
| Hypertension | 0 | N/A |
| Cancer | 18 | DNA damage sensor activity, Homologous recombination, RAD51B-RAD51C-RAD51D-XRCC2-XRCC3 complex |
| SUD | 397 | Nicotine addiction, morphine addiction, cocaine addiction, Common pathways underlying drug addiction, Drug metabolism - cytochrome P450, drug adme, Steroid hormone biosynthesis, dopamine neurotransmitter receptor activity, dopamine secretion, modulation of chemical synaptic transmission, Retrograde endocannabinoid signaling |