Clinicopathological Data
26 patients were recruited into the study, blood samples were taken prior to neoadjuvant chemotherapy and post neoadjuvant chemotherapy. Breast cancer diagnosis was made following referral by imaging (mammography, ultrasound, magnetic resonance imaging (MRI)) and biopsy. Disease was staged and the presence of metastatic disease assessed via Computerised Tomography (CT)/Thorax, Abdomen, Pelvis (TAP) and bone scan. Clinicopathological details are presented in Table 1 and Table S1. The median age of the cohort was 46 (29-69) years. Median BMI for the cohort was 27 (18-38), with over 50% of the cohort in the overweight/obese category. 89% (23) of the patients were diagnosed with invasive ductal carcinoma (IDC) and 11% of patients (3) were diagnosed with invasive lobular carcinoma (ILC). Patients received neoadjuvant chemotherapy following discussion at a multidisciplinary team meeting. The majority of patients had locally advanced disease with no distant metastasis, while others had a triple positive or triple negative diagnosis with no lymph node metastasis diagnosis prior to treatment. The majority of patients were treated with the ACT chemotherapy regimen, which consists of doxorubicin (Adriamycin) and cyclophosphamide, followed by treatment with paclitaxel (taxane). Patients with human epidermal growth factor receptor 2 (HER2+) tumours also received Herceptin®. 1 patient developed neuropathy and did not complete paclitaxel treatment. Response to neoadjuvant chemotherapy was assessed prior to surgery using ultrasound, mammography or MRI. The majority (17 (65%)) of our cohort expressed oestrogen receptor (ER) and progesterone receptor (PR) positive as displayed in Table 1 and Supplementary Table 1. Four (15%) of the cohort expressed HER2 which was confirmed by fluorescence in situ hybridisation (FISH). The predominant molecular subtype in our cohort was ER+, PR+ and HER2- with 58% (15) of our cohort staining for this subtype. 8% were triple positive and 27% triple negative. Pathological stage was recorded post-surgery. Patient age, body mass index, tumour subtype, receptor status, molecular subtype, tumour grade, clinical stage, pathological stage, LVI, radiological response and pathological response (Miller-Payne grade) to chemotherapy are displayed in Table 1. (Insert Table 1)
CTC identification and enumeration
Modified Giemsa staining was used for the identification of CTCs on scanned images of the ScreenCell filters. Two pathologists reviewed the filters and identified CTCs on the basis of morphology, using the following criteria: intact cell, high nuclear:cytoplasmic ratio, hyperchromatic nucleus with coarse chromatin, and the presence of macro-nucleoli. CTC heterogeneity was observed with CTCs being identified as single cells (Figure 1A), doublets (Figure 1B) and clusters/microemboli (Figure 1C, 1D). CTC clusters/microemboli are defined as >3 CTCs [19] in a spatiotemporal pattern. CTCs were enumerated in the pre- and post- chemotherapy sample and classified according to the CellSearch™ cut-off of <5 or >5 CTCs; correlations with clinical parameters are shown in Table 1. Detailed CTC counts are displayed in Supplementary Table 1. As only 3mls of blood was used with the ScreenCell device, correlations were also assessed with the equivalent cut-off of 2 CTCs to correct for the volume used with the CellSearch™ device (data not presented). Data was also analysed categorising patients as positive or negative for CTCs (data not presented). (Insert Figure 1)
Correlation of CTCs with clinicopathological data
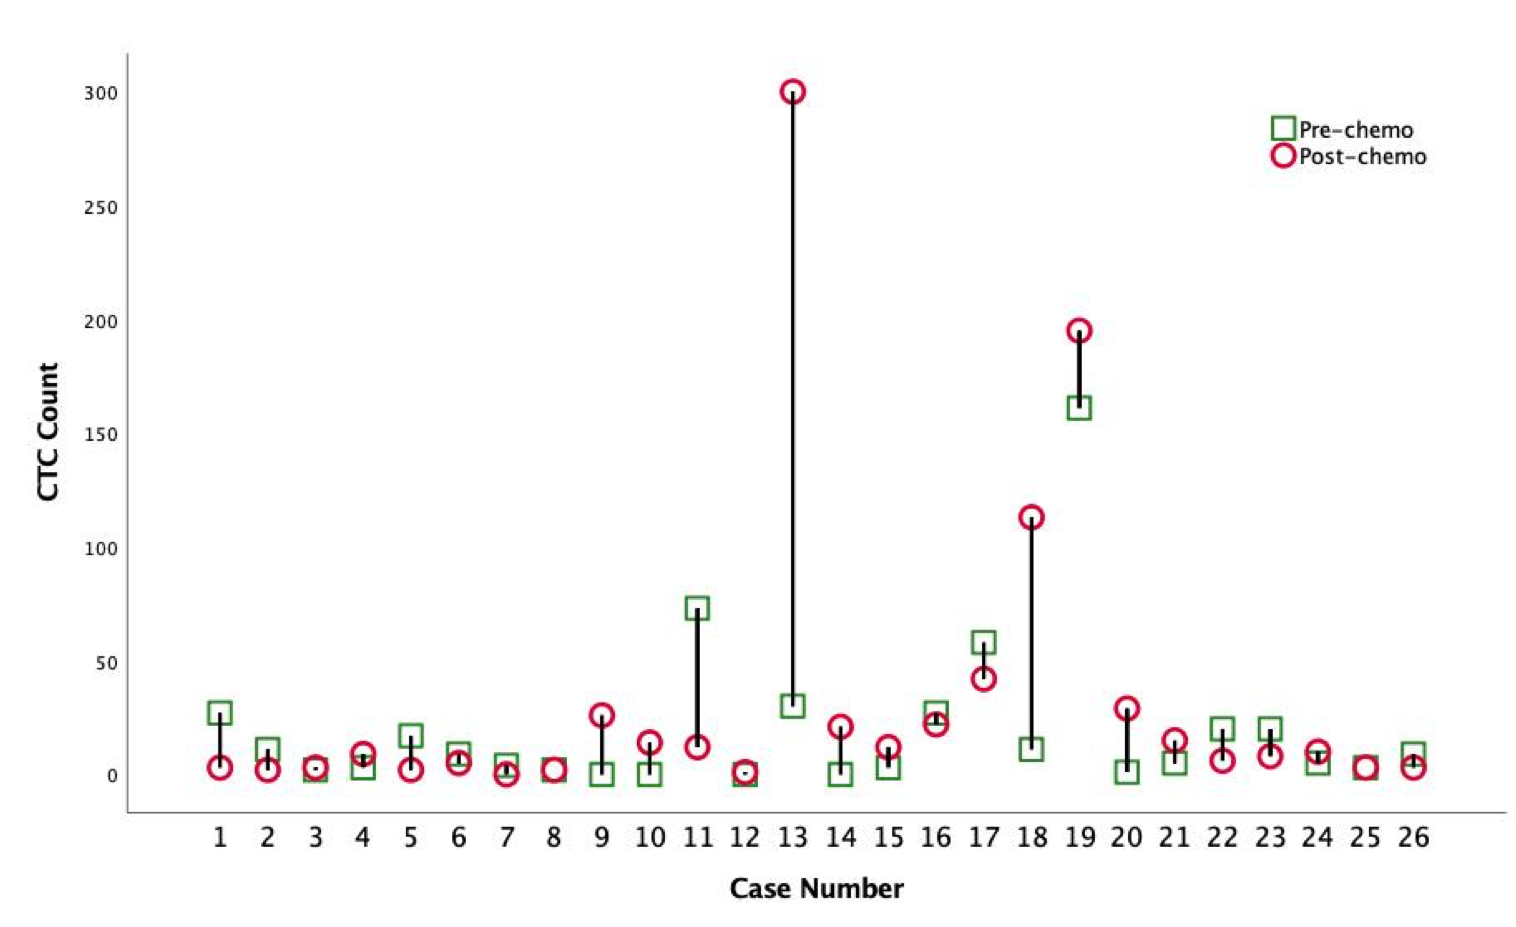
Data for CTC counts are presented in Table 1 and individual counts are detailed in supplementary Table 1. At baseline, 4 patients were CTC-negative. 7 patients had 1-4 CTCs and 15 patients had >5 CTCs as determined by Total CTC count in Supplementary Table 1. The median baseline number of CTCs was 7 (0-161). Post chemotherapy, 1 patient was CTC-negative, 8 patients had 1-4 CTCs and 17 patients had >5 CTCs. The median post-chemotherapy number of CTCs was 9.5 (0-300).
No significant association was identified between the number of CTCs (categorised < or >5 CTCs as per the CellSearch™ studies) in the pre-chemotherapy or post-chemotherapy blood sample and clinical characteristics, such as patient age, receptor status, molecular subtype, tumour grade, disease type, clinical or pathological stage (incorporating tumour size and lymph node metastasis), LVI, radiological response or Miller Payne Grade (Table 1). A significant correlation was observed between BMI and pre-treatment CTC count, p<0.05.
CTC counts were also categorised using 2 CTCs as the cut-off (correcting for the blood volume used) and as positive/negative but no correlation was observed.
CTC counts were correlated with corresponding blood parameters assessed on the same day as part of the routine work-up, including haemoglobin level, haematocrit, white cell count, CA153 if available and platelet count. No correlation was found between CTC count and any of these parameters (data not shown).
The change in total CTCs between the pre- and post-neoadjuvant chemotherapy samples was very variable between patients (Supplementary Figure 1), with some having a decrease of 61 CTCs while others had an increase of 270 CTCs. Overall, 13 (50%) patients experienced an increase in total CTCs, 10 experienced a decrease and 2 had no change.
65% of patients had a good response to neoadjuvant chemotherapy with a Miller Payne grade of 3 or more. Five patients (19%) had a Miller Payne grade of 5, or a complete pathological response to chemotherapy. This did not correlate with CTC counts, either pre- or post- chemotherapy or with the change in CTC numbers.
Correlation of CTC clusters with clinicopathological data
In addition to total CTC counts, the number of CTC clusters were also evaluated and assessed independently for clinical significance. No association was found between the total number of CTC clusters in a pre- or post- chemotherapy sample (also assessed as positive or negative for clusters) and the clinical factors of patient age, BMI, tumour subtype, receptor status, tumour grade, clinical or pathological tumour stage, LVI, radiological response or Miller Payne Grade. However, if we categorise clusters as < or >2 we do observe a correlation pre-treatment counts and BMI, p<0.05. The number of cells in each cluster was also counted as displayed in supplementary Table 1 but no correlation in this total cell count was observed with clinical parameters.
In relation to other blood parameters, no correlation was seen between CTC cluster counts and haemoglobin level, haematocrit, white cell count, CA153 if available and platelet count.
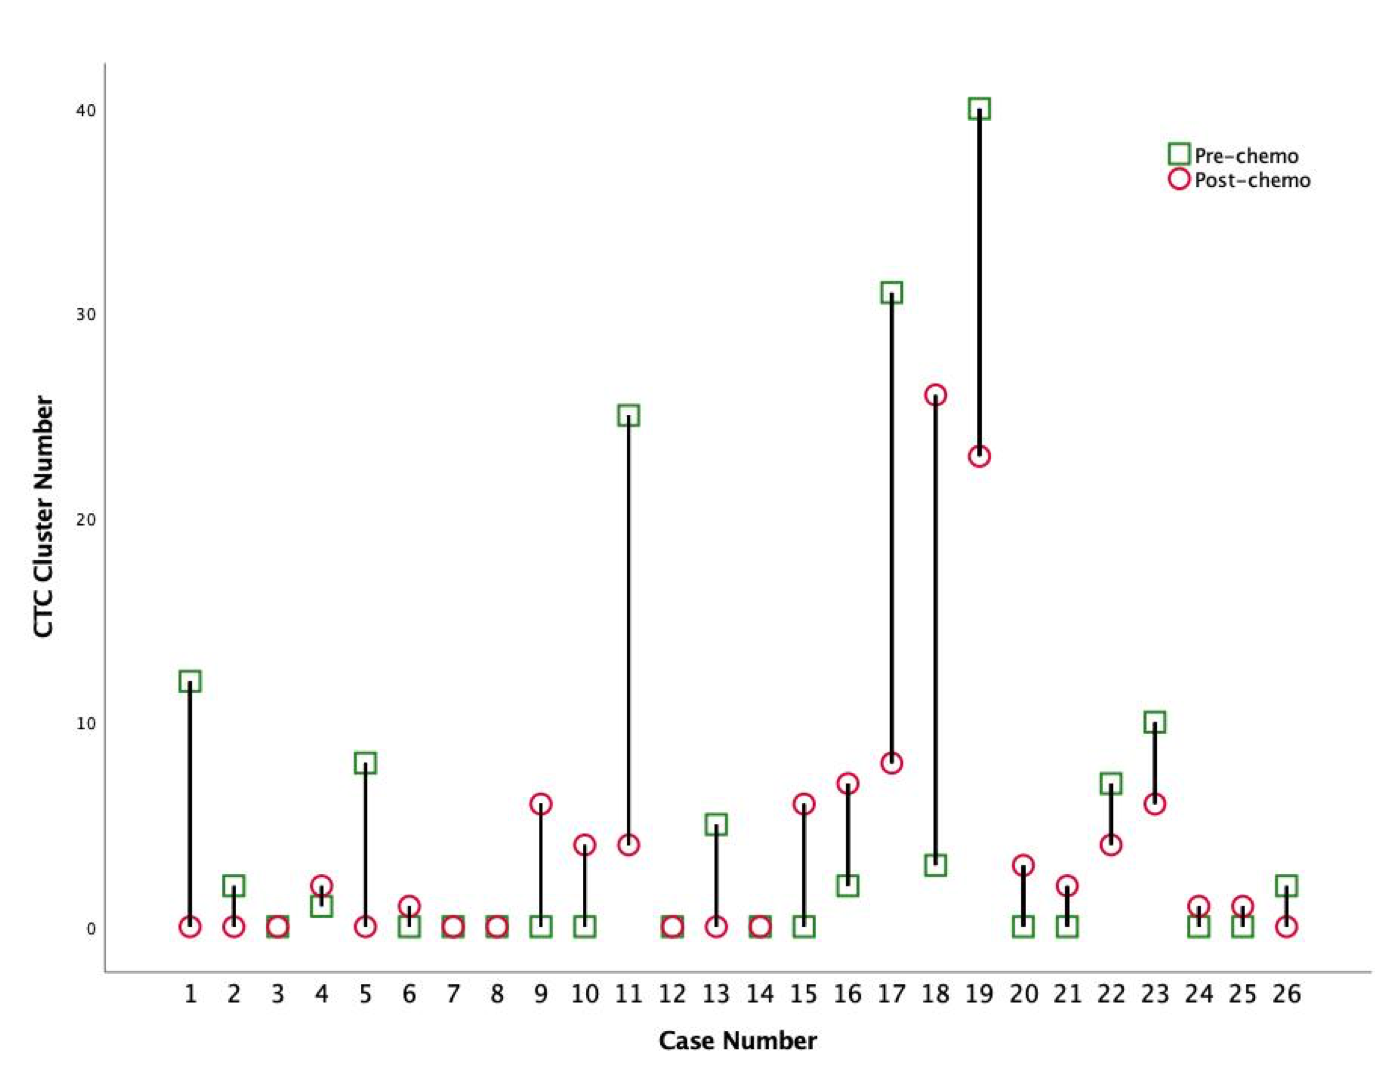
At baseline, 13 patients were negative for CTC clusters, 5 patients had 1-4 CTC clusters and 8 patients had >5 CTC clusters. The median baseline number of clusters was 0.5 (0-40). The change in CTC clusters was again very variable between patients (Supplementary Figure 2). Post chemotherapy, 10 patients were negative for CTC clusters, 9 patients had <5 CTC clusters and 7 patients had >5 CTC clusters. The median post-chemotherapy CTC cluster value was 1.5 (0-26). Overall, 11 (42%) patients experienced an increase in CTC clusters, 10 had a decrease in CTC clusters and 5 remained unchanged.
Correlation of CTCs with clinical outcome
We were unable to assess the prognostic potential of the CTC counts in our study to date as very few of the patients have presented with a recurrence. Only observational data can be presented at this stage. As outlined in Supplementary Table 1, following a 3-year follow-up, 21 patients are currently alive with no evidence of disease (ANED), 3 patients have had a recurrence (AWD) and 2 patients have died of disease (DOD). Of the 2 patients that died of disease, both had an increase in CTCs following chemotherapy, 1 had no CTCs at baseline. Of the 3 patients that had a recurrence, 1 had a decrease in CTCs post chemo, 1 had no change in CTCs between the pre and post chemo sample and the 3rd had an increase in CTCs (in particular in clusters). At this stage it would seem that the presence of CTCs post chemotherapy will have some prognostic potential, but it is not possible to reliably say this at this point. It is our intention to review this data for a 5-year follow-up and beyond if necessary.