Cell Culture and Reagents
The cell lines used in this study were sourced from the American Type Culture Collection (ATCC). Breast cancer (BC) cell lines, including MCF-7 and T47D, were cultured in Dulbecco's Modified Eagle's Medium (DMEM) supplemented with 10% fetal bovine serum (FBS) from Gibco, USA. Tamoxifen (TAM)-resistant cells (MCF-7R and T47DR) were developed through prolonged exposure of MCF-7 and T47D cells to TAM, and maintained with 2μM TAM. Cells were incubated at 37°C in a CO2 incubator. Tamoxifen (HY-13757A), rapamycin (HY-10219), and 3-methyladenine (3-MA, HY-19312) were obtained from MedChemExpress (MCE, Princeton, New Jersey, USA). Transfection with plasmids or lentiviral vector infection (GenePharma, Shanghai, China) was conducted, and stable lentivirus-infected cells were selected with 2μg/mL puromycin (HY-B1743A; MCE).
shRNA-resistant CST1 construction
The CST1/RAB1B shRNA and NC-shRNA constructs were inserted into the LV3-lentiviral vector, respectively, and the lentivirus stably carrying shRNA was harvested after continuous exposure to 3 μg/mL puromycin for 14 days. The CST1-shRNA lentiviral expression vector was obtained from Gene Pharma (Shanghai, China).
Clinical Tissue Samples and Patient Data
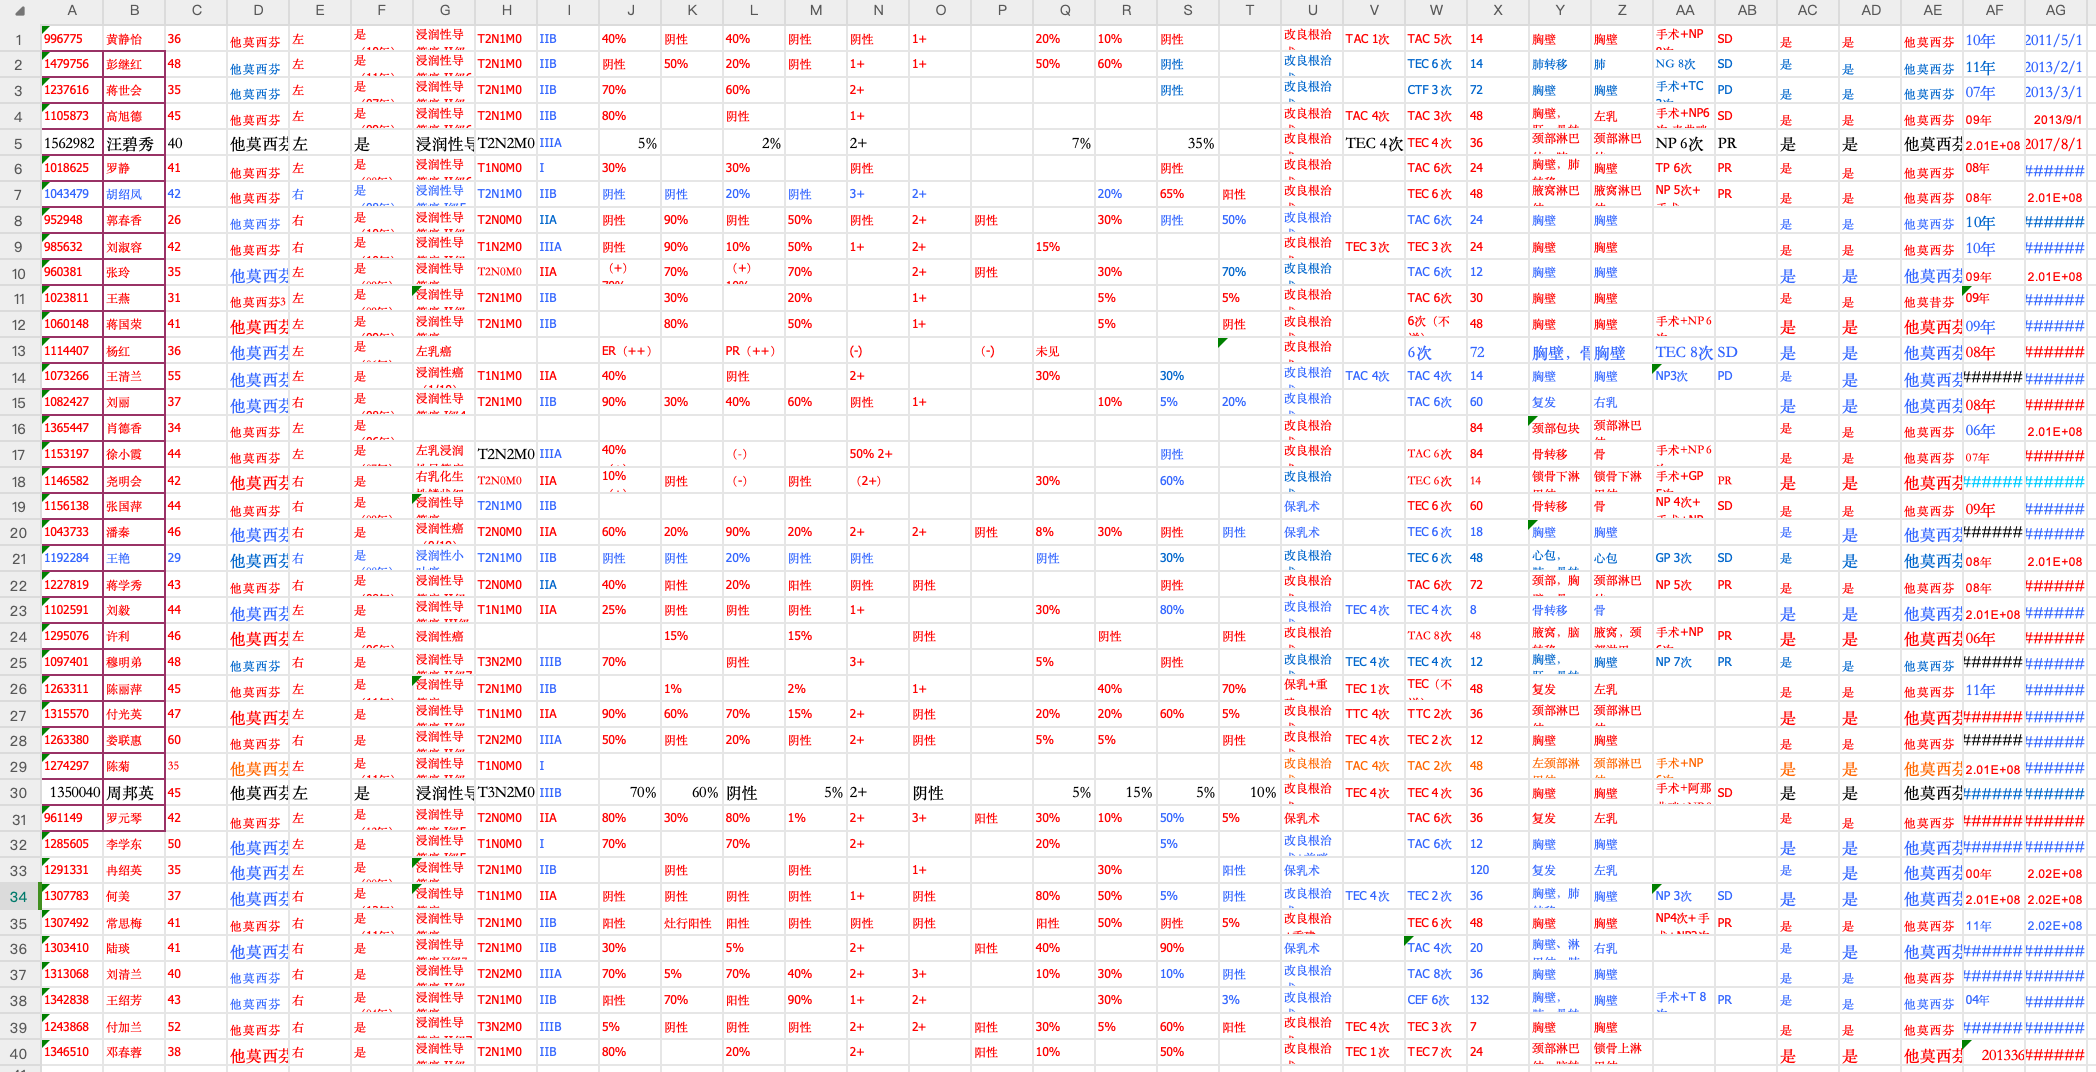
Archived paraffin-embedded samples of breast cancer were obtained from the Clinical Diagnostic Pathology Center, Chongqing Medical University (Chongqing, China). All samples were from patients who had undergone surgery at the 1st Affiliated Hospital of Chongqing Medical University from 2000 to 2017 and were diagnosed in the same center. The validation cohort tissue microarray (TMA) included 40 cases of tissues from recurrence sites and the paranoncancerous tissues. The detailed clinical information of each individual specimen was pathologically confirmed. The experiments were approved by the Ethics Committee of the First Affiliated Hospital of Chongqing Medical University (supplementary material 1)
Real-time quantitative polymerase chain reaction (RT-qPCR)
Total RNA was extracted from cells using an RNA extraction kit from FOREGENE (Chengdu, China) according to the manufacturer's protocol. Subsequently, cDNA synthesis was performed using a reverse transcription kit from China Baosheng Biotechnology Co., Ltd. Gene expression levels were assessed via RT-qPCR, using β-actin as the reference gene. Primer sequences were purchased from Tsingke Biotechnology Co., Ltd, with the sequences detailed as follows:
CST1 Forward: CCGGGTGGCATCTATAACG,
Reverse: GTGGCCTTGTTATACTCGCT;
β-actin Forward: CCTTCCTGGGCATGGAGTC,
Reverse: TGATCTTCATTGTGCTGGGTG.
Western Blot Analysis
For protein analysis, cellular proteins were extracted using a standardized protocol and analyzed by Western blot. The primary antibodies used were: CST1 (Catalog #16025-1-AP, Proteintech), LC3B (Catalog #A5202, bimake), P62 (Catalog #18420-1-AP, Proteintech), RAB1B (Catalog #17824-1-AP, Proteintech), and Ki67 (Catalog #27309-1-AP, Proteintech), each diluted in 1:1000.
Molecular docking
Molecular docking of CST1 and RAB1B structures, obtained from (NCBI) Protein Database (https://www.ncbi.nlm.nih.gov/protein/) and Protein Data Bank (PDB)(https://www.rcsb.org/), respectively. Rigid docking was performed using the ClusPro online server (https://cluspro.bu.edu/), followed by flexible docking utilizing RosettaDock. The overall interaction binding energy of the two proteins and the binding energy between key amino acids through Rosetta's Interface Analyzer and Interface energy. PyMOL was employed for visualizing the docking results.We finally found residue GLU4_R(145), ALA196_R(337),GLY197_R(338) for CST1(Uniprot ID:P01037) and ARG28_C(28),SER6_C(6) for RAB1B (Uniprot ID:Q9H0U4 ) with higher affinity using around the active site.
Table 1 Key residues of interactions in CST1—RAB1B.
|
CST1
|
RAB1B
|
SCORE
|
|
GLU4_R(145)
|
SER6_C(6)
|
0.198747
|
|
GLU4_R(145)
|
ARG28_C(28)
|
0
|
|
ALA196_R(337)
|
SER6_C(6)
|
0
|
|
ALA196_R(337)
|
ARG28_C(28)
|
-1.60013
|
|
GLY197_R(338)
|
SER6_C(6)
|
0
|
|
GLY197_R(338)
|
ARG28_C(28)
|
-0.40372
|

CO-Immunoprecipitation(CO-IP)and iTRAQ-based quantitative proteomics analysis
co-immunoprecipitation (Co-IP) were performed according to the manufacturer’s direction in Tsingke (TsingKe, Beijing, China)(supplementary material 2). Protemics analyzed in Shanghai Applied Protein Technology (P20200902710,Shanghai, China)
immunohistochemical (IHC)
For immunofluorescence (IF) staining, MCF-7R and T47DR cells were seeded onto laser confocal dishes and incubated overnight. The cells were fixed, permeabilized, and blocked. Primary antibodies (CST1, RAB1B) were applied at a dilution 1:200 and incubated with the cells overnight at 4°C. Alexa Fluor 488 or 594-conjugated secondary antibodies (Abbkine Biotechnology, Wuhan, China, Catalog #A23220, A23410) were then administered for 1 hour at room temperature, followed by nuclear staining with DAPI (Biyuntian Biotechnology, Shanghai, China, Catalog #C1005).
immunofluorescence (IF)
For immunohistochemistry (IHC) staining, paraffin-embedded BC tissue samples underwent deparaffinization and rehydration processes. Subsequently, endogenous peroxidase activity was blocked using 3% H2O2, followed by antigen retrieval with citrate buffer. The samples were incubated overnight at 4°C with primary antibodies (CST1, LC3B) diluted 1:100, exposed to HRP-conjugated secondary antibody, and stained with a DAB substrate kit following the manufacturer's protocol. Microscope images were analyzed using ImageJ to obtain AOD scores, reflecting the intensity of target protein expression.
Tamoxifen drug sensitivity testing
For TAM drug sensitivity experiments, we initiated the process by concurrently treating cells with drugs (3-MA and rapamycin) and employing lentivirus and plasmid transfection. The successfully engineered cells were then exposed to TAM (Solarbio, Beijing, China) at specified concentrations and incubated for 48 hours. Subsequently, changes in drug sensitivity were assessed using the CCK-8 assay kit (Dojindo, Japan).
Cell colony formation and invasion assay
1×10^3 cells were plated into six-well plates. After a standard two-week incubation, cells were fixed with 4% paraformaldehyde (Wuhan Boster Biological Technology Co., Ltd.) for 15 minutes at room temperature and then stained for 5 minutes with 0.5% crystal violet (Wuhan Boster Biological Technology Co., Ltd.). The formula for calculating the colony formation efficiency is: (number of colonies / number of initially seeded cells) × 100%.
3×10⁵ cells are placed on the upper layer of a cell culture insert with permeable membrane (or coated with matrix gel) and a solution containing the test agent is placed below the cell permeable membrane. Following an incubation period (3–18 hours), the cells that have migrated through the membrane are stained with 0.5% crystal violet and counted(magnification, ×100; model TE2000-U; Nikon Corporation).
Animal experiment
Mice were kept under sterile conditions and receiving sterile nutrition and water (Animal Experimental Center of Chongqing Medical University, Chongqing, China). And randomly assigned to experimental groups at n = 5 per group. MCF-7R cells stably transfected with shNC, shCST1, and shCST1+RAB1B were implanted into the mammary fat pads of female BALB/c nude mice (5×10^6 cells in 100 μl PBS/Matrigel, 1:1) and pretreated with 1 μM 17β-estradiol in their drinking water. Tumor size was measured using a caliper according to the following formula: volume = (width)2 * length/2. Mice received TAM treatment (20 mg/kg, orally) every 3 days. An endpoint of 2.0-3.0 cm3 was adopted for tumor size. All experimental procedures were approved by the Ethics Committee of the First Affiliated Hospital of Chongqing Medical University (2022-k209,supplementary material 3).
Statistical analyses
Student's t-test and analysis of variance (ANOVA) were utilized to assess the statistical significance of differences among groups. GraphPad Prism 10.0 software, with p-values below 0.05 considered statistically significant. Data are presented as mean±standard deviation (SD) from three independent experiments to ensure the reliability of results. P < 0.05 was considered statistically significant (* p < 0.05, ** p < 0.01, and *** p < 0.001).