Mite collection and RNA extraction
P. cuniculi were harvested from an infested New Zealand White rabbit maintained at the Department of Parasitology, Sichuan Agricultural University (Sichuan, China). About 300 mites, a pool of larvae, nymphs and adults, were collected and processed for the total RNA extraction.
Expression and Purification of two recombinant serpin proteins
Total RNA was converted into cDNA using the PrimeScript RT reagent Kit with gDNA Eraser (TaKaRa, Dalian, China). The two serpin genes were amplified from cDNA using the following primers: 5’-CGGGATCCGCTCATGTTGGTCAACATC-3’ (forward) and 5’ CCAAGCTTTTAAAAATCATGAATTTCACC-3’ (reverse) for Pso c 27 with underlined restriction enzymes of BamHI and HindIII, and 5’- CGGGATCCTGAATGCGAATTCATTGCTG-3’ (forward) and 5’-CCCTCGAG TCAAAATCCATGCATTTCACC-3’ (reverse) for PsoSP2 with underlined restriction enzymes of BamHI and XhoI. The cDNA fragments were sub-cloned into pET32a (+) (Invitrogen, Beijing, China). The recombinant proteins were expressed in E. coli BL21 (DE3) and purified as the previous method described by Gu et al. [2]. The eluted fractions were concentrated by Amicon Ultra Centrifugal Filter Devices (Millipore, Billerica, MA, USA). Two purified serpin proteins were detected by 12% SDS-PAGE..
Sequence analysis
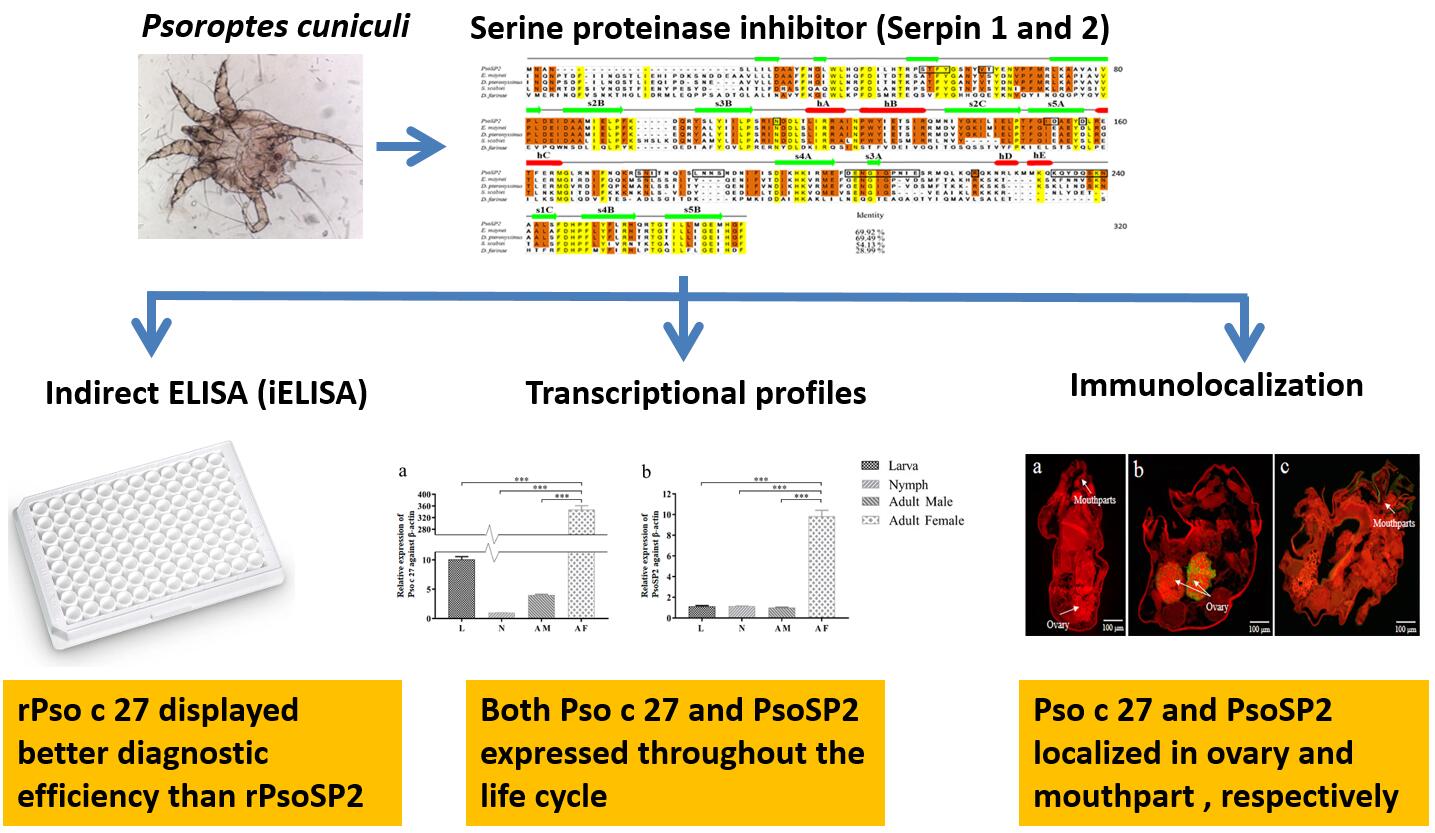
DNAMAN version 7.0 was applied to compare the similarity between paralogous genes, and SignalP 5.0 (http://www.cbs.dtu.dk/Services/SignalP/) was used to predict signal peptides. Transmembrane regions were analyzed using the Transmembrane Prediction Server (http://www.cbs.dtu.dk/services/TMHMM-2.0). B-cell epitopes were predicted by BaCelLo (http://gpcr.biocomp.unibo.it/bacello/pred.htm). The serine protease inhibition domains were analyzed by Inter-ProScan EMBL-EBI Software (http://pfam.xfam.org/). Amino acid sequences were aligned using MEGA5.0. Secondary structure predictions were performed by JPred 4.0 (http://www.compbio.dundee.ac.uk/jpred/). The neighbor-joining (NJ) tree, including values of 1000 replications resampled tests, was constructed by MEGA 5·0 software [13].
Rabbit sera
Fifty P. cuniculi-positive rabbit sera were collected from a farm located in Chengdu, Sichuan, China. All rabbits were confirmed P. cuniculi-positive by observation of ear scab and skin scrapings by microscopy [14]. Twenty-five negative sera from P. cuniculi-free rabbits were obtained from a farm without a history of psoroptic mange. For cross-reaction testing, another 30 sera included Sarcoptes scabiei-positive sera, Eimeria spp.-positive sera, and Cysticercus pisiformis-positive sera (ten/group) were provided by the Department of Parasitology, Sichuan Agricultural University.
Preparation of polyclonal antibodies and Western blotting
Polyclonal antibodies were obtained by experimentally immunization with purified rPso c 27 and rPsoSP2, respectively. The produces were raised following slightly modified procedures described by Gu et al. [2]. Briefly, rabbits were immunized with about 1 mg purified recombinant protein four times by subcutaneous injection. Sera were collected via the marginal ear vein before immunization and 7 days after the fourth infection, and then purified by HiTrap Protein A affinity chromatography (Bio-scale TM Mini UNOsphere SUPrA TM Cartridge) to obtain the IgG of anti-rPso c 27 and anti-rPsoSP2.
Two purified recombinant proteins were separated by 12% SDS-PAGE and transferred to the nitrocellulose membranes using Trans-Blot SD Semi-Dry Transfer Cell (Bio-Rad). The membranes were blocked using 5% skim milk powder for 2 h. After three times of 5-min washes with TBST (0.02 M Tris-HCl, pH7.6, 0.15 M NaCl, 0.05% Tween-20), membranes were incubated with rabbit anti-P. cuniculi antibody or anti-rPso c 27 IgG or anti-rPsoSP2 IgG (1:150 v/v) overnight at 4°C. Non-infested rabbit serum was used as a negative control. After washing three times with TBST, membranes were incubated with horseradish peroxidase (HRP)-conjugated goat anti-rabbit antibody (1:1000 dilution; Boster Bio-project Co. Dalian, China) for 1 h at room temperature. Following three washes with TBST, the signal was detected using an Enhanced HRP-DAB Chromogenic Substrate Kit (Tiangen, Beijing, China).
Immunolocalisation of two serpin proteins in adult female P. cuniculi
The immunolocalisation of two serpin proteins were performed as previously described [15]. Briefly, adult female mites were collected and sliced into 5 μm histological section, then were treated with 0.01 M citrate buffer and incubated with purified rabbit anti-rPso c 27 IgG or anti-rPsoSP2 IgG or pre-immune IgG (1:200 v/v). After three times washing with PBS, sections were incubated with fluorescein isothiocyanate-conjugated goat anti-rabbit IgG (1:200 v/v) and finally visualized by a fluorescent microscope (BX53, Olympus, Japan).
Transcriptional profiles of serpin at different life stages of P. cuniculi
The total RNA was extracted from larvae, nymph, and adult (male/female) mites using a MiniBest universal RNA extraction kit (TaKaRa), resptectively. Relative gene expression was evaluated by two-step qRT-PCR with the following primers: Pso c 27, 5’-TGGCAGCAGTGGATCAGAATCATC-3’ (forward) and 5’-AATGCAACAGCAACACTGTATGGC-3’ (reverse); PsoSP2, 5’-TCCTACATACACGTCCATCAACA-3’ (forward) and 5’-TGGTACAATAGCGACGGCTG-3’ (reverse). The β-actin gene was used as a housekeeping control to correct the relative fluorescence signal of the target genes using primers 5’-TGAATTGCCTGATGGTCAAG-3 (forward) and 5’-TGGCGAACAAGTCTTTACGG-3 (reverse). Gene transcription was assessed according to the manufacturers’ recommendations of the real-time PCR System (LightCycler® 96 System, Roche, Switzerland) and the SYBR Premix Ex Taq II Kit (TaKaRa, Dalin, China). Each sample was performed in triplicate. An equal volume of ddH2O replaced the template cDNA as blank control. Thermal cycling was performed as follows: 95 °C for 30 s, 95 °C for 5 s, 58 °C for 30 s, then followed by 40 cycles at 95 °C for 0 s, 59 °C for 15 s, and 95 °C for 0 s. Melting curves were plotted, and relative expression levels of the target genes were calculated by the 2-DDCt method.
Establishment of an Indirect ELISA (iELISA)
The establishment of iELISA was performed as described by Crowther [16]. The concentrations of antigen and primary serum samples were determined by the checkerboard titration tests. Briefly, the purified proteins were diluted two-fold in 0.1 M carbonate buffer (pH 9.6) to the different concentrations and coated in 96-well plates with 100 μL/well overnight at 4 °C. The dishes were washed three times with PBS containing Tween-20 (PBST, pH 7.4) (5 min per wash), then incubated with 5 % (w/v) skim milk powder at 37 °C for 90 min, then with100 μL of two-fold gradient dilution of P. cuniculi-positive and negative serum samples (ranging from 1:20 to 1:320) were added and incubated at 37 °C for 1 h. The plates were washed 3 times and incubated 1 h at 37 °C with 100 μL HRP-labeled goat anti-rabbit IgG (1: 3000 dilution with 0.01 M PBS) (Boster Bio-project Co., Wuhan, China). After 4 times washing, 100 μL of TMB chromogenic solution (TIANGEN, Beijing, China) was added at 37 °C for 20 min, then the reaction was stopped with 100 μL / well of 2 M H2SO4. Optical densities (OD) were read at 450 nm by a microplate reader (Thermo Scientific, Pittsburgh, PA, USA). The optimal working conditions were determined with the highest P/N (positive/negative serum) value. The cut-off value of iELISA was determined as the mean OD450 value plus three standard deviations (SD) using 25 negative serum samples from naïve rabbits [2].
To further evaluate the feasibility of the iELISA, 50 P. cuniculi-positive serum samples were assessed by the iELISA, and the sensitivity was calculated as (ELISA positive × 100) / true P.cuniculi-positive [2]. Thirty serum samples from rabbit infected with S. scabiei, Eimeria spp and C. pisiformis (10 samples for each species) were used to evaluate the cross-activity of the iELISA. Twenty-five negative serum samples from naïve rabbits and 30 serum samples in the cross-activity assay were used to determine the specificity of the iELISA, which was calculated as (ELISA negative × 100) / real P. cuniculi-negative [2]. After that, the area under the receiver operating characteristic curve (AUC), a graph of the sensitivity (true positive rate) versus 1-specificity (false positive rate), was calculated by MedCalc 19.0.7 [17].
The repeatability (intra-assay variability) and reproducibility (inter-assay variability) of the iELISA were evaluated using three P. cuniculi-positive serum samples, substantially as previously described [18].
The experimental infestation of rabbits with P. cuniculi and serological testing using the established iELISA
Rabbits infected with P. cuniculi were performed strictly as previously described [2]. Briefly, ten 3-month-old naive New Zealand rabbits (5 females and 5 males) were infested with P. cuniculi, and three non-infested rabbits were applied as controls. Serum samples from 13 rabbits were collected at weeks 0, 1, 2, 3, and 4. Afterward, in a total of 65 serum samples (50 from the P. cuniculi infestation rabbits and 15 from the non-infestation rabbits) were examined by the establishment optimal iELISA method. Each serum sample in triplicate was analyzed in one ELISA plate, and positive and negative controls were contained in the dishes.
Statistical analysis
All data are represented as mean ± standard deviation (SD), and statistical differences between groups were evaluated using Mann-Whitney U tests in SPSS software v.17.0. P-values < 0.05 were considered as statistically significant.