2.1 Patients
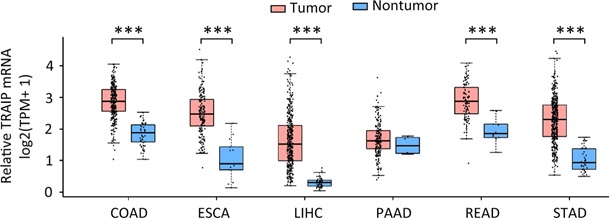
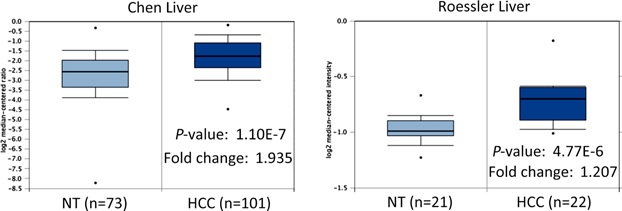
Clinical samples including 53 pairs of fresh tissues and 384 paraffin-embedded tissues were collected in Sun Yat-sen University Cancer Center (SYSUCC), Guangzhou, China. Prospective collection of clinicopathological data of the 384 patients with HC were obtained. All patients in this study provided written informed consents and received no chemotherapy or radiotherapy before surgical resection. This study was approved by the SYSUCC Institute Research Ethics Committee. Gene Expression Omnibus (GEO), Oncomine, The Cancer Genome Atlas (TCGA) databases were used to confirmed the upregulation of TRAIP in HCC.
2.2 Cell culture and transfection
The HCC cell lines (LM3, MHCC97L, MHCC97H, PLC8024, HepG2, Huh7, Hep3B) were purchased from the Cell Resource Center, Chinese Academy of Science Committee (Shanghai, China), and cultured by Dulbecco’s modified Eagle’s medium (DMEM) (Gibco, Gaithersburg, MD, USA) supplemented with 10% heat-inactivated fetal bovine serum (FBS, Hyclone, Logan, UT). HepG2 and Huh7 cells were transfected with overexpression vector encoding full-length human TRAIP cDNA or TRAIP shRNAs, using Lipofectamine 2000 (Invitrogen). pcDNA 3.2(+) vector and scramble shRNA were used as negative controls. Cells were then selected by 500 mg/L G418 for 14 days to construct stable cell lines. The targeted sequences for TRAIP shRNAs and EZH2 siRNA were as followings: TRAIP shRNA #1, 5’-UUACACCUCAGGCUGGUCCCG-3’; TRAIP shRNA #2, 5’-CCCAGCATGGTTACTACGAAA-3’; EZH2 siRNA, 5′-AGUCUCAUGUACGCTGACUCUG-3′.
2.3 Quantitative real-time polymerase chain reaction (qRT-PCR)
The mRNA expression level of TRAIP was determined by qRT-PCR, using a SYBR Green real-time assay. Total RNAs were extracted from cells using the Trizol reagent (Invitrogen, CA, USA) according to the manufacturer’s instruction. One microgram of RNA sample was reverse transcribed using the Superscript III enzyme (Invitrogen, CA, USA) to obtain single-stranded cDNA. Real-time PCR was then performed on cDNA in an iQ Sybr Green Supermix (Bio-Rad) with gene-specific primers. The following primers were used: TRAIP, forward: 5'-TGCTGTCTCAAACCACTGAA-3' and reverse: 5'-CACTATCTGCTCCGACTTCTTC-3'; β-actin, forward: 5′-TGGCACCCAGCACAATGAA-3′ and reverse: 5′-CTAAGTCATAGTCCGCCTAGAAGCA-3′.
2.4 Western blot
Expression of TRAIP, Rb, p21, EZH2, p53 and SPAG5 was determined by western blot, using the protocol as in our previous study [18]. The primary antibodies were listed as followings. TRAIP (1:500, #ab80170, Abcam), SPAG5 (1:500, Sigma-Aldrich), EZH2 (1:1000, #5246, Cell Signaling Technology), p21 (1:1000, #2947, Cell Signaling Technology), p53 (1:1000, #2524, Cell Signaling Technology), Rb (1:1000, #9309, Cell Signaling Technology), β-actin (1:1000, #4970, Cell Signaling Technology).
2.5 Immunohistochemistry (IHC)
IHC was used to examine the expression of TRAIP in HCC tissues. Paraffin embedded sections were dewaxed in xylene (3 × 5 min) and dehydrated in ethanol series (3 min in 100% ethanol, 1 min in each of 95% and 70% ethanol). Sections were washed in PBS and endogenous peroxidases were blocked with 3% H2O2 for 10 min. The tissue sections were subjected to antigen retrieval by pressured cooking in 10 mM citrate buffer for 3 min, and then incubated with serum blocking solution for 20 min to block nonspecific binding, followed by incubation with primary antibodies for 2 h at room temperature. After rinsing in PBS for 10 min, the sections were incubated with the biotinylated secondary antibody for 1 h and further incubation with the Streptavidin Biotin complex. Reactivity was developed in chromogen DAB (3,3-diaminobenzidine) solution. The signal was enhanced by applying the solution of CuSO4 and NaCl for 5 min. Finally, the sections were counterstained with Mayer’s hematoxylin, dehydrated, and mounted. All sections were observed under light microscopy and the staining intensities were assessed by two independent pathologists (Yang YF and Cao Y). Nucleus staining was graded for intensity (0-negative, 1-weak, 2-moderate, and 3-strong) and percentage of positive cells [0, 1 (1–24%), 2 (25–49%), 3 (50–74%), and 4 (75–100%)] with discrepancies resolved by consensus. The H-scores for tumors with multiple cores were averaged. The median IHC score was used to define high FMNL1 expression and low FMNL1 expression groups.
2.6 Colony formation
Stable cells with TRAIP overexpression or knockdown were culture in 6-well plates at a density of 1.0 × 10³ per well by medium plus G418 for 10 days. Colonies were fixed with methanol, stained with 0.1% crystal violet, pictured, and counted under a microscope.
2.7 5-Ethynyl-2’-deoxyuridine (EdU) staining
The effect of TRAIP on HepG2 and Huh7 cell proliferation was assessed by EdU staining, using the KeyFluor488 Click-iT EdU Imaging Kit (KeyGEN BioTECH, Nanjing, China).
2.8 Coimmunoprecipitation (co-IP)
Proteins were extracted by radioimmunoprecipitation assay buffer supplemented with proteinase inhibitor cocktail. Primary antibodies were added for 2.5 h. Protein A/G beads were added for an additional 2 h. Precipitated proteins were dissolved in SDS loading buffer and fractionated by SDS-PAGE.
2.9 Statistics
Difference of TRAIP expression in HCC and nontumorous tissues was revealed by Student’s t-test. Data are mean and SEM from three independent in vitro experiments. Significance between groups was calculated by the Student’s t-test. Survival analyses were conducted by KaplanMeier analyses (log-rank test). Differences were considered significant for P-values less than 0.05.