Cell culture
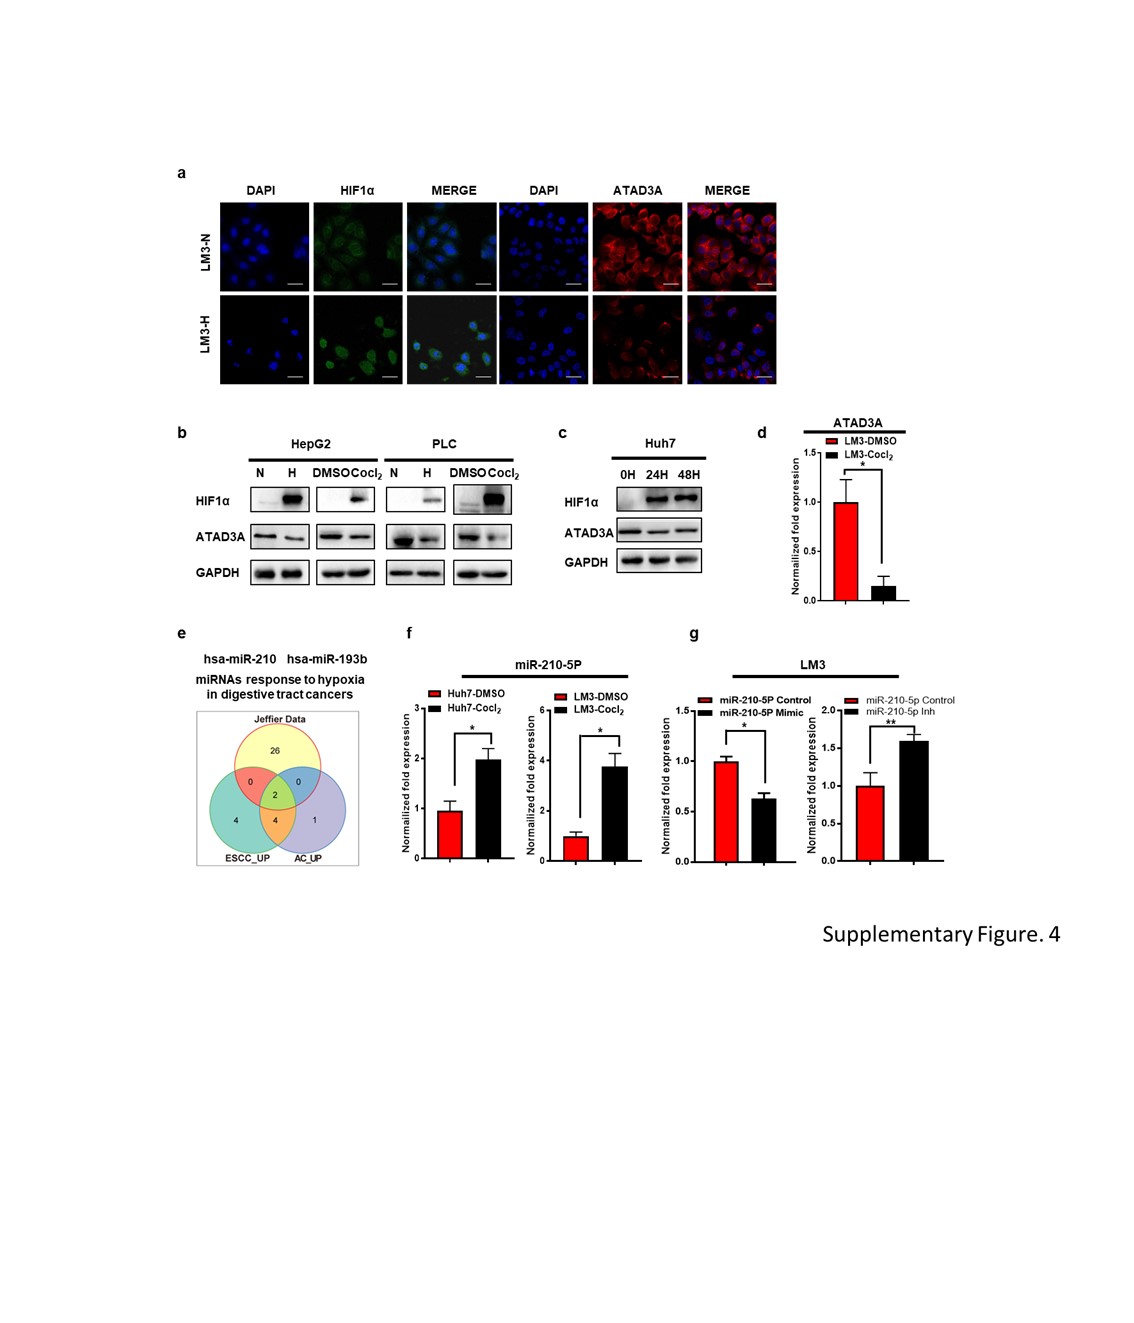
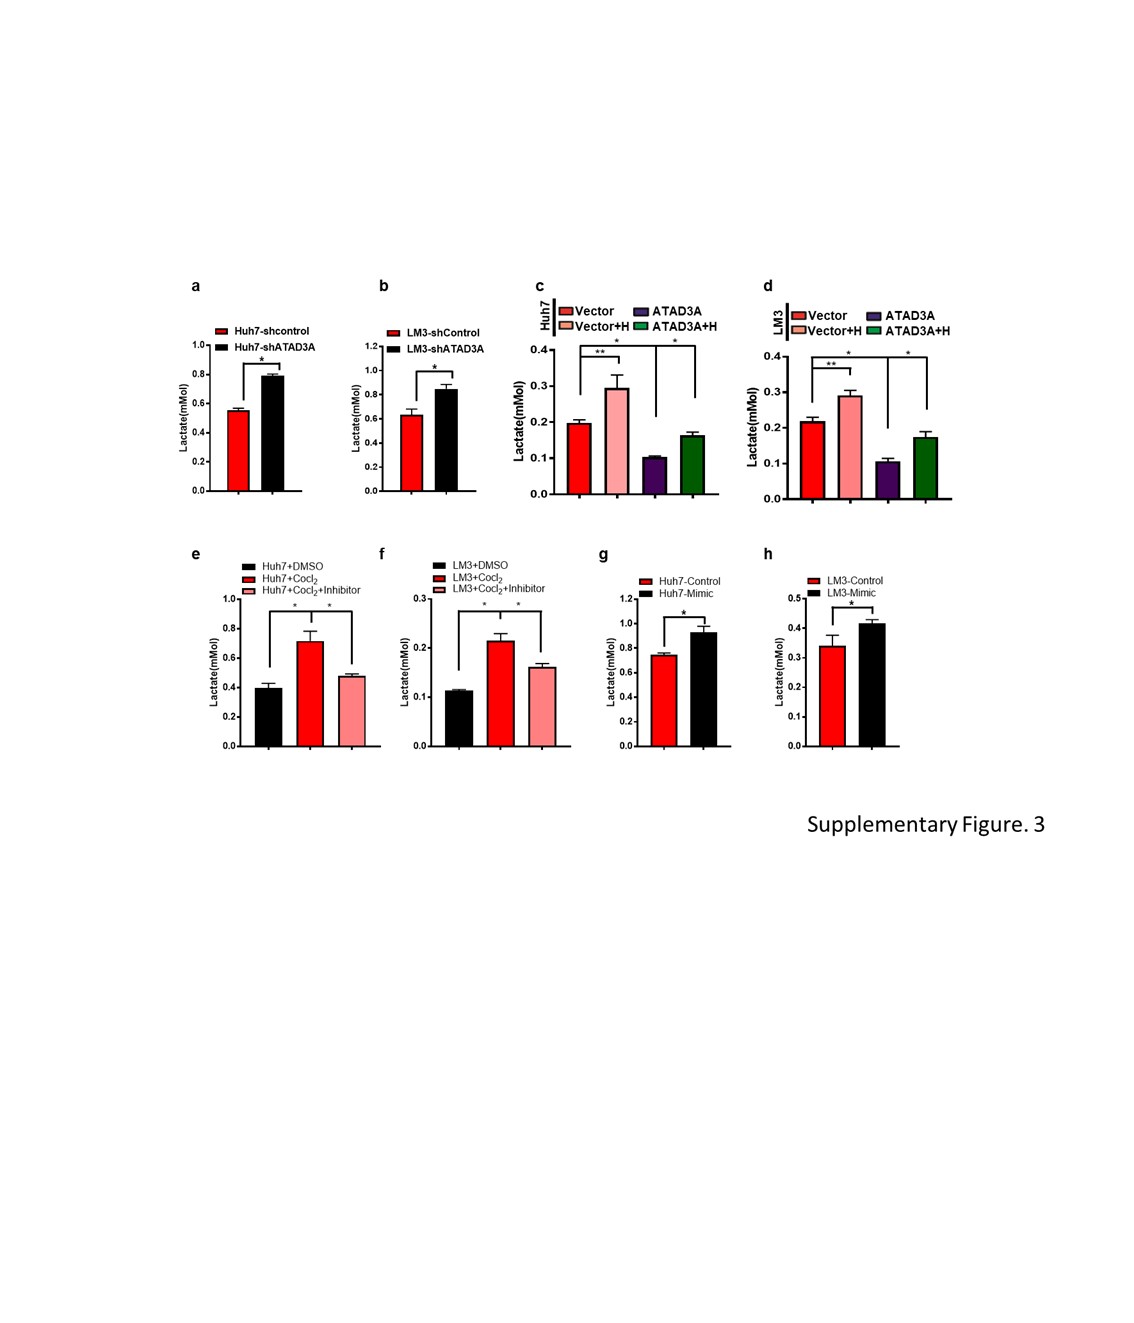
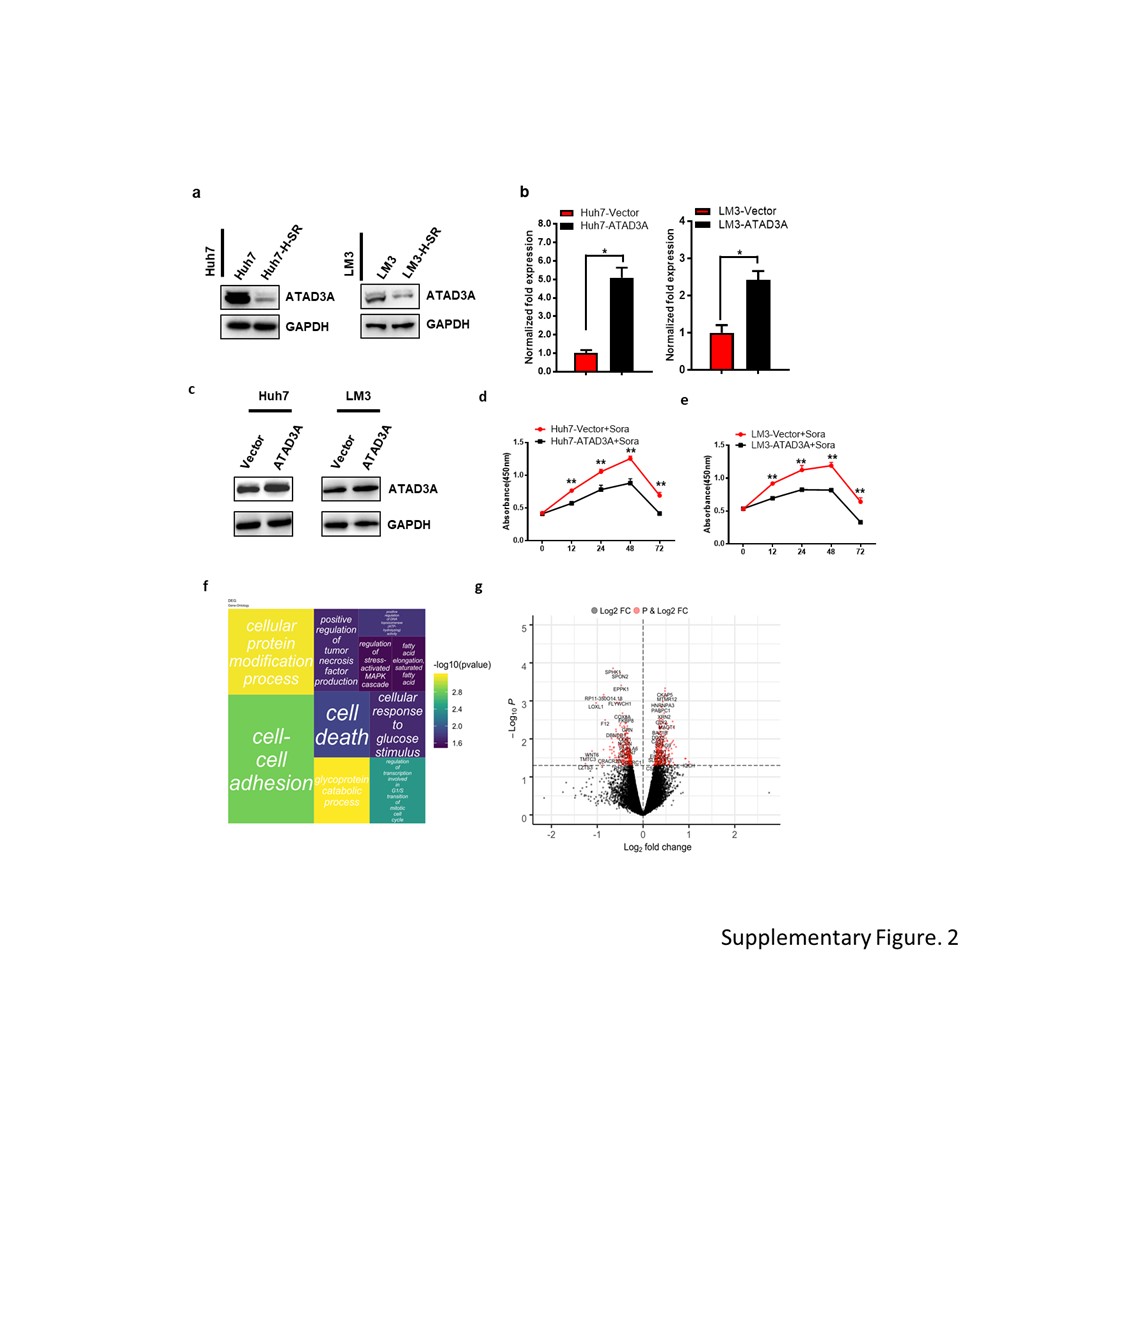
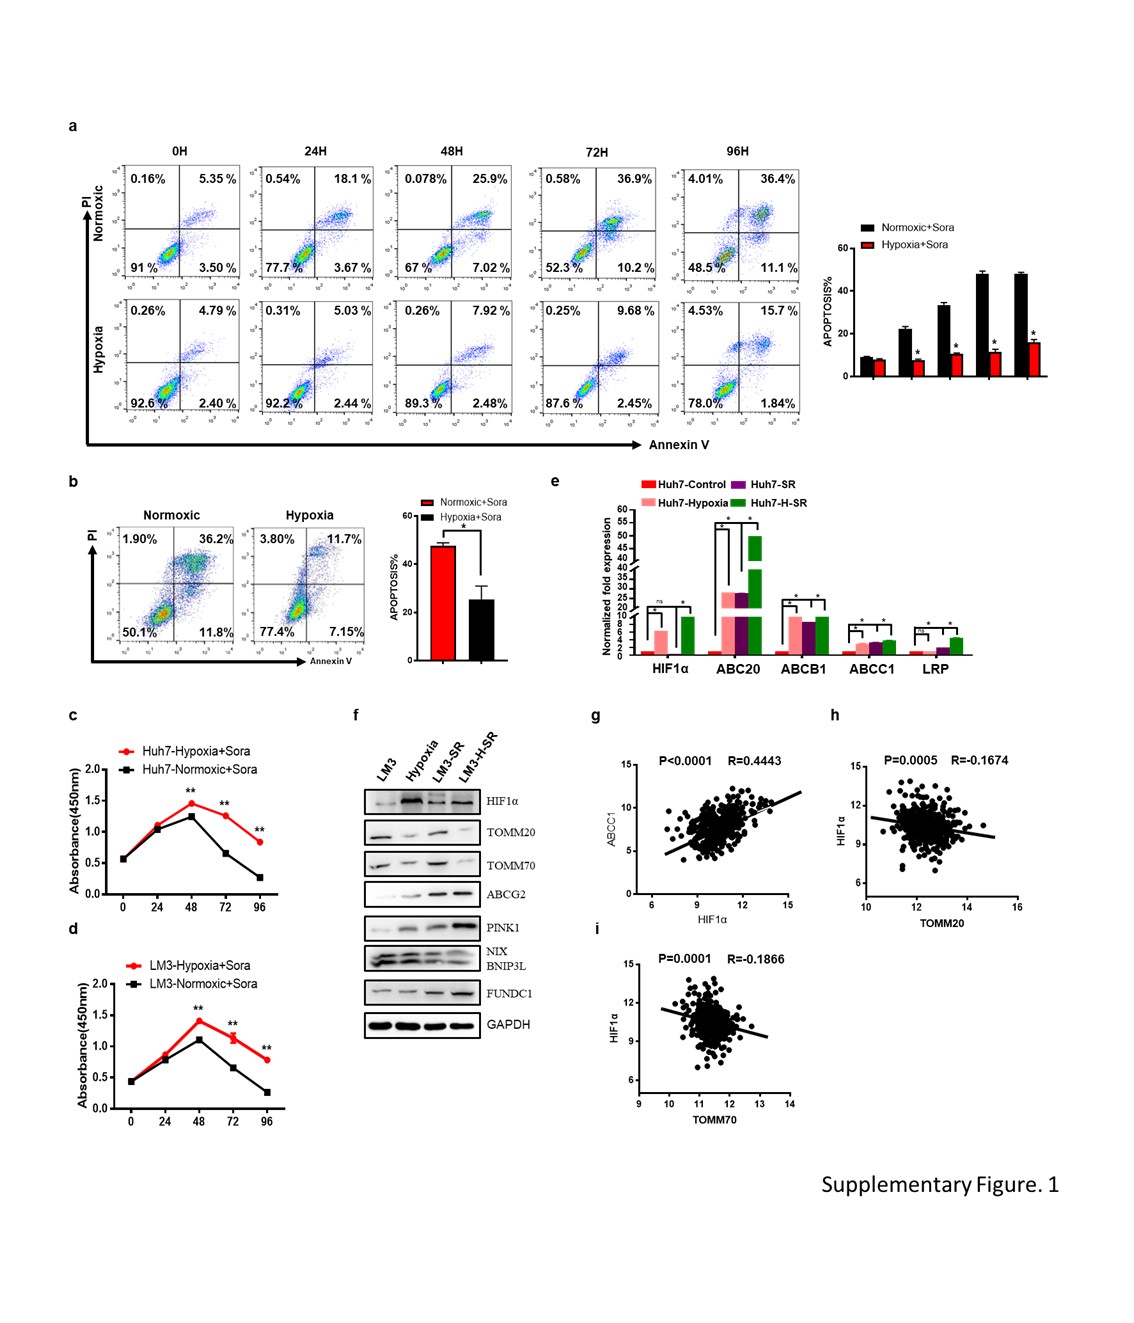
Human hepatoma cell lines Huh7, LM3, HepG2 and PLC were obtained from the American Type Culture Collection (ATCC) and authenticated by the Cell Bank of Type Culture Collection of Chinese Academy of Science. The cells were maintained under recommended conditions. For hypoxia treatment, the cells were either cultured in a sealed hypoxia chamber (Thermo fisher, Inc.) containing 1% O2, 5% CO2 and 94% N2, or treated with 100 mM CoCl2 for 24 or 48 hours. Sorafenib-resistant Huh7 (Huh7-SR) and LM3 (LM3-SR) cells were enriched by steadily increasing the drug dose, while hypoxia-induced sorafenib resistant cell lines (Huh7-H-SR and LM3-H-SR) were established by culturing under 1% O2 with increasing drug doses.
Patients and tissue microarray
Paired HCC and adjacent (at least 5 cm from the tumor) normal tissues were collected from 6 HCC patients at the First Affiliated Hospital of Third Military Medical University between 2011 and 2013. HCC tissue microarrays were purchased from Shanghai Biochip Company Ltd. (Shanghai, China), of which 145 cases with survival information and 85 with paired normal tissues were used for immunohistochemistry.
Virus production
The pLVX-CMV-EGFP-3FLAG-PGK-Puro lentiviral vector expressing full-length human ATAD3A was purchased from SunBio (Shanghai. China). The pMAGic2.1-CMV-HygroR-U6 shRNA lentivirus vector purchased from SunBio (Shanghai. China), and the shRNA sequences are shown in Table 1. Human HEK293T cells (American Type Culture Collection) were cultured in 6-well plates till ~ 70% confluent, and co-transfected with 2 µg overexpression or knockdown virus vector, 1 µg pMD2.G and 1 µg psPAX2 lentivirus packaging vectors using Lipofectamine 2000 (Invitrogen) according to the manufacturer’s protocol. The cells were maintained in high-glucose DMEM containing10% FBS, 2 mM glutamine, and100 units/ml penicillin and streptomycin. The supernatants with virus were harvested twice at 48 h and 72 h, filtered through a 0.45 µm syringe filter and frozen in liquid nitrogen.
Target cell transduction
HCC cells were cultured in complete DMEM, and 1.5*105 cells were mixed with 450 µl virus-containing supernatant in the presence of 4 µg/ml polybrene (Sigma). The cells were seeded into a 6-well plate, and the medium was changed 12 h post-infection. After 48 h, the infected cells were trypsinized and seeded into 10 cm culture dish with 4 µg/ml puromycin (Thermo Fisher Scientific). The stably transduced cells were selected over 48 h, and harvested 6 days post-infection to determine knockdown efficiency.
Western blotting
Total protein was extracted from cancer cells using Mammalian Protein Extraction Buffer (P0013, Beyotime, Beijing, China) supplemented with protease inhibitor cocktail (87786, ThermoFisher, USA). The mitochondrial fractions were separated using Mitochondria Isolation Kit (number: SM0020, Solarbio, Beijing, China) according to the manufacturer’s protocol, and the protein was extracted as above. Equal amounts of protein lysates were separated by SDS-PAGE gel and electro-transferred to PVDF membrane (Millipore, USA). After blocking in 5% milk-PBST for 2 hours at 37 °C, the membranes were incubated overnight with primary antibodies (Table 2) at 4 °C and with secondary antibodies at 37 °C for 2 hours. The positive bands were visualized with Immobilon Western Chemiluminescent HRP Substrate detection reagent (Millipore, USA), and acquired using a ChemiDoc™ imaging System (Bio-Rad, USA).
Quantitative real-time PCR
Total RNA was extracted from cancer cells using Trizol Reagent (Invitrogen, USA), and qRT-PCR was performed using SYBR PrimeScript RT-PCR kit (TaKaRa, Japan) on a Rotor-Gene 6000 real-time genetic analyzer (Corbett Life Science, USA). The primer sequences and the product sizes are listed in Table 3. Glyceraldehyde-3-phosphate dehydrogenase (GAPDH) was used as the internal control. The PCR conditions were as follows: denaturation at 95 °C for 2 min, followed by 40 cycles of amplification and quantification (95 °C for 5 s, 55 °C–57 °C for 30 seconds), and melting curve (55 °C–95 °C, with 0.5 °C increment each cycle). Each sample was tested in triplicates.
Apoptosis assay
The suitably treated cells were washed twice with cold PBS, resuspended in binding buffer at the density of 1 × 10⁶ cells/ml, and distributed into 500 µl aliquots (1 × 10⁵) in 2 ml tubes. Each sample was incubated with 5 µl Annexin V-FITC and 5 µl propidium iodide for 15 min at room temperature (25 °C) in the dark, and subsequently analyzed by flow cytometry.
Immunofluorescence assay
HCC cells were washed, fixed with 5% paraformaldehyde (PFA) and permeabilized in 0.1% Triton X-100. After incubating overnight with monoclonal mouse anti-HIF-1α antibody (cell signaling technology) or monoclonal rabbit anti-ATAD3A antibody (Invitrogen, PA5-03671) at 4℃, the cells were probed with fluorescein isothiocyanate (FITC)-labeled anti-mouse IgG or Cy3-labeled anti-rabbit IgG secondary antibodies (Santa Cruz Biotechnology, Santa Cruz, USA). The nuclei were counterstained with Hochest 33258 and observed under laser confocal scanning microscopy (Leica TCS-SP5, Germany).
Luciferase reporter assay
The 3′-UTR region of human ATAD3A was amplified by PCR from genomic DNA and cloned downstream to the firefly luciferase coding region in the pMIR-REPORTTM plasmid. The 293 T cells were seeded in 96-well plates, and co-transfected 24h later with 100ng/ml reporter plasmid and 50nM miR-210-5P or NC mimics using Lipofectamine 2000. Luciferase activity were measured after 72h using the Dual-Glo Luciferase Assay System (Promega, Madison, WI, USA). All experiments were performed in triplicates.
Oncogenic assays
Cells were seeded in 96-well plates at the density of 5000 cells/well and cultured for 24 hours. After treating with different doses of sorafenib for varying durations, the cells were incubated for 2 hours with 0.5 mg/ml 3-(4, 5-dimethyl-thiazol-2-yl)-2,5-diphenyl-tetrazolium bromide (MTT) (Sigma) in serum free medium. For foci formation assay, 5x10² cells were seeded in 6-well plates with 5.13µM (huh7) or 7.92µM (LM3) sorafenib as appropriate, and cultured for 2 weeks. The ensuing colonies were stained by crystal violet and counted. The experiment was performed thrice.
Mitophagy assay
LC3 mobility shift was assessed by analyzing expression levels of LC3 I/II, TOMM20 and TOMM70 by Western blotting. Subcellular localization of mitophagy bodies was tracked by transmission-electron-microscopy (Hitachi Japan). Finally, mitochondrial content was analyzed by Mito-Tracker staining and FACS analysis.
Lactate measurement
The suitably treated cells were seeded in 6-well plates in triplicate at the density of 5*104 cells/well. After culturing for 2 days, the number of viable cells was counted, and the culture medium was collected. Lactate levels were detected in the latter using a specific analytical kit (Nanjing Jian cheng Bioengineering Institute, China), and normalized to cell number and calculated as relative units per cell.
Immunohistochemistry (IHC)
IHC was performed on tissue array slides as previously described. The tissues were probed with rabbit anti-human ATAD3A (Invitrogen, PA5-03671 1:200) and rabbit anti-human HIF-1α (abcam, ab51608, 1:200) antibodies, and counterstained with hematoxylin (Sigma). The staining intensity (negative = 0, weak = 1, moderate = 2, or strong = 3) and the percentage of positively stained cells (<25% = 1, 25 to 50% = 2, >50% to <75% = 3, ≥75% = 4) were scored independently by two pathologists. The staining index was calculated by multiplying the intensity score with percentage score, and the samples were classified as negative/low expression (0-2) or positive/high expression (3-12) accordingly.
RNA sequencing and bioinformatic data analysis
LM3-shControl and LM3-shATAD3A cells were generated as before and total RNA was extracted. RNA libraries were constructed using a TruSeq Stranded mRNA LT Sample Prep Kit (Illumina, San Diego, CA, USA) according to the manufacturer’s instructions, and sequenced on an Illumina platform (HiSeqTM 2500 or Illumina HiSeq X Ten) into 125bp/150bp paired-end reads by OE Biotech (Shanghai, China). The differentially expressed genes (DEGs) were identified using Cuff-diff with q value <0.05 and fold change >2 as the criteria. Gene set enrichment analysis was performed using software.broadinstitute.org/gsea. Heatmaps were generated with the heatmap package of R program.
Tumorigenicity analysis in vivo
Female BALB/c (nu/nu) athymic nude mice, 5 weeks of age, were purchased from hfkbio Inc. Mice were maintained in specific pathogen-free conditions: 20–24°C, 12/12h of dark/light cycle, 60±5% of humidity, and plastic cage (3–4 mice/cage). Bedding materials were changed every week, and environmental enrichment was done with sterile materials. All animal experiments were approved by the Institutional Animal Care and Use Committee of the Medicine University of Electronic Science and Technology of China’s. Control and miR-210-5P antagomir-transfected Huh7-shControl and Huh7-shATAD3A cells were inoculated subcutaneously (n=5 each, 2×10⁶ cells per mouse) in the right flank of 4-6 weeks old BALB/c athymic female nude mice. Once the tumors grew to approximately 100mm3 (around 5 days), the mice were intraperitoneally injected with sorafenib tosylate (10mg/kg) daily for a week, and monitored every 4 days for the appearance of subcutaneous tumors. We conducted the sacrifice of mice at 28 days, we placed the mice in the chamber and introduced 100% carbon dioxide. After we removed each tumor, we maintained the carbon dioxide flow for a minimum of 1min after respiration ceases. The tumor weight and tumor volume (TV; mm3) were calculated. Tumor volume was calculated as d2×D/2 (d and D represent the shortest and the longest diameters respectively). All animal experiments were performed in accordance with the guidelines of the ARRIVE reporting guidelines.
Statistical analysis
Statistical analyses were performed using GraphPad Prism 6.0 (GraphPad, La Jolla, CA, USA). Two tailed unpaired t-test or one-way ANOVA were used to compare two or multiple groups. Survival curves were plotted using the Kaplan–Meier method and compared by the log-rank test. All data was presented as mean ± SD or mean ± SEM. P<0.05 was considered statistically significant.