Materials
Yttrium chloride hexahydrate (YCl3·6H2O, 99.9%), gadolinium chloride hexahydrate (GdCl3·6H2O, 99.9%), ytterbium chloride hexahydrate (YbCl3·6H2O, 99.9%), erbium chloride hexahydrate (ErCl3·6H2O, 99.9%), oleic acid (OA, 95%), 1-(3-dimethylaminopropyl)-3-ethylcarbodiimide hydrochloride (EDC), ammonium fluoride (NH4F), 1-octadecene (ODE, 90%), N-hydroxysuccinimide (NHS), cetyltrimethylammonium chloride solution (CTAC), 3-aminopropyltrimethoxysilane (APTES, 98%), and 4,6-diamidino-2-phenylindole dihydrochloride (DAPI) were purchased from Sigma-Aldrich (Sydney, Australia). 2-(N-Morpholino) ethanesulfonic acid (MES, 99.0%) were obtained from Sinopharm Chemical Reagent Co., Ltd, Shanghai, China. Tetraethyl orthosilicate (TEOS) sodium chloride (NaCl), triethanolamine (TEA), methanol, and sodium hydroxide (NaOH) were purchased from Lingfeng Chemical Reagent Company (Shanghai, China). Anti-EpCAM monoclonal antibody was supplied by eBioscience (Austria). MX was procured from Toronto Research Chemicals Inc (Canada). Cell counting kit-8 (CCK-8) was purchased from Dojindo (Tokyo, Japan). All reagents were used as received unless otherwise stated.
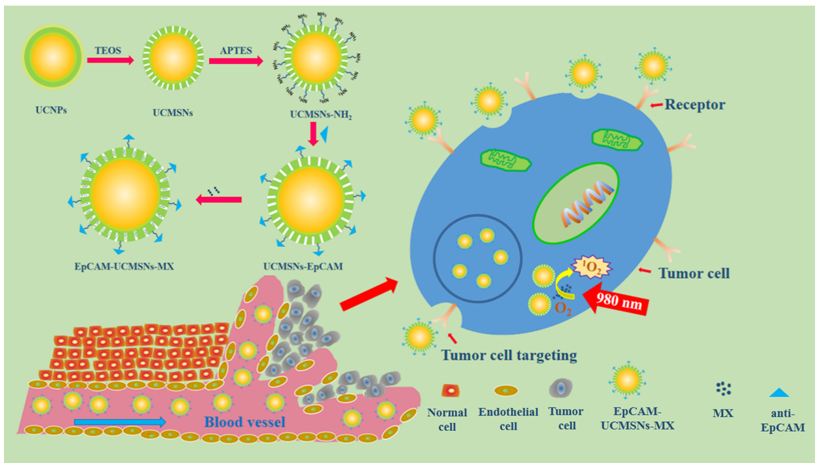
Synthesis of UCNPs
NaYF4:Yb,Er and NaYF4:Yb,Er@NaGdF4 nanoparticles (UCNPs) was synthesized using a typical thermal decomposition as described in our previous study[27].
Synthesis of UCNPs@mSiO 2 nanoparticles (UCMSNs) and UCMSNs-EpCAM
Cyclohexane solution of OA-UCNPs (50 mM, 2.5 mL) was added into 10 mL diluted hydrochloric acid (pH 4.0) and then stirred for 2 h. The products were under centrifugation, rinsed thrice with deionized water, and finally dispersed in 20 mL deionized water. TEA (0.01 g) and CTAC (0.5 g) were added and vigorously stirred for 2 h. A total of 10 mL ligand-free UCNPs solution was then added slowly, and the mixture was sonicated for 1 h. A total of 200 µL TEOS was added dropwise into the system and stirred vigorously at 80°C for 1 h. The obtained UCNPs@mSiO2 nanoparticles (denoted as UCMSNs) were precipitated, washed thrice with ethanol, and extracted with 30 mL methanol solution of NaCl (1 wt %) at 25°C for 3 h to clear off the excess CTAC. After several cycles of extraction, UCMSNs were dispersed in deionized water for further use.
Anti-EpCAM monoclonal antibody was conjugated onto the surface of UCMSNs via an EDC/NHS coupling chemistry. Briefly, 50 µg anti-EpCAM monoclonal antibody in 10 mL MES buffer (pH: 6.0, 0.1 M) was reacted with equimolar ratio of EDC and NHS at 25°C for 15 min. Following incubation, UCMSNs-NH2 nanoparticles dispersed in 100 mL phosphate-buffered saline (PBS, pH 8.5) were added to the above mixture and the system was performed for 2 h at 25°C. The resulting UCMSNs-EpCAM nanoparticles were centrifuged thrice with PBS to remove the unbound antibody and the final product was dispersed in 0.5 mL deionized water for use in subsequent experiments.
Characterization instruments
The morphologies of the above nanoparticles were studied using JEOL JEM-1200EX transmission electron microscope (TEM, Japan), while the size distribution study was performed using Image J software. Hydrodynamic diameters of UCMSNs and UCMSNs-EpCAM were measured with a Zeta-Plus analyzer (Brookhaven Instruments Co., Holtsville, USA). The concentrations of Y3+ element in the samples were estimated by an inductively coupled plasma mass spectrometry (ICP-MS, Jiangsu Skyray Instrument Co., China). The infrared spectra were acquired by a Fourier transform infrared (FTIR) spectrometer (Nicolet Co., USA). The concentration of MX was measured with ultraviolet-visible (UV-vis) spectrophotometry at a detection wavelength of 410 nm. Confocal laser scanning microscopic experiments were performed with Olympus FV1000 laser-scanning microscopy (Nikon, Japan) equipped with a continuous-wave NIR laser (λ = 980 nm) as the excitation source.
T1-weighted MR properties of UCMSNs
Magnetic resonance properties of UCMSNs were evaluated with a 7.0 T MR scanner (Pharma Scan, Brukers, Germany). T1 relaxation times depend on a multi-echo spin-echo sequence (16 echoes; repetition time [TR] = 2,500 ms; echo time [TE] = 22–352 ms). T1-weighted MR images of seven samples with gradient concentrations of Gd3+ (0, 4.33, 8.67, 17.35, 34.68, 69.30, and 138.56 µmol/mL) were acquired, and T1 values were analyzed by measuring the signal intensity in 0.5 cm2 region of interest. The relaxivity coefficient (r1) was acquired as the gradient of the plot of R1 (R1 = 1/T1) versus the molarity of magnetic atoms.
In vitro drug release of MX-UCMSNs
For in vitro studies, a total of 10 mL methanol solution containing 5 mg MX and 10 mg UCMSNs was stirred for 24 h at 25°C under dark condition. MX-UCMSNs product were gathered by centrifugation and freeze-dried under vacuum. The initial system and the supernatant were examined with a UV-vis spectrophotometry at 660 nm wavelength to analyze the concentration of MX in the above samples. The loading efficiency of MX in UCMSNs was measured using the formula: (Mi - Mr)/Mi × 100%; where, Mi: initial mass of MX and Mr: residual mass of MX after loading. To assess the drug-releasing characteristics of MX-UCMSNs, 5 mg pre-dried MX-UCMSNs were encapsulated into a dialysis bag (with 3,500 molecular weight cut-off) and placed in 20 mL PBS. Dialysis was performed in a table concentrator with a speed of 200 rpm at 25°C. At designated time-points, 3 mL solution was sampled as to examine the released MX mass and poured back in the initial dialysis medium. The total dialysis time was approximately 48 h.
In vitro toxicity assessment of UCMSNs/UCMSNs-EpCAM
Human PC cell line BxPc-3 were planted in a 96-well plate (2000 / well) overnight. The cells were incubated with UCMSNs/UCMSNs-EpCAM at different concentrations (3, 7.5, 15, 30, 60, 120, 250, 500, and 1000 µg/mL) in Dulbecco’s modified Eagle’s medium (DMEM) for 24/48 h. The cells were rinsed thrice with sterile PBS and co-incubated with 100 µL DMEM including 10 µL CCK-8 solution for 4 h. The absorbance values were measured at 450 nm. Cell survival percentage was the ratio of the absorbance of CCK-8 in the treated cells to that in the controls.
NIR-induced ROS generation in vitro
The intracellular ROS generation was determined with an oxidation sensitive fluorescent probe 1,3-diphenylisobenzofuran (DPBF)[28]. Briefly, 3000 BxPc-3 cells were cultured into a 96-well plate overnight, then were rinsed with sterile PBS and incubated with DMEM containing EpCAM-UCMSNs-MX/UCMSNs-MX (300 µg/mL) for 4 h. After incubation, the medium was removed and the cells were incubated with 100 µL DPBF for 1 h, then the cells were rinsed with PBS three times and illuminated with 980 nm light (320 mW/cm2) for 10 min. The production of ROS was fluorometrically determined by examining the amount of DPBF and comparing it with the predetermined DPBF standard curve.
Cellular uptake study and targeting efficiency of UCMSNs/UCMSNs-EpCAM
BxPc-3 cells were cultured in confocal laser scanning microscopy (CLSM) special cell culture dish under a humidified 5% CO2 atmosphere at 37°C. After reaching about 80% confluence, the cells were rinsed thrice with PBS. Following washing, the cells were treated with DMEM solution containing UCMSNs (200 µg/mL) and UCMSNs-EpCAM (200 µg/mL), respectively. After 4 h co-incubation, cells were gently rinsed with PBS three times and DAPI (1:1000) were used to stain the cell nuclei for 15 min. The excitation wavelength used was 980 nm.
In vivo toxicology study of UCMSNs/UCMSNs-EpCAM
Healthy female athymic nude mice (weight: 20 g, 5 weeks old) were purchased from the Model Animal Research Center of Nanjing University and raised at Laboratory Animal Center of Southeast University. All animal experimental procedures were approved by the Institutional Animal Care Committee at Southeast University. Mice were randomly divided into three groups as follows (six mice per cohort): two groups were administrated with a single dose of UCMSNs/UCMSNs-EpCAM in physiological saline (30 mg/mL, 150 µL) intravenously via tail vein. The third group was administrated with only 150 µL physiological saline and used as the control. Before blood collection, mice were anesthetized after 7 and 30 days of treatment and blood samples (approximately 500 µL) were acquired through cardiac puncture for biochemistry assays. All mice were euthanized and the major organs (heart, liver, spleen, lung, and kidney) were excised and fixed in a 10% formalin solution, followed by hematoxylin and eosin (H&E) staining.
Synergetic effect of chemo-/PDT in vitro
A total of 105 BxPc-3 cells were planted in a six-well plate and incubated overnight. After 80% confluence, the cells were rinsed with sterile PBS three times, then divided into eight groups and treated as follows: (1) PBS (50 µL), (2) PBS plus NIR irradiation, (3) MX, (4) MX and NIR irradiation, (5) UCMSNs-MX solution, (6) EpCAM-UCMSNs-MX solution, (7) UCMSNs-MX solution and 980 nm laser excitation, (8) EpCAM-UCMSNs-MX solution and 980 nm laser excitation. Briefly, 1 mL DMEM with MX/UCMSNs-MX/EpCAM-UCMSNs-MX ([MX] = 0.5 µg/mL) was added into the wells, and the cells were irradiated with 980 nm laser (320 mW/cm2) for 5 min and then cultured for another 24 h. Cell viability was evaluated as described in Section ‘In vitro toxicity assessment of UCMSNs/UCMSNs-EpCAM’.
In vivo UCL imaging
To establish BxPc-3 tumor-bearing mice model, 2 × 10⁶ cells were subcutaneously inoculated into right front flank of female balb/c nude mice. When the average volume of tumor reached approximately 80 mm3, 10 mice were divided into two groups (five per group) randomly, two groups were then administrated intravenously with 150 µL of either UCMSNs (non-targeted group) or EpCAM-UCMSNs (targeted group) at a concentration of 20 mg/mL via tail vein. In vivo UCL images were recorded based on in vivo optical imaging system (Maestro EX, Cri, USA) at different time intervals (pre-injection and 1, 4, 8, 24, and 48 h post-injection). As an external source, a 0–10 W adjustable 980 nm laser was enrolled with a beam size of 30 mm, larger than the size of the tumor. Fluorescence intensities were determined at different time points. Mice were euthanized at 48 h after treatment and the mean fluorescence intensities (MFI) of tumors and major organs were calculated.
In vivo MR imaging
BxPc-3 tumor-bearing mice model was established as described above. When the average volume of tumors was approximately 80 mm3, MR scans were conducted using a 7.0 T Micro-MR imaging instrument (PharmaScan, Brukers, Germany). MR images were recorded at different time intervals such as at pre-injection and 1, 4, 8, 24, and 48 h post-injection (150 µL, 20 mg/mL). MR signal intensities were analyzed at each time point.
In vivo therapeutic effect of chemo-/PDT
BxPc-3 tumor-bearing mice with a uniform tumor size were grouped for in vivo treatment therapies. When the tumors reached an average diameter of 5–6 mm, ninety mice were divided into six groups. Group 1 only received 150 µL physiological saline alone intravenously via tail vein; group 2 received 150 µL physiological saline and NIR irradiation; group 3 received only 150 µL physiological saline containing UCMSNs-MX (12 mg/mL); group 4 was injected with 150 µL physiological saline containing EpCAM-UCMSNs-MX (12 mg/mL); group 5 received UCMSNs-MX intravenously and NIR irradiation; group 6 was injected with EpCAM-UCMSNs-MX (12 mg/mL, 150 µL) followed by NIR irradiation. For all NIR irradiation groups, a continuous-wave fiber-coupled 980 nm laser (320 mW/cm2, 30 min, 5 min interval after every 5 min of irradiation) was applied at the tumor sites 8 h post-injection. All mice were administrated with two injections one week. Tumor volumes were measured with a digital caliper and calculated according to the formula V = (width2 × length)/2, and the weights of the mice were recorded every other day for 31 days. To further evaluate the treatment efficacy, the tumors and major organs were collected for H&E staining. The representative photos of tumors were recorded, respectively. Seven mice from each group were used for analyzing survival time.
Biodistribution and targeting efficiency
As mentioned above, BxPc-3 tumor-bearing mice were administrated with EpCAM-UCMSNs/UCMSNs (15 mg/mL, 150 µL, 5 mice per group) via tail vein, and euthanized at 12, 24, and 48 h post-injection. The contents of Y3+ in the tumor and major organs were measured based on ICP-MS. In addition, the targeting efficiency was evaluated as follows: targeting efficiency (%) = (total content of Y3+ in the sample/total content Y3+ in the injected nanoparticles) × 100%.
Statistics analysis
All the obtained data were analyzed using GraphPad Prism software (version 5.0). Differences between two groups was regarded as statistically significance for *P < 0.05 and very significant for **P < 0.01 and ***P < 0.001.