Sample collection and preparation
Cancerous tissue samples from patients with colorectal cancer (N=6) confirmed by two gastroenterology pathology experts were considered as target or case tissues (assigned as cases: T20, T31, T35, T45, T65, T67). Normal controls tissues (N=6) were from individuals who underwent colonoscopy screening that were negative for either adenomatous polyps or cancer through the entire colon (assigned as controls: N4, N7, N8, N10, N14, N16). Demographic characteristics, colonoscopy reports, history of drug intake, smoking, as well as medical history were all collected. The case and control groups were matched by their demographic features. The protocol was approved by Mashhad University of Medical Sciences (Grant number: 961906). Informed written consent had been obtained from all participants in this study and have the participants permission to get published.
Nucleic Acid Isolation from Tissue
Genomic DNA was extracted from 5-25 mg of fresh tissues using QIAamp® Fast DNA Tissue Kit (Qiagen, Valencia, CA, USA) following the manufacturers instruction. The extracted DNA was evaluated by Epoch Microplate Spectrophotometer (Winooski, Vermont, USA).
Bisulfite Treatment
Two micrograms of extracted DNA undergone sodium bisulfite conversion and DNA recovery using the EpiTect Fast Bisulfite Conversion Kits (Qiagen, Germany) according to the manufacturer’s instructions. For bisulfite conversion of genomic DNA, a number of different commercial kits for bisulfite conversion are available. The kit and protocol that best suits the planned experiment was selected accordingly.
Methylation Next Generation Sequencing and Analysis
The global methylation profiles of target and normal control tissues were analyzed using the SureSelect Human Methyl-seq. This platform assesses 84 mega base (MB) of genome, 3.7 million CpGs, 19.6 Mb CpG Islands, 37 MB Gencode promoters, 48 MB enhancers, CpG island shores/shelves ±4 and DNase I hypersensitive sites. The protocol is based on biotinylated RNA probes to capture target epigenomic regions and only requires 2–3 µg of gDNA for library construction. The gDNA is randomly fragmented to mean sizes of approximately 250 bp, then fragments are ‘‘fixed,’’ creating blunt ends and adding dA in the 3’ ends so the methylated modified adapters bind to these fragments [9]. Following bisulfite treatment, sequencing was performed on the Illumina HiSeq 4000 sequencer (San Diego, USA).
The Human Methyl-seq analysis was composed of three steps in the preprocessing stage before detecting differentially methylated regions. Firstly, the total reads were assessed by Quality Control tool [10]. Secondly, the raw sequencing reads were cleaned by trim galore [11]. Thirdly, the raw bisulfite sequencing data were converted into a number of methylated reads and covered reads of cytosines (including unmethylated/methylated reads) by aligning them to the human reference genome (GRCh37/19) using the Bismark [12].
Target Identification and Primer Design
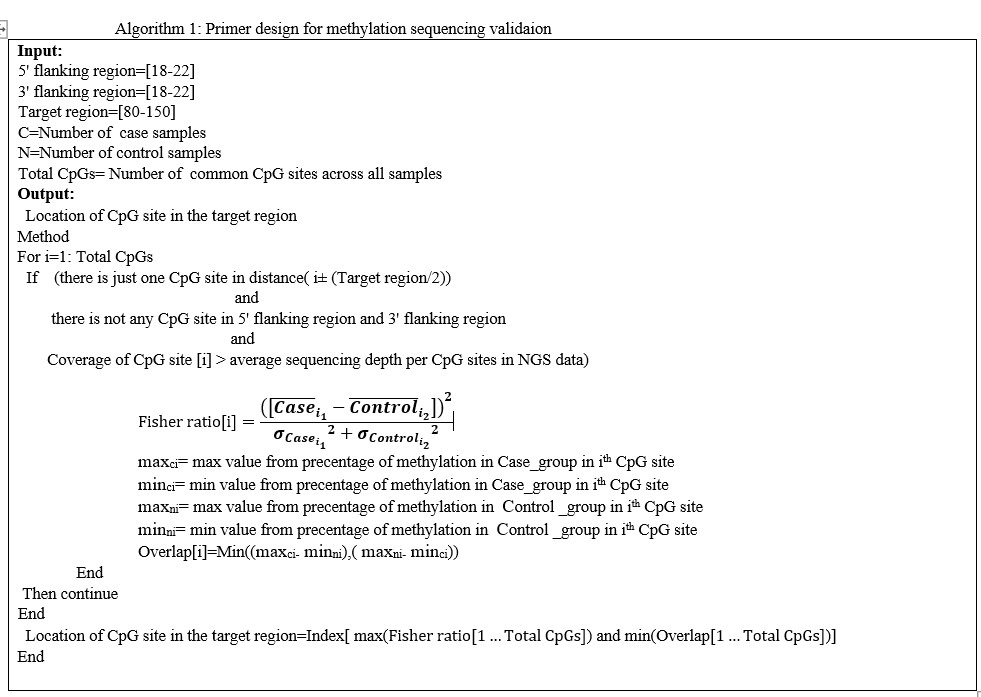
We presented a primer design for methylation sequencing validation by R programming language. Methylation independent primers were designed based on the following criteria:
1. The amplification length is between 98-170 base pairs.
2. Only one CpG site is located in this length.
3. Coverage is more than the average depth per CpG sites in data.
The framework of our method is shown in Algorithm 1.
Algorithm 1: Primer design for methylation sequencing validaion
Methylation Quantitation assay
Methylation analysis was performed by methylation sensitive high-resolution melting (MS-HRM). The MS-HRM protocol consists of PCR amplification of bisulfite-modified DNA. Two primers sets, A and B, were used to amplify bisulfite-treated DNA A-F: 5′-TGAGAGGGTTTTGTGGGTTATT-3′, A-R: 5′-TCCCCTAAACTCAAACTATCACTC-3′, and B-F: 5′-TAAGATTTAGAGGAAAATGTTTGTT-3′, B-R: 5′-ACCAAACCAAAACACTATACTACAT-3′ were designed to amplify both methylated and unmethylated bisulfite-treated DNA that did not amplify unmodified genomic DNA. Polymerase chain reaction (PCR) amplification and HRM analysis were carried out sequentially on a light Cycler® 96 System (Roche, Switzerland). PCR reactions were carried out in triplicates in a 10 µl total volume using HOT FIREPol EvaGreen Green Master Mix (Solis BioDyne, Estonia), consisting of 300 nM of each primer, 0.5 µl of bisulfite modified template. The amplification run was 15 min at 95 °C, followed by 50 cycles of 20 s 95 °C, 30s at the primer annealing temperature (55 °C) and 30s at 72 °C. HRM analyses were performed at the temperature ramping from 65 to 97 °C. Fluorescence acquisition setting was carried out at temperature recommended by the manufacturer. The melting curves and melting peak were normalized by calculation of the ‘line of best fit’ in between two normalization regions before and after the major fluorescence decrease representing the melting of the PCR product using the software version 1.1 provided with the LightCycler® 96 System.
Statistical analysis
To compare characteristics of the different groups of target and control samples, two sample t test was performed. The p value less than 0.05 was considered statistically significant.