Implementation Outcomes
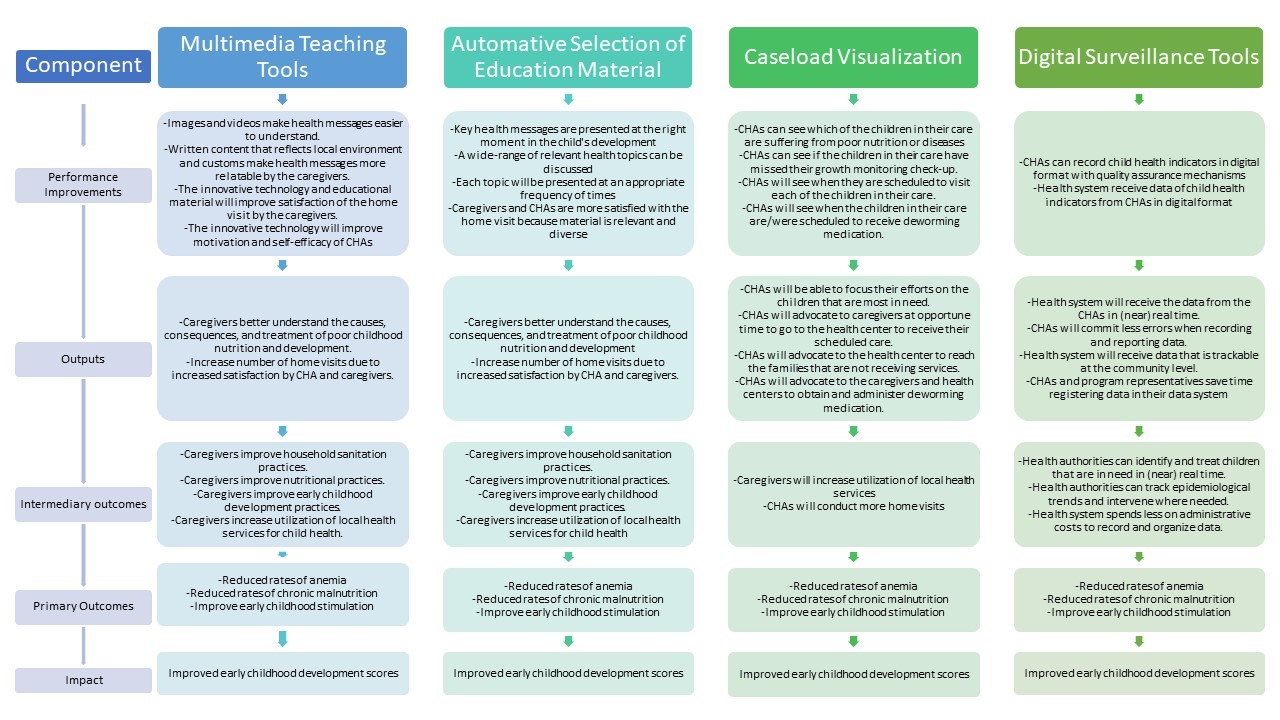
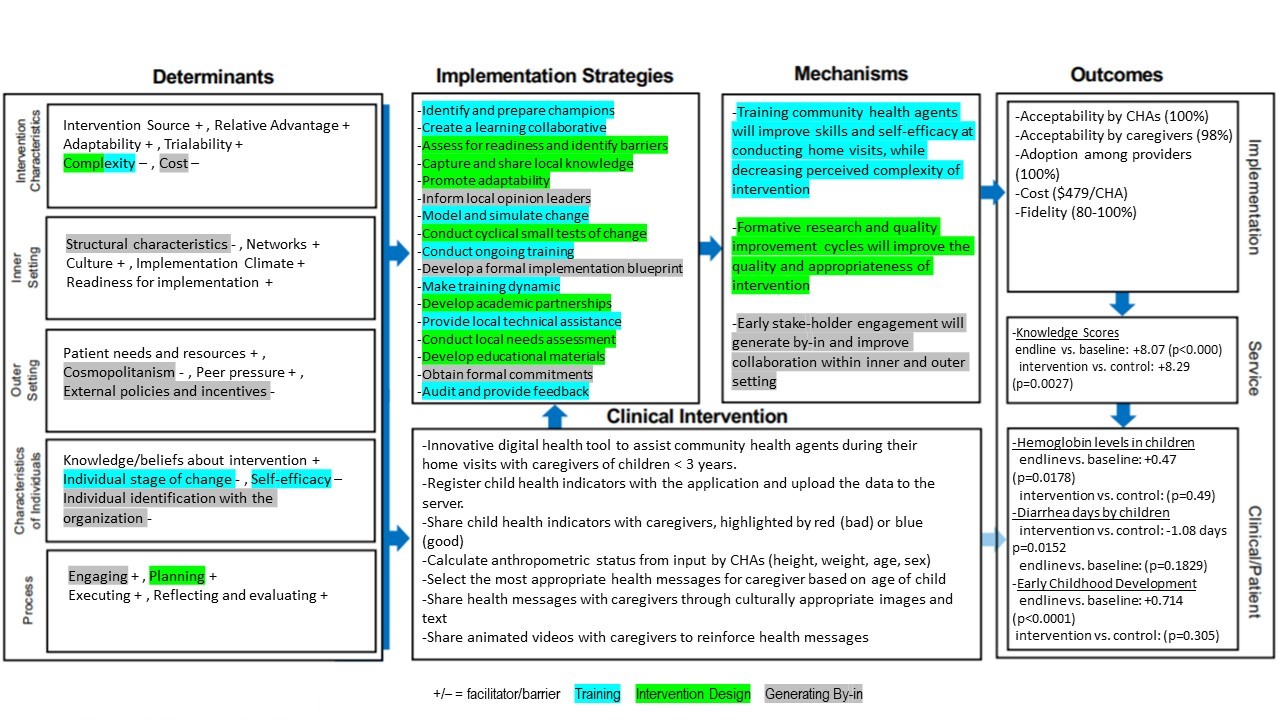
The results of the implementation research can be seen in the Implementation Research Logic Model in Appendix 2. The evaluation of the implementation outcomes included 41 caregivers and 6 CHAs in the intervention community.
Acceptability by Caregivers
Most caregivers (98%) that received home visits with the CHEST App expressed that they prefer the App than use of traditional methods (pen, paper, and flipcharts). 5% expressed that they had no preference and 3% expressed that they prefer traditional methods of home visits.
When caregivers were asked if they learned the health messages delivered during the home visits better with the CHEST App or without the CHEST App, 78% expressed that they learned better with the CHEST App, 13% expressed that they learned the same with or without it, and 3% (n=1) expressed that they learned better with traditional methods. When asked what they liked most about receiving home visits with the CHEST App, all caregivers answered that they most enjoyed the educational component of the App. Many (43%) specifically mentioned the animated videos as a reason why they prefer the CHEST App to traditional methods. For example, a mother in the community of Indiana said,
“I like that they show use the videos and how to feed the children. You learn better because you can see how to do it through the animations”.
(Me gusta que nos hacen mirar los videos y la alimentación de los niños. Se aprende mejor porque se ven como se hace para aprender mediante dibujos)
Acceptability by CHAs
All CHAs expressed that they prefer to conduct the home visits with the CHEST App than their traditional methods (pen, paper, and flipcharts). When asked what they liked about using the App, the CHWs reported that they most liked: learning from the educational material, the animated videos, and the child health indicators displayed in red or blue. The animated videos were the most cited reason that they liked the CHEST App and how it helped them better conduct their home visits. A CHA in the community of Indiana said,
“Yes, it (the App) has everything summarized and is faster. They like the videos. They laugh and understand more quickly. The child points. They like it a lot.”
(Si. Tiene todo resumido y mas rápido. Les gustan los videos. Se ríen. Aprenden más rápido y el niño apunta. Les gusta mucho)
The CHAs expressed that the most difficult part about using the CHEST App was sending the data and registering the information in the tablet.
Adoption by CHAs
The CHAs were registering the health indicators of 140 children per month with the CHEST App, the same number of children they were assigned to visit. Adoption was confirmed to be 100%, defined by being used by the CHAs during every scheduled home visit. After 18 months of use, the CHAs expressed that they continue to use the CHEST App during all their home visits. The caregivers verified adoption of the CHEST App by CHAs by reporting the number of home visits they have received and number of home visits with an electronic tablet. The results were similar (8.6 vs. 7.8), indicating that the CHAs usually use the CHEST App during their home visits. All the CHWs reported that they use all the App’s functions when conducting a home visit (share health indicators with caregiver, register health indicator, scheduling, educational images, and animated videos).
Adoption of the CHEST App was hindered due to the cancelation of the CHA programs in several communities. The instability of the local CHA programs makes adoption and sustainability of the CHEST App difficult to measure because without the infrastructure of the CHA program the CHEST App cannot be utilized.
Adoption by CHA Program Coordinators
CHA Program Coordinators were tasked to upload and utilize the data collected with the CHEST App. Adoption of this practice was not achieved. The CHA Program Coordinators were not interested in uploading the data to the server. The task was completed during the pilot study, but only to satisfy the external research team at Elementos. Therefore, the research team is not able to monitor the data from the tablet unless they visit the community and upload the data from the tablets to the server. The Program Coordinator and local municipality continue to desire a paper-based list of results of the surveillance data and did not have a printer readily available to print the data from the tablets. The CHA Program Coordinator wrote the data displayed in the tablet on paper and submitted the paper report to the municipality. Thus, reflecting low adoption and poor fidelity of the surveillance function of the CHEST App.
Cost
The intervention was implemented at a scale of 20 CHAs in 4 communities. The cost of incorporating the CHEST App into the established CHA program included the following: providing an electronic tablet to each CHA ($120), training the CHAs on how to use the tablet ($184/CHA) and the cost of a Field Supervisor to visit the CHAs for continued training. The Field Supervisor can cover a greater number of CHAs (max 40), decreasing the cost per CHA. The cost of the Field Supervisor can also decrease after the first 2-3 months as less visits and attention are needed. The incremental implementation costs are displayed in Table 1.
Fidelity
Fidelity of the CHEST App by the CHAs, as observed during home visits, remained high throughout the pilot. At 18 months, each intended activity associated the CHEST APP showed fidelity scores between 80-100%, as shown in Table 2.
Service Outcomes
Knowledge Scores
The average knowledge scores by the study population are shown in Table 3. The mean difference in knowledge scores in the intervention group and the control group at baseline is not statistically significant (p=0.136). A paired t-test on the mean difference of knowledge scores of caregivers in the intervention group at endline and those in the control group at endline displayed higher mean scores by those in the in the intervention group, a statistically significant increase of 8.29 (95% CI, 1.46 to 6.66) km, t(65)=3.12, p=0.0027. A paired t-test on the mean difference of knowledge scores in the intervention group at endline and scores at baseline displayed a statistically significant mean increase of 8.07 at endline (95% CI, 5.43 to 10.72) km, t(53)=6.12, p<0.000.
Clinical Outcomes
Anemia
The average hemoglobin levels and anemia rates are displayed in Table 4. Assessment of the two groups (intervention and control) displayed that there was no statistically significant difference in hemoglobin levels at baseline (mean difference=.14 gm/dl, p=0.46). A paired t-test on hemoglobin levels of the children in the intervention at endline and hemoglobin levels at baseline displayed a statistically significant mean increase of .47 (95% CI, 0.86 to 0.86) km, t(45)=2.46, p=0.0178. A paired t-test on hemoglobin levels of children in the intervention group at endline and hemoglobin levels of children in the control group at endling displayed no statistically significant mean difference (p=0.49).
Early Childhood Development
The average ECD z-scores for the children in the study are displayed in Table 5. The mean difference in motor and cognitive ECD scores in the intervention group and control group at baseline were not statistically significant (motor, p=0.75, cognitive, p=0.64). A paired t-test on ECD scores by children in the intervention group at endline and scores at baseline displayed a statistically significance increase at endline in cognitive scores, +1.029 (95% CI, 0.716 to 1.342) km, t(55)=6.585, p<0.000) and in motor scores, +0.714 (95% CI, 0.377 to 1.052) km, t(55)=4.24, p=0.001). A paired t-test on ECD scores by children in the intervention group at endline and scores by children in the control group at endline showed no statistically significant difference in cognitive (p=0.526) nor motor scores (p=0.305).
Diarrhea
The average number of days of diarrhea experienced by the children in the study is displayed in Table 6. The mean difference in number of days with diarrhea in the intervention group and the control group at baseline was not statistically significant (p=0.495). A paired t-test on the number of days of diarrhea by children in the intervention group at endline and the number of days by children in the control group at endline displayed a statistically significant decrease by those in the intervention group of 1.08 days, (95% CI, -1.94 to -0.21) km, t(66)=-2.49, p=0.0152. A paired t-test on the number of days of diarrhea by children in the intervention group at endline and number of days at baseline showed a decrease at endline of 0.52 days, however the mean difference was not statistically significant (p=0.1829).