Clinical characteristics of the patients involved in the study
We used data from the CGGA database that contains a large number of glioma gene expression profiles and a vast amount of clinical information data to further analyze the relationship between GNG5 expression and the clinical features of glioma. RNA sequencing data of 749 patients, including 442 males and 307 females, with complete clinical information were screened from 1018 samples based on the CGGA database. The mean age and survival range were 43.26 years and 8–79 years for males, and 3.22 years and 0-11.99 years for females, respectively. In total, we analyzed 502, 222, and 25 cases of primary, recurrent, and secondary gliomas, respectively. An analysis of the pathological results showed that there were 218, 240, and 291 cases with WHO grade II, grade III, and grade IV gliomas, respectively. In addition, 40.28% of the patients (n = 410) showed mutations in IDH, and 33.30% patients (n = 339) were wildtype for IDH. Only 15.23% of patients (n = 155) showed a 1p19q co-deletion, whereas 58.35% (n = 594) did not have this genotype. These results are summarized in Table S1.
GNG5 is highly expressed in gliomas
We analyzed GNG5 expression in different tumors and control groups using GEPIA. A total of 15,203 patient samples were included, including 9,663 samples from 33 tumors and 5,540 corresponding control samples. GNG5 expression was elevated in tumor tissues including glioblastoma (GBM), lower-grade glioma (LGG), ovarian serous cystadenocarcinoma (OV), pancreatic adenocarcinoma (PAAD), skin cutaneous melanoma (SKCM), and uterine carcinosarcoma (UCS), and showed significantly lower expression in acute myeloid leukemia (LAML) relative to the control group (Fig. 1A). These findings suggest that GNG5 is highly expressed in a variety of tumors. To further analyze the expression of GNG5 in gliomas, we analyzed the expression level of GNG5 in glioma and normal brain tissues based on transcriptome data in TCGA database and chip data in GSE131273 dataset, respectively. And the results showed that GNG5 expression was significantly higher in gliomas relative to normal brain tissue (Fig. 1B, C, P < 0.001), which was consistent with the results of RT-qPCR (Fig. 1D, P < 0.05). Furthermore, immunohistochemical data from HPA revealed that GNG5 expression in glioma was higher than that in non-glioma tissues (Fig. 1E-F).
Relationship between GNG5 and the underlying molecular and clinical characteristics in glioma patients
We analyzed the relationship between GNG5 expression level in the 749 samples from the CGGA database and the various tumor subtypes, their pathological classification, molecular classification, tumor treatment, and the age of the patients. The results indicated that the GNG5 expression level in gliomas was significantly correlated with the pathological grade and the age of the patients (Fig. 2A, C, P < 0.001). The average level of GNG5 expression in tissue from patients with recurrent gliomas was higher than in patients with primary and secondary tumors (Fig. 2B, P < 0.001). Similar results were found based on a correlation analysis between GNG5 expression level in gliomas and different pathological subtypes, such as the expression levels of GNG5 in recurrent astrocytoma, recurrent anaplastic astrocytoma and recurrent anaplastic oligodendroglioma were higher than that in corresponding primary pathological subtypes, as shown in Fig. 2G.
Reports from research conducted previously shows that patients with mutations in the IDH gene or a 1p/19q co-deletion had longer survival and better prognosis [24]. Interestingly, we found that the expression level of GNG5 in patients with mutations in the IDH gene was lower than in patients with wildtype IDH (Fig. 2D). Similarly, patients with a 1p/19q co-deletion had significantly lower expression of GNG5 than in patients without the co-deletion (Fig. 2E). Together, these results suggest that GNG5 expression may correlate with the prognosis of glioma patients. When a grouping of patients based on whether they received chemotherapy or not was performed, we found that tissue from patients who received chemotherapy showed an upregulation of GNG5 expression relative to those who did not receive chemotherapy (Fig. 2F). However, radiotherapy did not affect GNG5 expression (data was not shown). One explanation for this observation may be that the surgical resection of the tumor and subsequent sequencing data analysis are from samples collected from patients before they underwent chemotherapy. Taken together, these results indicate that a correlation exists between GNG5 expression and the molecular and clinical characteristics of glioma.
High expression of GNG5 is a predictor of poor prognosis
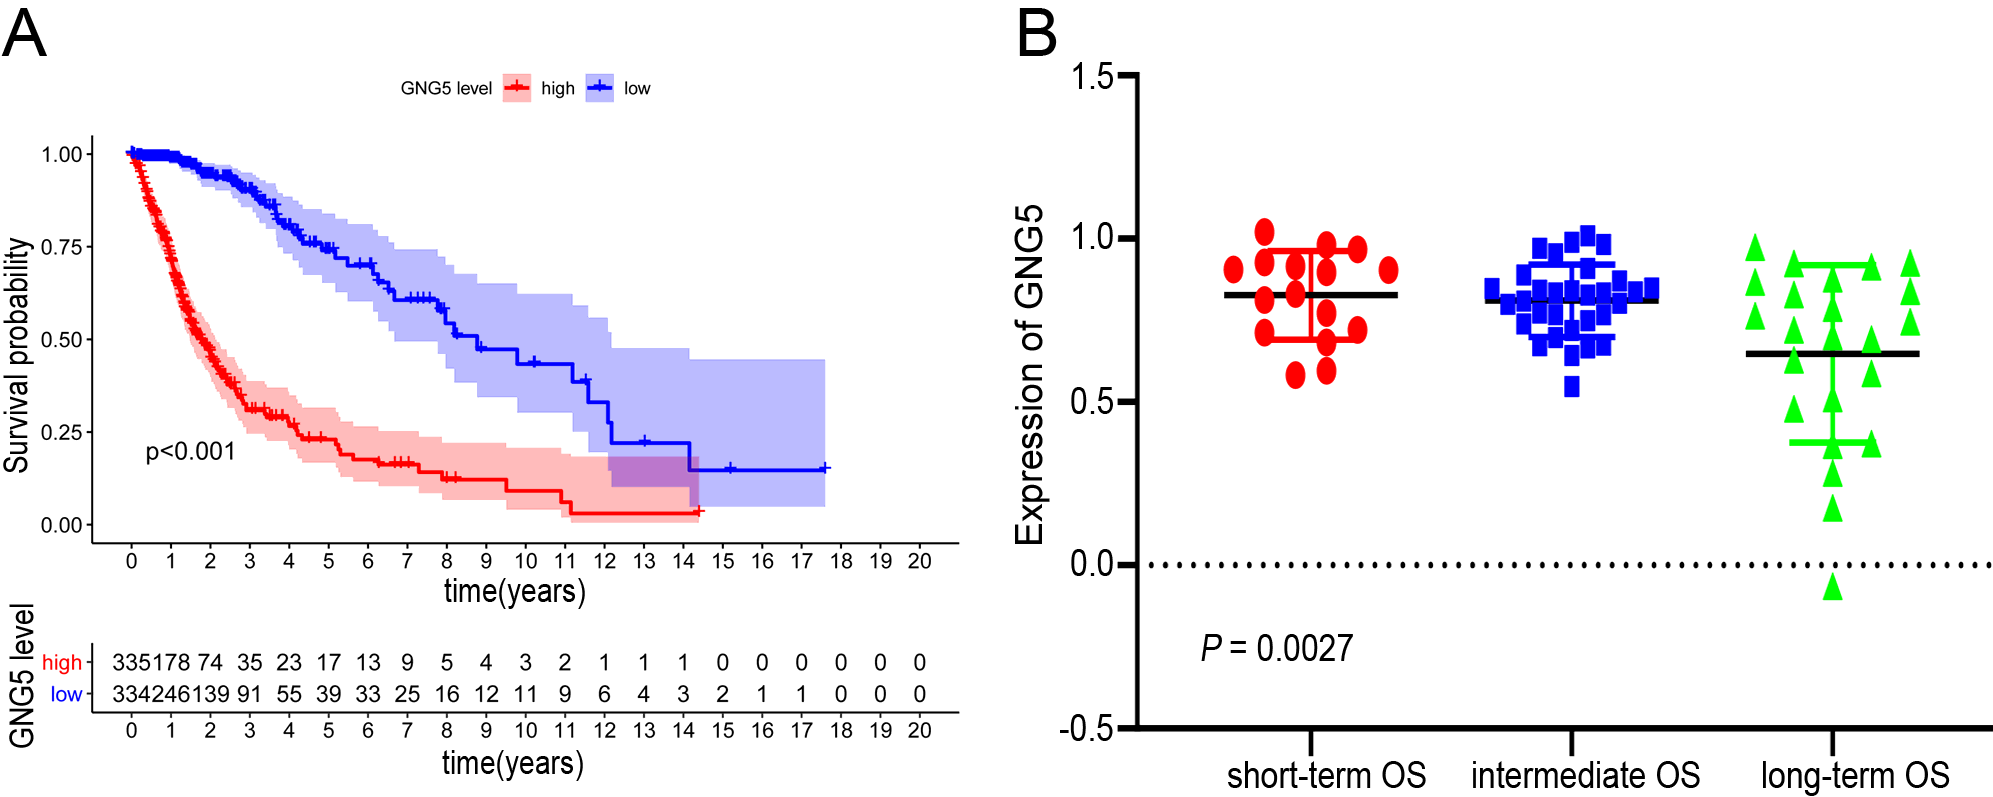
The average follow-up time for the 749 patients whose data for survival analysis is included in this study was 3.22 years. The results from the survival analysis showed that high expression of GNG5 is significantly correlated with reduced survival of glioma patients (Fig. 3A, P < 0.001); these results were verified by Kaplan-Meier method besed on TCGA database and the GNG5 expression analysis based on GSE53733 dataset (Figure S1A, B). Moreover, a time-dependent receiver operated characteristic (ROC) analysis showed that the values for area under the ROC curve (AUC) were 0.714, 0.792, and 0.821 for one, three, and five-year OS respectively (Fig. 3B). Therefore, our results indicate that GNG5 may serve as a biomarker for glioma patients, especially for the five-year OS group.
The results of a univariate analysis suggest that the high expression level of GNG5 in glioma patients is associated with reduced OS, primary recurrence or secondary (PRS) type, histological type, pathological grade, age, chemotherapy status, presence of mutations in the IDH gene, and a 1p/19q co-deletion (Fig. 4A). Additionally, results from the multivariate analysis indicate that the expression of GNG5, PRS type, pathological grade, age, chemotherapy status, presence of mutations in the IDH gene, and 1p/9q co-deletion were independently correlated with OS (Fig. 4B). The above data indicate GNG5 may serve as a prognostic factor and increased GNG5 expression is associated with poor OS.
Co-expression analysis of GNG5
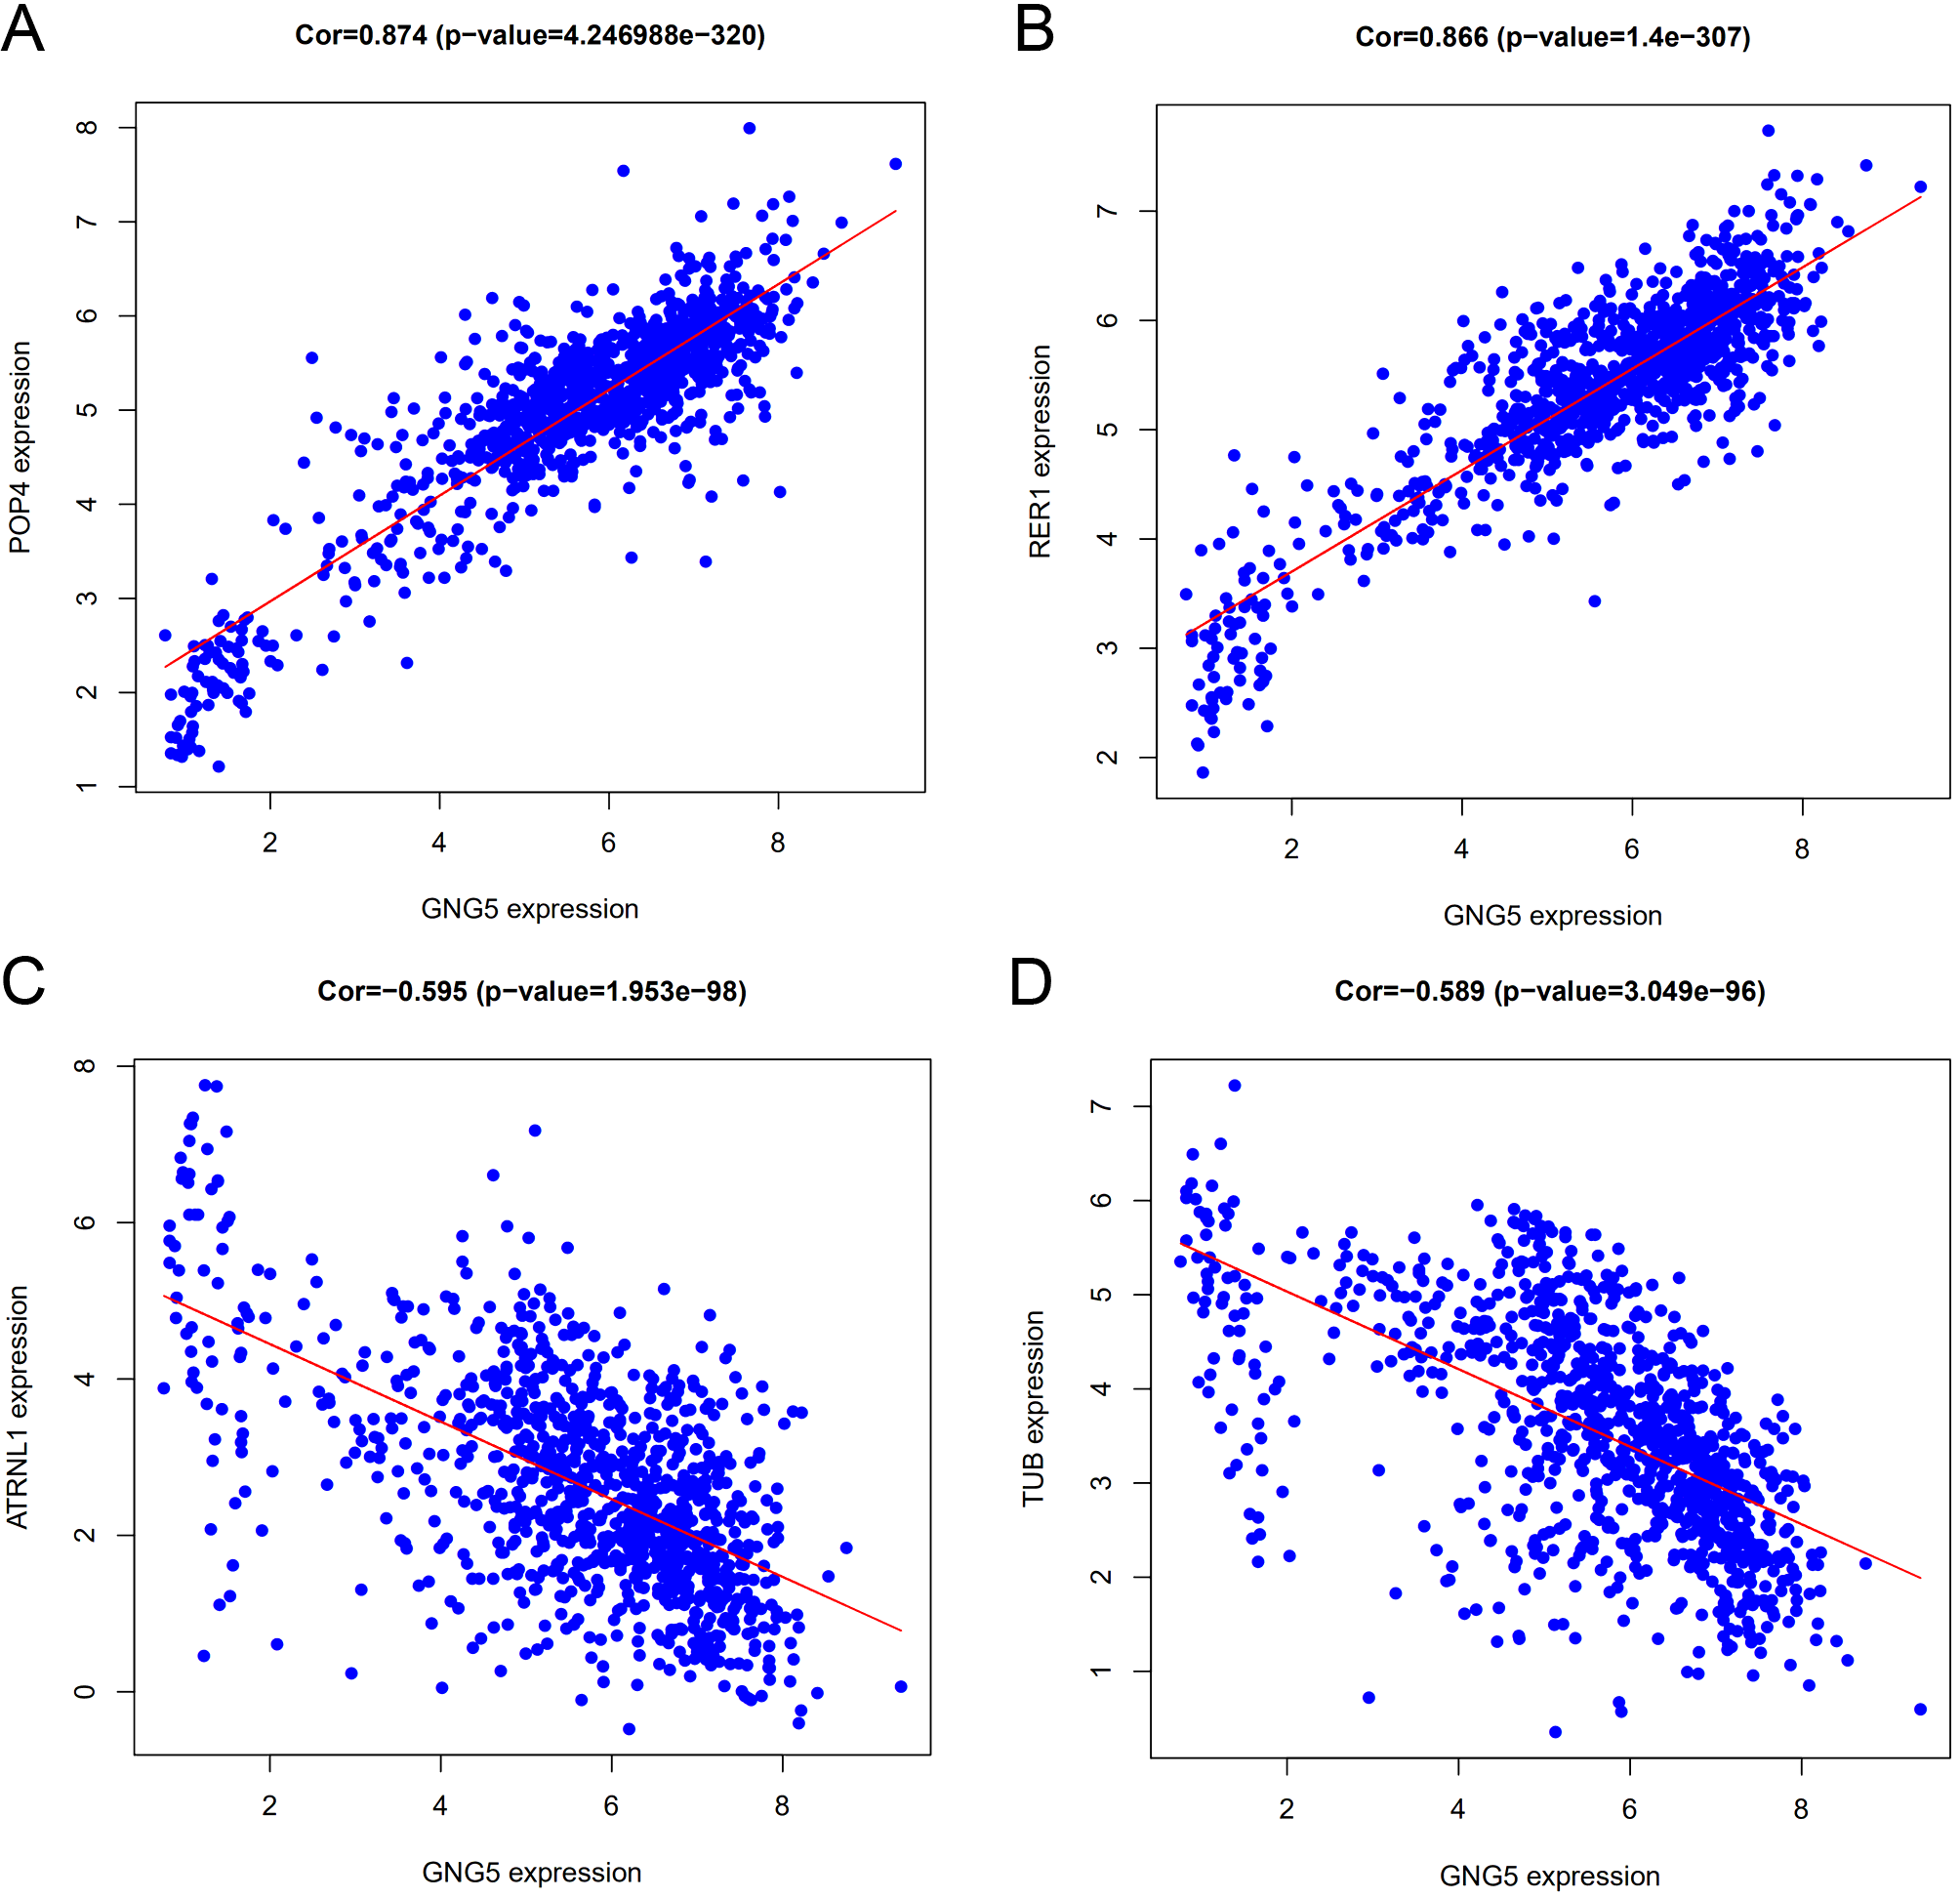
To further explore the function of GNG5, the limma package (Bioconductor) was used in the R statistical software to analyze the coexpression genes with GNG5. We found 4517 genes associated with GNG5 (correlation coefficient (Cor) > 0.5, P < 0.001), of which 29 genes were negatively correlated with GNG5 and a total of 4488 showed a positive correlation. A heatmap of the top 20 genes associated with GNG5 is shown in Fig. 5A and the five genes showing significant positive or negative correlation with GNG5 is shown in Fig. 5B. The 5 genes that showed positive correlation with GNG5 expression were RPF1 (Cor = 0.895, P = 0.000), AK2 (Cor = 0.893, P = 0.000), TMSB4X (Cor = 0.875, P = 4.249 × 10− 322), POP4 (Cor = 0.874, P = 4.247 × 10− 320) and RER1 (Cor = 0.866, P = 1.400 × 10− 307) (Fig. 5C-E and S2A, B), while the top 5 genes that were negatively correlated with GNG5 expression were RIMS1 (Cor = -0.665, P = 4.201 × 10− 131), CDYL2 (Cor = -0.61, P = 6.459 × 10− 105), RN7SL4P (Cor = -0.605, P = 1.370 × 10− 102), ATRNL1 (Cor = -0.595, P = 1.953 × 10− 98) and TUB (Cor = -0.589, P = 3.049 × 10− 96), (Fig. 5F-H and S2C, D;). Thus, GNG5 expression is correlated with various genes in gliomas.
GNG5 related signaling pathways based on GSEA
GSEA was used to identify GNG5 related signaling pathways involved in gliomas. A P < 0.05 and a false discovery rate (FDR) < 0.25 represented a significant enrichment in the results (in the enrichment of MSigDB Collection). Six pathways, including those involving the ECM-receptor interaction, focal adhesion, cell adhesion molecules, toll-like receptor signaling pathway, nod-like receptor signaling pathway, and the rig-like receptor signaling pathway showed significantly differential enrichment in samples from patients showing the GNG5 high expression phenotype based on NES, NOM P-values, and FDR values (Fig. 6; Table 1), indicating a potential role for GNG5 in the development of glioma.
Table 1
Signaling pathways enriched in high expression of GNG5.
|
Gene set name
|
NES
|
NOM P-value
|
FDR
q-value
|
|
KEGG_ECM_RECEPTOR_INTERACTION
|
1.85
|
0.008
|
0.1
|
|
KEGG_FOCAL_ADHESION
|
1.81
|
0.004
|
0.076
|
|
KEGG_CELL_ADHESION_MOLECULES_CAMS
|
1.77
|
0.026
|
0.096
|
|
KEGG_TOLL_LIKE_RECEPTOR_SIGNALING_PATHWAY
|
1.76
|
0.002
|
0.092
|
|
KEGG_NOD_LIKE_RECEPTOR_SIGNALING_PATHWAY
|
1.75
|
0.016
|
0.093
|
|
KEGG_RIG_I_LIKE_RECEPTOR_SIGNALING_PATHWAY
|
1.74
|
0.008
|
0.093
|
| |
| |
GNG5 is related to the immune microenvironment
Next, we explored whether there is a correlation between GNG5 expression and the tumor immune microenvironment. We analyzed 29 immune-system related gene sets characterizing different types and functions of immune cells (Table S2). Based on data from the CGGA database, ssGSEA was used to quantify and hierarchically cluster immune cells in tumor samples into three groups. According to the clustering heat map of immune cell gene sets in the three groups, a high immunity group (high-immune), medium immunity group (mid-immune), and low immune activity group (low-immune) were defined (Fig. 7A). Moreover, the high-immune group had a significantly higher immune score than that of the low-immune group, though the tumor purity showed the opposite characteristics (Fig. 7B, C). Interestingly, we found that the expression of GNG5 was significantly increased in the high-immune group, and decreased in the low-immune group (P < 0.001, Fig. 7D). Further, we used TIMER to analyze the relationship between GNG5 expression and infiltration abundance of six immune cells (B cells, CD4 + T cells, CD8 + T cells, neutrophils, macrophages, and dendritic cells) after purity correction in glioma [23, 25]. We found that GNG5 expression was positively correlated with the infiltrating abundance of CD8 + T cell (Cor = 0.154, P = 7.29 × 10− 4), B Cell (Cor = 0.453, P = 1.40 × 10− 25), macrophages (Cor = 0.544, P = 9.10 × 10− 38), CD4 + T cells (Cor = 0.549, P = 6.68 × 10− 39), neutrophils (Cor = 0.554, P = 1.25 × 10− 39), dendritic cell (Cor = 0.582, P = 2.06 × 10− 44) in LGG. B Cell (Cor = 0.112, P = 0.022), macrophages (Cor = 0.179, P = 0.000), and dendritic cells (Cor = 0.241, P = 5.88 × 10− 7) were corrected with GNG5 expression in GBM (Fig. 7E). These results suggest that GNG5 may be a potential factor influencing the immune microenvironment in glioma.