3.1. Statistical description of heavy metal contents in wheat samples
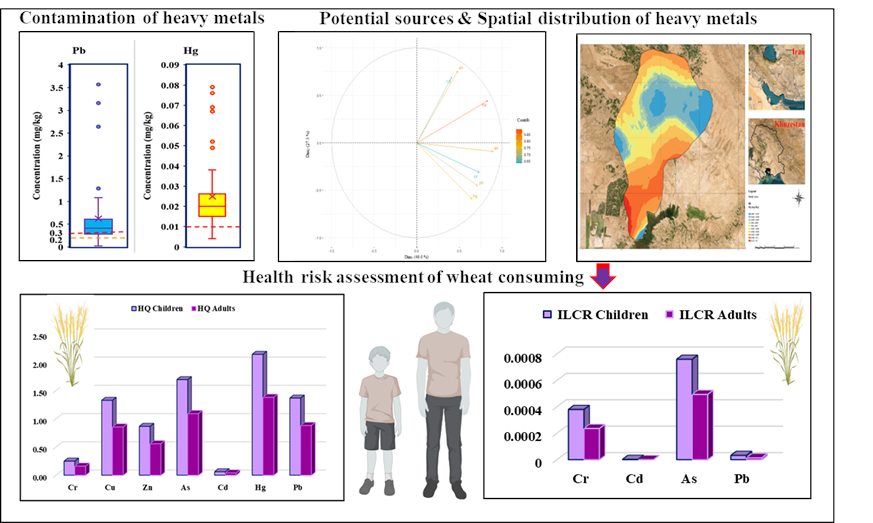
A box and whisker plot (Fig. 3) shows the heavy metal concentrations in the wheat grains. The values and descriptive statistics of the heavy metal concentrations in the wheat grains are shown in Table 1. According to the results obtained, the heavy metal concentrations in the wheat grains decreased in the order Zn > Cu > Pb > Cr > As > Hg > Cd, with mean values of 30.17, 6.2, 0.63, 0.087, 0.06, 0.03 and 0.007 mg/kg, respectively. The Iranian National Standard Organization (INSO) has issued guidelines for HMs in wheat grains, specifically focusing on Pb and Cd. Hence, this study involved comparing HMs in wheat grains against INSO's Pb and Cd standards, as well as the standards established by the Codex Alimentarius Commission (FAO/WHO) for all HMs. Zn (30.17 mg/kg) and Cu (6.20 mg/kg) exhibited the maximum quantity, while Cd (0.007 mg/kg) showed the minimum quantity in the wheat grains. The study revealed that Zn and Cu had significantly higher concentrations in the grain sample. These two elements also exhibited the highest concentrations in the present study. The significant presence of Zn in wheat was attributed to its high concentration in the soil (Jia et al., 2010). The concentrations of Zn, Cu, Cr, and Cd in all samples were found to be below the maximum permissible concentrations (MPCs) set by the FAO/WHO (Commission, 2011), which are 99.4 mg/kg for Zn, 73.3 mg/kg for Cu, 2.3 mg/kg for Cr, and 0.2 mg/kg for Cd, as well as below the INSO ((INSO), 2021) standards for Cd, which is 0.06 mg/kg. However, this study revealed that the levels of Pb in wheat exceeded both the INSO (INSO, 2021) and FAO/WHO (Commission, 2011) MPC values, which were 0.2 mg/kg and 0.3 mg/kg, respectively, except for two samples. The Hg concentration in 44 wheat grain samples was found to be equal to or greater than the MPC (0.01 mg/kg) given by the FAO/WHO. Remarkably, while the transfer of Hg from soil to plants is not straightforward, plants can nonetheless uptake Hg from both the soil and airborne particles. This suggests that aerial deposition of Hg might be responsible for the increased Hg levels observed in the grains(Jia et al., 2010). Moreover, in 6 samples, the As concentration reached or exceeded the MPC of 0.1 mg/kg given by the FAO/WHO (Ahmad et al., 2019; Ahmed et al., 2013; Commission, 2011; Mengistu, 2021). The Shapiro‒Wilk test revealed that the heavy metal distribution was nonnormal (P ≤ 0.05) (Zhou et al., 2014). Thus, data normalization through logarithmic transformation was performed before utilizing the kriging method. Skewness and kurtosis were used to assess the asymmetry of the real-valued probability distribution. Positive skewness, indicated by a skewness value greater than zero, signifies that more values are concentrated on the right side of the symmetry axis. However, kurtosis measures the steepness of the distribution pattern. The coefficient of variation (CV) functions as a metric that reveals the extent of scattering. In this research, its use aimed to assess the diversity in heavy metal concentrations and the degree of distinction among the sampled locations.
| | Table 1. Descriptive statistics of heavy metal concentrations in wheat grains. |
| Element | Count | Min(mg/Kg) | Max(mg/Kg) | Median(mg/Kg) | SD | Mean(mg/Kg) | C.V % | Skewness | Kurtosis | |
| Cr | 50 | 0.02 | 0.30 | 0.07 | 0.06 | 0.087 | 68.37 | -0.09 | 2.40 | |
| Cu | 50 | 3.90 | 10.60 | 5.80 | 1.25 | 6.20 | 20.12 | 0.08 | 3.60 | |
| Zn | 50 | 21.30 | 58.50 | 29.10 | 6.30 | 30.17 | 21.10 | 1.22 | 6.20 | |
| As | 50 | 0.01 | 0.14 | 0.06 | 0.03 | 0.06 | 53.51 | -0.43 | 2.80 | |
| Cd | 50 | 0.001 | 0.018 | 0.007 | 0.003 | 0.007 | 45.53 | -0.05 | 3.35 | |
| Hg | 50 | 0.004 | 0.08 | 0.02 | 0.02 | 0.03 | 70.00 | 0.09 | 3.45 | |
| Pb | 50 | 0.02 | 3.60 | 0.42 | 0.70 | 0.63 | 109.76 | -0.27 | 6.60 | |
Human activities significantly contribute to soil pollution in wheat fields in Ahvaz. The main factors include oil fields, proximity to roads and highways, the extensive use of chemical and animal fertilizers, and the use of pesticides and herbicides (Afkhami et al., 2013; Alengebawy et al., 2021; Karbassi et al., 2015; Radziemska & Fronczyk, 2015). Given that the primary water source for wheat fields in the present study, where heavy metal concentrations are high, is the Karun River or its related water channels, which have been contaminated by the discharge of municipal and industrial wastewater, irrigation water might also play a role in the elevated levels of heavy metals in the soil, ultimately resulting in the buildup of these contaminants in wheat grains. (Ali et al., 2012; Rizvi et al., 2020).
3.2. Potential sources of heavy metal pollution in wheat samples
The Spearman correlation coefficient technique and principal component analysis were utilized to evaluate the connections and potential origins of heavy metals (El Behairy et al., 2022; Liu et al., 2023). For the effective management of soil heavy metal contamination, the qualitative recognition of pollution origins and the allocation of sources are of pivotal significance. Approaches to pinpointing these origins include the use of geostatistical models in conjunction with multivariate statistical methods such as principal component analysis (PCA). PCA, which operates as a linear approach for diminishing dimensionality, reconfigures a range of environmental variables into distinct origins, utilizing a constrained set of principal components (Lv, 2019; Tian et al., 2020). Figure 4 shows the Spearman correlation matrix for the heavy metal concentrations and the PCA of the heavy metals in the wheat samples. The Spearman correlation coefficients revealed strong correlations between certain metals. Specifically, Cr, Cu, As, Hg, and Pb are closely linked (P < 0.01). Additionally, Cu, Zn, As, Cd, and Pb also had significant associations (P < 0.01). Furthermore, As, Hg, and Pb exhibited strong relationships (P < 0.01). Importantly, Pb had a somewhat weaker correlation with Hg (P < 0.05), and Zn had a weaker correlation with Cd (P < 0.05). These connections between the metals could be due to common sources of pollution. The outcomes of the PCA are presented in Table 2. These results revealed the presence of two eigenvalues greater than one, which, when combined, explained 75.32% of the total variance (Table 3). The primary component accounts for a significant portion, precisely 48%, of the total variance and exhibits strong loadings for As, Cr, Pb, and Hg. Conversely, the secondary factor, characterized by the dominance of Cd, Zn, and Cu, contributed 27.32% of the total variance. The correlation results align with our PCA findings, and they also correspond closely to the outcomes of a study conducted in China (Pan et al., 2016). The outcomes of our examination using PCA and Spearman correlations suggest the existence of two main origins for heavy metals. The first source primarily included As, Cr, Pb, and Hg. Pb is largely a result of activities related to vehicles and traffic, as noted in research by Mathur et al. (2016) and Sabin et al. (2006). Furthermore, Cr originates from both vehicular and agricultural practices. The use of fungicides, pesticides, and fertilizers in agriculture is the primary source of As and Hg contamination. Thus, given the widespread application of fertilizers and the proximity of fields to roads in our study area, we can conclude that Pb, Cr, As, and Hg are pollutants originating from vehicle emissions and agricultural activities. The second source mainly consisted of Cd, Cu, and Zn. In our current study, we collected wheat samples with elevated levels of Cd, Cu, and Zn from fields located near oil fields. Previous research has established a strong connection between the increased presence of Cd, Cu, and Zn in soils and the presence of oil fields. Therefore, the second source can be attributed to human activities associated with the oil industry. Liu and colleagues introduced the spatial distribution-principal component analysis (SD-PCA) model, which integrates spatial soil pollution characteristics with linear data transformation using eigenvector-based PCA. Their results emphasized agriculture as the main driver of soil pollution (65.5%), resulting from the cumulative impacts of various heavy metals. Traffic and inherent origins constituted 17.9% and 11.1%, respectively. The model's capacity to monitor heavy metal pollution is valuable for evaluating and managing multisource soil contamination(Liu et al., 2023). Another study in Xiangfen County, China, revealed that soil sample levels were slightly greater than regional background levels, with Hg and Cd showing significant enrichment. Principal component and cluster analyses identified three main sources of these heavy metals, including agricultural practices, natural parent materials, and industrial activities (Pan et al., 2016).
Table 2
Rotated factor structure of heavy metal data in wheat samples.
| | Component | |
| Element | 1 | 2 |
| Cr | 0.784 | 0.143 |
| Cu | 0.451 | 0.828 |
| Zn | − 0.015 | 0.897 |
| As | 0.798 | 0.416 |
| Cd | − 0.038 | 0.805 |
| Hg | 0.867 | − 0.140 |
| Pb | 0.845 | 0.016 |
| Eigenvalue | 3.36 | 1.91 |
| % Of Variance explained | 48.00 | 27.32 |
| % Of cumulative | 48.00 | 75.33 |
| Extraction method: principal component analysis. Rotation method: varimax with Kaiser normalization. Rotation converged in three iterations. |
Table 3
Outcomes of Principal Component Analysis.
| | Component | |
| | 1 | 2 |
| % Of Variance | 48.00 | 27.32 |
| Cr | 0.733 | − 0.311 |
| Cu | 0.832 | 0.444 |
| Zn | 0.481 | 0.757 |
| As | 0.895 | − 0.092 |
| Cd | 0.411 | 0.693 |
| Hg | 0.648 | − 0.594 |
| Pb | 0.715 | − 0.451 |
3.3. Spatial distribution of heavy metals in wheat samples
The ordinary kriging interpolation method in ArcGIS Pro 3.0.2 software was utilized to analyze the spatial distribution of heavy metals in the wheat samples (Ghong et al., 2023). Geostatistical methods, with ordinary kriging being the most favored, are extensively used across different disciplines. The versatility of ordinary kriging, originally intended for mineral reserve estimation, has led to its widespread adoption in various fields (Zhang et al., 2021). The kriging interpolation method has broad applications in the disciplines of pedology, environmental studies, and the study of ecosystems, particularly when dealing with regional variables. Its characteristics make it well suited for estimating and analyzing spatial variations in these fields (Dong et al., 2024). By leveraging spatial correlation variance, this method effectively interpolates data and aims to deliver the most accurate and unbiased estimates for unknown values within the study area (Zeng et al., 2023; Zhao et al., 2023). When certain conditions related to covariance are met, it provides the most accurate linear unbiased estimation for values at unsampled finite positions. This prediction is based on a variogram model established from the spatial arrangement and semivariance of the initial dataset (Peng et al., 2023). The kriging method calculates the value at a given point by determining a weighted mean of observed data points in the immediate vicinity. These weights are determined according to the spatial connection of the point to all the collected samples. (Wang et al., 2014). This approach utilizes a semivariogram, which is established based on sample characteristics, to assess how the spacing between sample data points influences the estimated attribute values, and the resulting estimator is expressed using Eq. 5.
Z∗ (S0) = \(\:\sum\:_{\text{i}=1}^{n}{\lambda\:}_{i}\left({S}_{0}\right)Z\left({S}_{0i}\right)\:\) (5)
Z (S0i) refers to the value assigned to the specific point S0i, which represents a sample taken at location i. In this context, λi (S0) represents the standard kriging weight for location S0, and Z*(S0) represents the approximated value at S0. The ideal kriging interpolation model should have a root mean square (RMS) and average squared error (ASE) close to 0 and a root mean square standardized error (RMSS) close to 1. These criteria ensure accurate and precise estimates with minimal bias and variability, making the model reliable for data interpolation in various applications. These principles serve as the key criteria for selecting the most appropriate interpolation model for a given application (Saha et al., 2023). At the same time, to distinguish between the dominant effects of inherent factors (natural influences) and stochastic factors (human influences) on spatial regional variation, the ratio of nugget value to sill value has also been regarded as a vital indicator. This index helps assess the level of spatial variability in regionalized variables (Zhao et al., 2023). The results of the fitted variogram models using various autocorrelation structures are shown in Table 4. Figure 5 displays a series of maps depicting the spatial patterns of the estimated values of the heavy metals.
Table 4
The results of the fitted variogram models using various auto-correlation structures
| Element | Fitting models | Nugget | Range | Partial sill | RMS | MS | RMSS | ASE |
| Cr | Exponential | 0.09 | 0.20 | 0.32 | 0.06 | -0.09 | 1.00 | 0.08 |
| Cu | Gaussian | 0.00 | 0.13 | 0.04 | 1.20 | 0.00 | 0.99 | 1.21 |
| Zn | Gaussian | 0.00 | 0.06 | 0.03 | 6.77 | -0.01 | 1.01 | 6.30 |
| As | Gaussian | 0.02 | 0.06 | 0.35 | 0.05 | -0.13 | 1.01 | 0.06 |
| Cd | Exponential | 0.02 | 0.09 | 0.27 | 0.00 | -0.08 | 0.98 | 0.00 |
| Hg | Exponential | 0.02 | 0.41 | 0.26 | 0.02 | -0.05 | 1.16 | 0.02 |
| Pb | Gaussian | 0.10 | 0.06 | 0.29 | 0.65 | -0.18 | 1.17 | 0.56 |
The highest levels of the metals Cd, Zn, and Cu were detected within the northeastern and eastern portions of the study region. A notable point is the presence of the Ramin power plant and the Maroun oil field in these regions. Oil fields have the potential to influence the dispersion of heavy metals in soil due to the process of extracting crude oil, leading to the concurrent pollution of the soil with both petroleum and heavy metals. Prior research suggests that the concentrations of heavy metals such as Cu, Zn, and Cd in soils contaminated by oil tend to increase as oil well operations continue, highlighting that human activities intensify the presence of these metals in oil fields. Among the elements that can detrimentally impact the soil environment in oil-polluted areas, Cd is identified as the most unstable, accessible, and harmful heavy metal, with a lower potential for mobility than Zn and Cu (Fu et al., 2014). Industrial emissions also contribute to higher heavy metal concentrations, as exemplified by cadmium levels exceeding permissible limits around the Ramin power plant in Ahvaz (Mostafaii et al., 2021). A study in Sehwan Sharif, Jamshoro, analyzed heavy metal concentrations in topsoil samples and grouped elements. Cd, Ni, As, Cr, Pb, and Zn were linked to human activities, while Fe, B, Mn, and Cu were natural spatial maps that indicated metal hotspots, particularly high Zn levels in the city center, attributed to traffic emissions (Bux et al., 2023). In our study, the highest levels of Pb were measured in the southeast and west, and the highest levels of Cr were measured in the southeast. In the vicinity of highways, the soil in this study was subjected to the presence of harmful heavy metals originating from vehicle exhaust emissions and a variety of other waste materials associated with transportation. Lead is the predominant heavy metal discharged from road traffic, comprising a minimum of 90% of the total metals in runoff from roads. Additionally, chromium (Cr) is detected in both road runoff and vehicle exhaust emissions (Gao et al., 2022; Nawrot et al., 2020; Pan et al., 2016). The highest levels of Hg were measured in the southwest and the northern, eastern, and southwestern regions. The use of pesticides may play a role in contaminating agricultural soil with heavy metals. Some pesticides include heavy metal components, notably arsenic and lead. Heavy metals such as Hg, As, and Cr can come from various sources in agriculture, including fertilizers, pesticides, livestock manure, and wastewater. Large quantities of fertilizers and pesticides are used in wheat farming within this locality (Ahmadi et al., 2019; Alengebawy et al., 2021). A study near Pb‒Zn and Au mines assessed heavy metal contamination in soil, revealing elevated levels of As and Pb, exceeding Vietnam's residential soil standards. The pollution indices revealed Pb and As as the main contaminants, while the statistical analysis suggested a combination of human and natural sources (Tran et al., 2022). Cereals such as wheat naturally gather heavy metals from a range of sources, including soil, water, and the atmosphere. Nevertheless, the soil primarily plays the leading role in contaminating these plants with heavy metals. In times of drought, substantial amounts of heavy metals stemming from vehicular actions tend to accumulate on roads and intersections. As a result, these contaminants are carried into the soil environment by stormwater runoff, resulting in elevated levels of heavy metals within the soil (Liu et al., 2023). Furthermore, the presence of fossil fuel resources and the expansion of the oil and gas industries in Ahvaz and neighboring regions significantly impact atmospheric conditions, affecting the transport of heavy metal pollutants (Darvishi Khatooni, 2017). Dust storms in Ahvaz transport heavy metals and other pollutants from both local and foreign sources, becoming a major environmental challenge. Prevailing winds in the region, such as winds from Iraq, transport dust and soil containing heavy metals, contributing to soil and agricultural pollution. The Karun River, which serves as the primary water source in Ahvaz, is crucial for providing water to support agriculture in the area. Current studies indicate that the influx of urban and industrial sewage has led to an increase in pollution in this river, leading to heightened concentrations of heavy metals in crops that are watered with this water. The extensive data analysis, including statistics, correlations, and PCA, revealed congruity among the results. Additionally, these outcomes harmonize effectively with the spatial maps produced.
3.3. Health risk assessment of wheat consumption
The mean EDI, HQ, and HI values of the heavy metals related to noncarcinogenic human health risks due to wheat consumption are presented in Table 5 for both adults and children. The results indicate that the mean EDI for adults was less than that for children. According to Table 3, the order of HQ values in both children and adults is as follows: Hg > As > Pb > Cu > Zn > Cr > Cd. HQ values higher than 1 were found for Hg, As, Pb, and Cu among children. Conversely, in adults, only Hg and As had HQ values greater than 1. The hazard index (HI) was greater than 1 for both adults and children. This implies that prolonged wheat consumption has exposed the inhabitants of the research area to a notable potential noncarcinogenic health hazard. Furthermore, concerning Table 6, the outcomes of the evaluation regarding cancer risk stemming from the consumption of heavy metal-contaminated wheat indicated that the carcinogenic risk exceeded the acceptable threshold at specific sampling sites. Cr (adults: 0.000236; children: 0.00038), followed by As (adults: 0.000494; children: 0.00076), had the greatest potential carcinogenic risk. The ILCR associated with Pb exceeded 10− 4 in certain locations (adults: 6 sites; children: 10 sites). Conversely, the ILCR linked to cadmium reached only 10− 4 in a single instance, exclusively concerning children.
Table 5
EDI, HQ, and HI mean values of the heavy metals related to noncarcinogenic human health risks due to wheat consumption
| Element | EDI (mg/kg.day) | HQ | HI=ƩHQ |
| Children | Adults | Children | Adults | Children | Adults |
| Cr | 0.001 | 0.000 | 0.249 | 0.160 | 7.702 | 4.964 |
| Cu | 0.082 | 0.026 | 1.326 | 0.855 |
| Zn | 0.402 | 0.129 | 0.865 | 0.557 |
| As | 0.001 | 0.003 | 1.693 | 1.091 |
| Cd | 0.000 | 0.000 | 0.062 | 0.040 |
| Hg | 0.000 | 0.000 | 2.141 | 1.380 |
| Pb | 0.008 | 0.003 | 1.367 | 0.881 |
Table 6
Incremental lifetime cancer risk (ILCR) of heavy metals related to carcinogenic human health risks due to wheat consumption
| Element | ILCR |
| Children | Adults |
| Cr | 0.00038 | 0.000236 |
| Cd | 0.000002 | 0.000 |
| As | 0.00076 | 0.000494 |
| Pb | 0.000032 | 0.000014 |
Our findings are consistent with the conclusions reached by Zheng et al., Zafarzadeh et al., Gruszecka-Kosowska et al., Setia et al. and Dehghani et al. (Dehghani et al., 2017; Gruszecka-Kosowska, 2020; Setia et al., 2023; Zheng et al., 2020). In contrast, Huang et al. revealed that HQ derived from wheat consumption was less than one across all age categories (Huang et al., 2008). A study by Mansouri Moghadam et al. (Mansouri Moghadam et al., 2022) examined the health risks associated with heavy metals in wheat samples collected from farms in the northern regions of Ahvaz. The HQ values for cadmium, lead, nickel, chromium, and manganese exceeded 1 for both age groups, while the HQ values for copper, iron, and cobalt were less than 1. Additionally, the ILCRs for toxic metals such as cadmium, lead, nickel, and chromium exceeded 10− 4. Shi and colleagues studied the variations in heavy metal levels in Chinese soil over time and across different locations, with a particular focus on pollution assessment and risk analysis. Their investigation revealed that regions where LCR values exceeded 1 × 10− 4 represented 1.35% for adult females, 1.26% across all the evaluated areas for children, and 0.80% for adult males (Shi et al., 2023). A study in Punjab, India, investigated heavy metal (HM) contamination in soil and wheat grain samples near the Sutlej River. High levels of Cd and Pb pose health risks, with Cd having carcinogenic potential (Setia et al., 2023). Mercury vapor has a significant impact on sensory, cognitive, and motor functions. Methylmercury, which is more toxic than standard mercury, disrupts the development of the peripheral nervous system in newborns. Overexposure to methylmercury leads to Minamata disease, and skin absorption is also possible. People can come into contact with mercury by inhaling elemental mercury vapor in occupational settings, consuming seafood, engaging in environmental activities, having dental amalgam fillings, and encountering organic mercury compounds (Kumari & Bhattacharya, 2023). Both arsenite and arsenate are effectively absorbed via both oral ingestion and inhalation routes. Once arsenic is taken into the body, arsenate is converted to arsenite, leading to the presence of both As(III) and As(V) in the bloodstream(Yüksel et al., 2018). Increased exposure to Cr(VI) in children can result in a range of health problems, including periodontitis, stomatitis, peptic ulcers, and nasal bone perforation. The absorption of orally ingested Cr is constrained to below ten percent in the gastrointestinal tract, while more soluble compounds display heightened absorption rates. Cr can partially infiltrate human skin, especially when the integrity of the skin is compromised (Kumari & Bhattacharya, 2023). Pb is the primary source of noncarcinogenic risk, and As poses a notable carcinogenic danger. Soil specimens collected from mining and industrial regions, which encompass electronic manufacturing facilities and locations for e-waste disassembly, exhibit substantial pollution. This situation heightens potential hazards to both the environment and human well-being (Shi et al., 2023). However, the HI values consistently tended to be greater in children than in adults. This pattern highlights the heightened vulnerability of children to contamination of wheat by heavy metals. This increased susceptibility can be attributed to their lower body weight and reduced physical resilience (Wang et al., 2023). Research findings demonstrate that the greatest increases in the levels of heavy metals, such as lead, copper, and cadmium, were detected within the soils of the eastern and northeastern sections of Khuzestan. Human activities are the primary sources responsible for the presence of these pollutants. Heavy metals found in agricultural soils adjacent to roads originate from emissions produced by vehicles (Chen et al., 2010; Nduka et al., 2023). Investigations indicate that metals such as lead, copper, and cadmium infiltrate the soil through mechanisms such as erosion from vehicle brakes, tire abrasion, oil leaks, and cylinder head washers (Petukhov et al., 2023). Moreover, these metals have been applied in various fields, including pigments, fungicides, batteries, and alloys such as bronze and brass. Fertilizers, particularly those derived from animals, contribute to the accumulation of these compounds within soils and the subsequent contamination of plants (He et al., 2023). Additionally, the proximity to the Ramin power plant may lead to increased concentrations of these elements in the surrounding region. Overall, the outcomes of evaluating the health risks associated with heavy metals in wheat samples suggested that consuming this product might lead to negative and acute effects for individuals. The unregulated and prolonged use of agricultural inputs, coupled with the establishment of industrial facilities in close vicinity to agricultural lands, the indiscriminate deployment of chemical fertilizers, the utilization of sewage sludge as fertilizers, the cultivation of wheat in proximity to high-traffic roads, and the adoption of urban sewage for irrigation, collectively pose a potential risk for contaminating wheat crops. This subsequent contamination has the potential to exert ramifications on derivative products such as bread. The resulting scenario could have enduring health implications for consumers. Hence, it is prudent to maintain a consistent regimen of monitoring food commodities with respect to their levels of heavy metals and residues of chemical compounds to maintain the integrity of food safety protocols.