Stressor-induced changes to microbial composition:
Random Forest analysis was used to identify a subset of the community driving differences in community composition (Figure 3). For this analysis, features that were present in less than half of the samples in all diet-day combinations at 0 h (start of fermentation) were removed and the fermentation time points data (0, 5, 10 and 24 h) were combined, resulting in an analysis as a function of the diet and study day.15% of the genera (30 out 201 total) were identified for all the groups, but a differentiation by taxa and diet groups was not obtained. For that, a linear mixed model analysis using a multivariate ANOVA with repeated measures on the identified 30 taxa was employed to detect abundance variations as a function of the MRE-diet intervention (Diet*StudyDay*Fermentation Time interaction).
Out of the remaining taxa derived from Random Forest analysis, five taxa, Dorea spp., Akkermansia muciniphila, Prevotella spp., Desulfovibrio spp., and Dialister spp., were identified as having a statistically significant interaction between diet, study day, and fermentation residence time (p-values 0.0061, 0.0147, 0.0004, 0.0198, 0.0002 respectively), (Figure 4). Dorea spp. notably increases in the MRE day 21 group after 10 h of exposure to starch-supplemented medium relative to the other groups (Figure 4A). Akkermansia muciniphila was diminished in relative abundance in MRE day 21 compared to HAB diet day 0 and 21 and MRE day 0 throughout the fermentation; however, the rate of change over the course of fermentation differed in MRE day 21 compared to MRE day 0 (p<0.001) as determined by an equality of slopes test (Figure 4B, Figure S4B). A similar case was observed for Prevotella spp. where abundance at inoculation was higher but decreased as the fermentation proceeded (Figure 4C); however, differences between MRE day 0 and MRE day 21 were not detected at later time-points, and after 24 h residence time, this organism was completely diminished in both groups. Desulfovibrio spp. abundance was higher at the beginning of the fermentation in the MRE day 21 group relative to the other groups but decreased more rapidly during fermentation (p>0.001) such that no difference was observed between groups after 24 h (Figure 4D, Figure S4D). Dialister in MRE 21 was significantly different than that of HAB 0, HAB 21, or MRE 0 at multiple time-points, and an equality of slopes test further indicated differential growth over the course of fermentation (p<0.001) (Figure S4E). Because changes between HAB 0 and HAB 21 were also observed, we cannot conclusively state that Dialister's growth in MRE 21 is due to the all-MRE diet. (Figure 4E). See supplementary Tables S1 and S2 for more details about the p-values and completed analysis.
Stressor-induced changes to Microbial Functional Potential
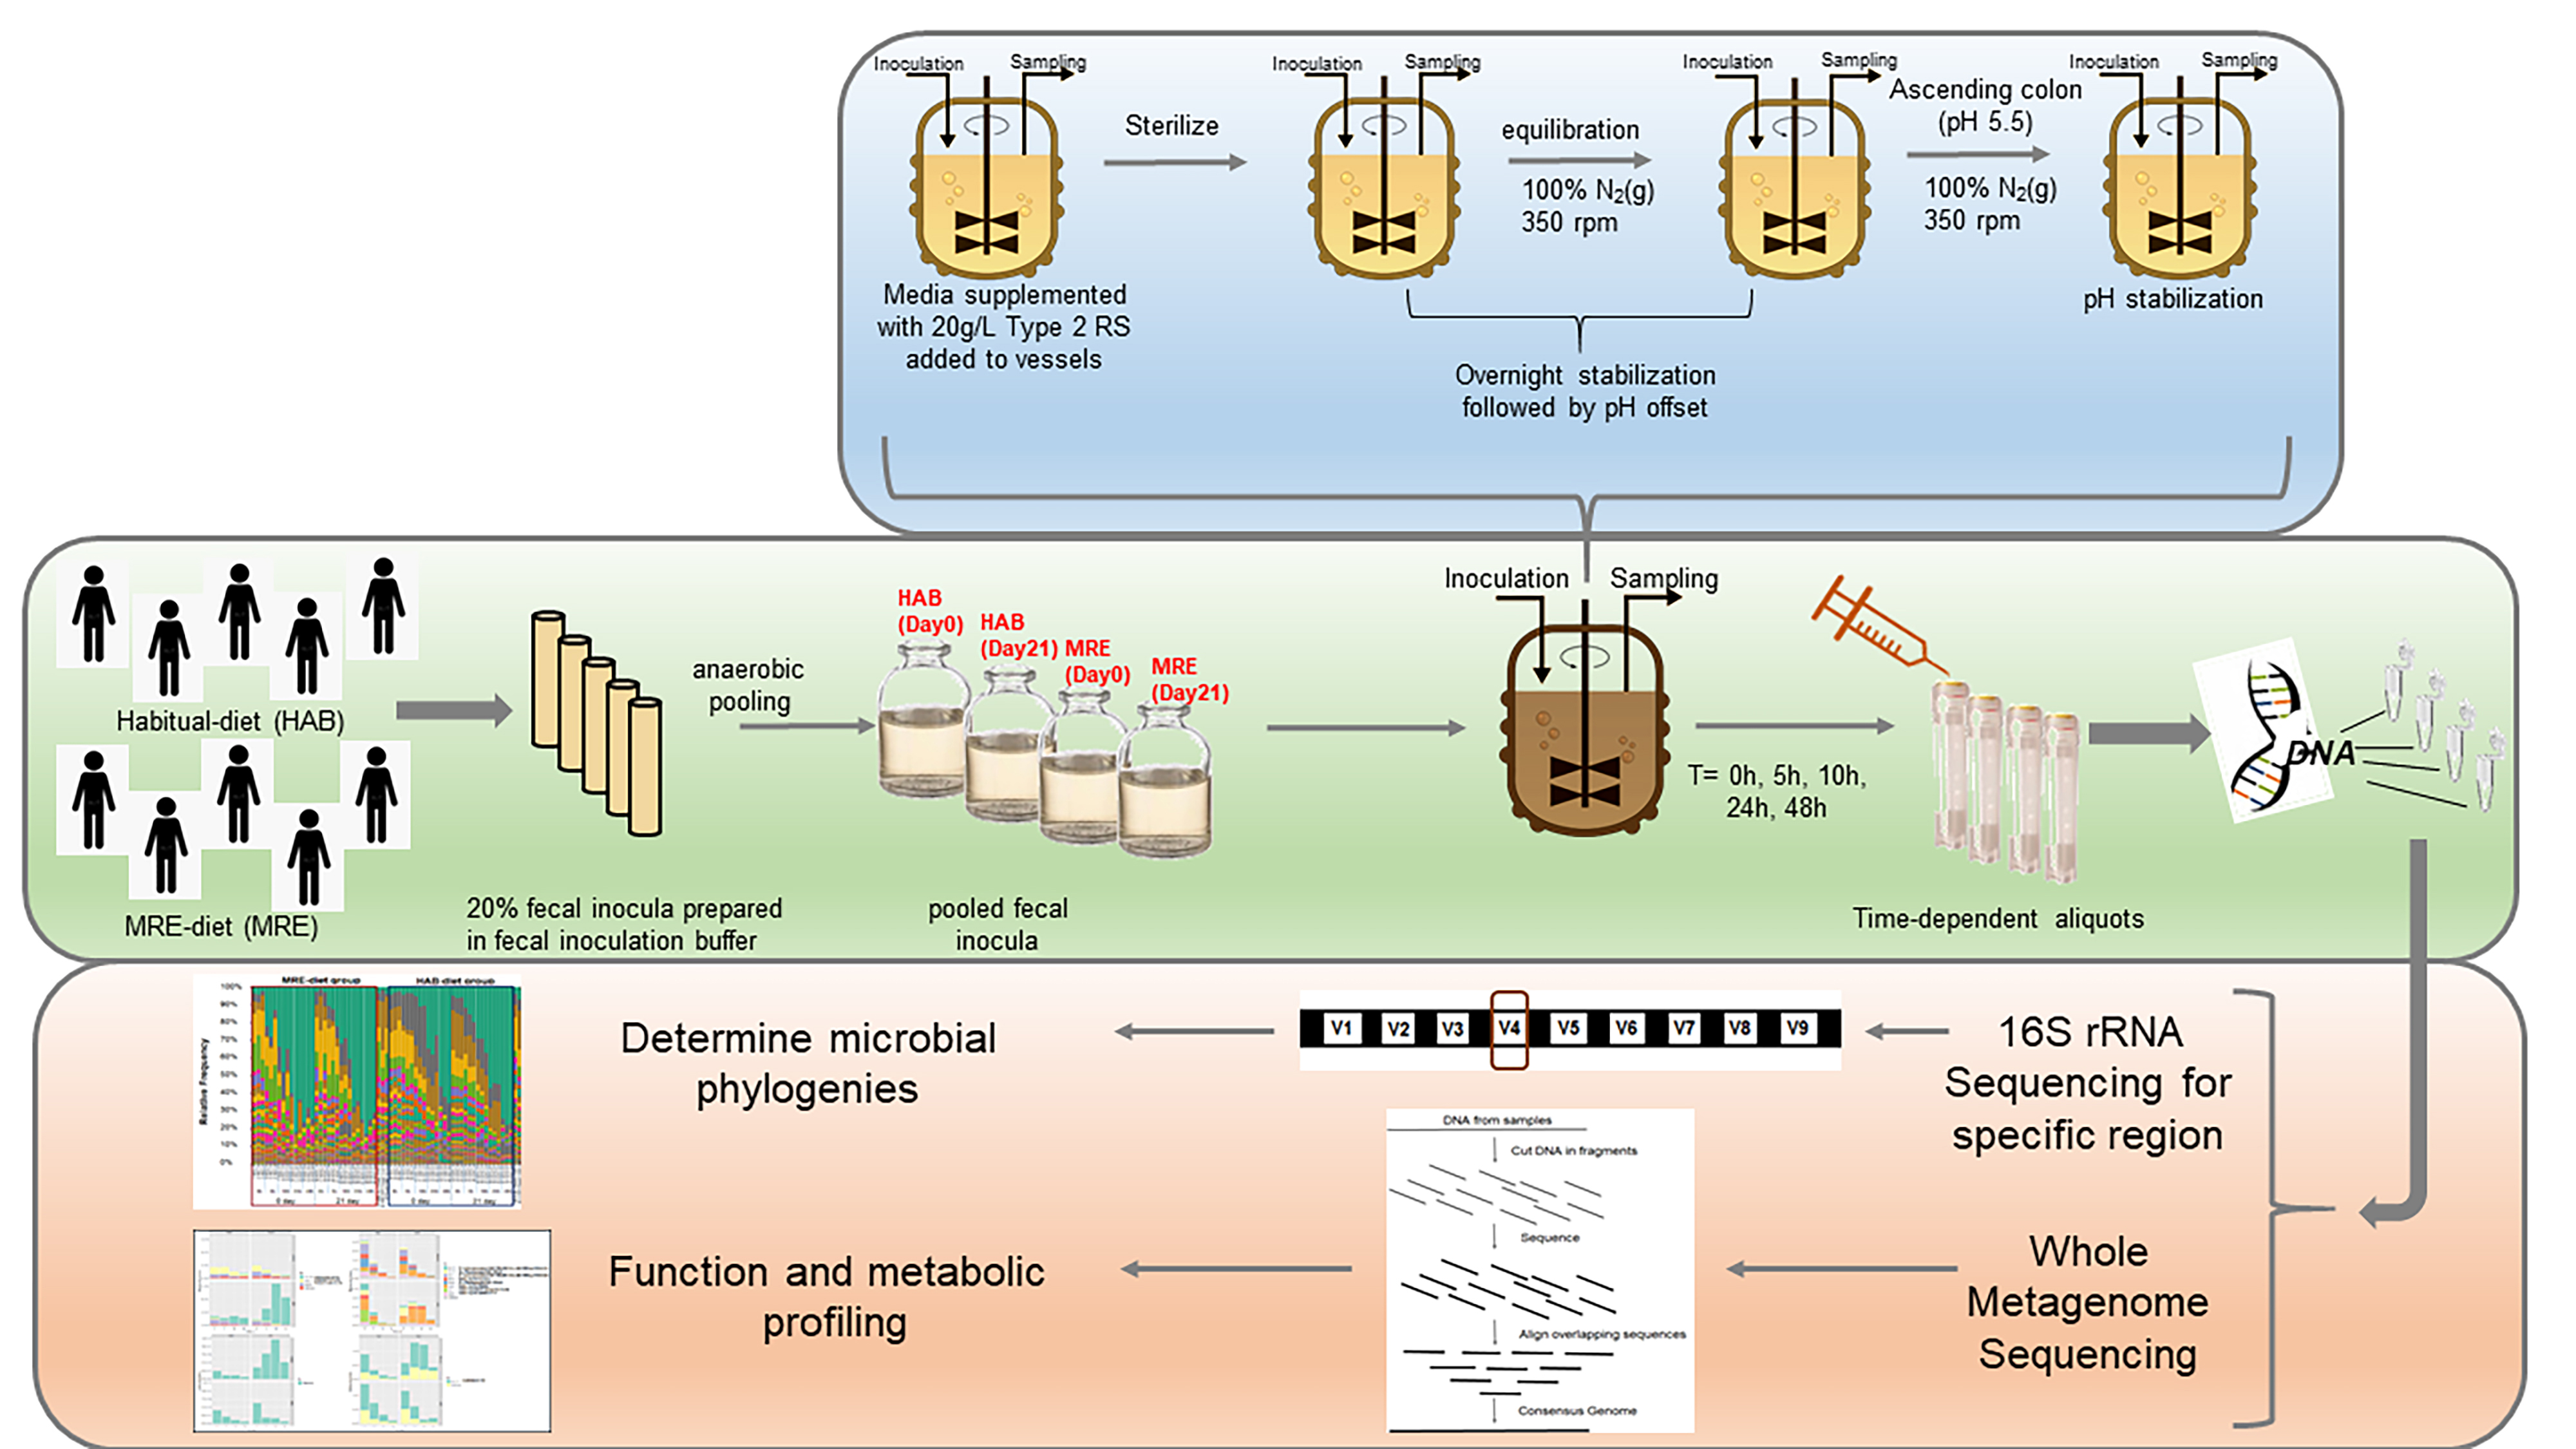
Whole genome sequencing was employed to complement 16S analyses and explore the influence of MRE-diet intervention at a functional level. We obtained a total number of raw reads of 245 357 634, including both paired reads; a total number of QC reads of 245 000 244; a mean raw reads per sample of 3 774 732; and a mean QC reads per sample of 3 769 234.
Though the diet*study day interaction only resulted in subtle alterations in community composition as assessed by 16S sequencing, genomes for strains that have nearly identical ribosomal RNA sequences have been shown to possess different functional capabilities [8]. Using the assembly free program HUMAnN2 [9], we assessed community wide function and observed similar clustering patterns as those seen with 16S. PCoA of Bray-Curtis distances in gene family abundances (Figure S5A) resulted in the first principal coordinate associating with fermentation time (PERMANOVA, R2 = 0.23, p = 0.001). The second principal coordinate was associated with diet (PERMANOVA, R2 = 0.17, p = 0.001) and there was a small effect of Diet*Date (PERMANOVA, R2 = 0.03, p = 0.001). A pathway functional level (Figure S5B), PCoA of Bray-Curtis distances in pathway abundances primarily clustered by fermentation time (PERMANOVA, R2 = 0.31, p = 0.001) with effects of Diet (PERMANOVA, R2 = 0.15, p = 0.001) and Diet*Date (PERMANOVA, R2 = 0.02, p = 0.001).
To parse whether there were finer scale differences for specific strains or functions, sequences from all samples were co-assembled, binned into metagenome assembled genomes (MAGs), and functionally annotated. After binning, we assembled 120 MAGs at >50% completion and <10% contamination including 57 MAGs at >90% completion and <5% contamination and 63 MAGs at >50% completion, <10% contamination. PCoA of Bray-Curtis distances for MAG abundances showed similar clustering by diet and fermentation residence time to the 16S PCoA (Figure S6A). The first principal coordinate was associated with fermentation time (PERMANOVA, R2 = 0.27, p = 0.001) and the second with diet (PERMANOVA, R2 = 0.23, p = 0.001). There was a small, significant effect of Diet*Date (PERMANOVA, R2 = 0.03, p = 0.001). Thus, at the MAG level, there was not a large effect of MRE diet when comparing Day 0 to Day 21.
Due to the inclusion of starch supplementation during fermentation, we assessed whether specific functions for complex carbohydrate breakdown (Carbohydrate-active enzymes, CAZymes) were affected by Diet*Date. Hidden Markov models were used to identify and classify CAZymes in the metagenome assembly. PCoA of Bray-Curtis distances for CAZyme abundances showed similar clustering patterns to the pathway PCoA (Figure S6B). The first principal component was primarily associated with fermentation time (PERMANOVA, R2 = 0.57, p = 0.001) with small effects of Diet (PERMANOVA, R2 = 0.06, p = 0.001) and Diet*Date (PERMANOVA, R2 = 0.03, p = 0.001). To uncover CAZymes which were important for classifying the Diet*Date categories, we employed Random Forests and linear mixed models (Figure 5). Four CAZymes passed the significance threshold: GH13_14 (pullulanase), GT76 (Dol-P-Man: α-1, 6-mannosyltransferase), CBM83 (starch binding), and CBM27 (mannan binding) (Table S3 and Figure 5B). Table S4 shows the p-values corresponding to the pairwise multiple comparison analysis Tukey HSD for each fermentation time point in the different groups, supporting Figure 5B. In the case of GH13_14, MRE day 21 group is significantly different from the other groups at 10 and 24 h after fermentation. GH13_14 was of particular interest because these enzymes catalyze the cleavage of branched RS2 breakdown products. MAG and taxonomic breakdown of GH13_14 by Diet*Date indicated that the increased abundance in MRE Day 21 samples was due to a Coproccocus comes MAG (Figure 6A). Another interesting case was the CAZyme GT76 and its prevalence in the MRE day 21 group associated with Lachnospira eligens (Figure 6B). Thus, the MRE diet did result in subtle functional differences at the fine-scale CAZyme level. Similar analysis was employed to find pathways that were important for differentiating Diet*Date categories, but only minor effects of Diet*Date were evident (Figure S7A, Table S5 and Figure S7B).