Alzheimer's disease (AD) is the most common cause of dementia in adulthood, followed by cognitive and behavioral deficits. Today, mesenchymal stem cell (MSC)-based therapy is a suitable therapeutic option to improve regenerative medicine approaches against neurodegenerative disorders, including AD. This study aimed to investigate the effects of human Wharton’s jelly-derived MSCs (WJ-MSCs) on Alzheimer's rat models by evaluating the expression of neurotrophic factors involved in neurodegenerative diseases, such as brain-derived neurotrophic factor (BDNF) and nerve growth factor (NGF), as well as the expression of apoptotic factors, such as B-cell lymphoma 2 (BCL2, an apoptosis inhibitor), BCL2-associated X protein (BAX, an apoptosis initiator), and caspase 3 (an apoptosis executioner). The AD rat modeling was performed by intrahippocampal injection of 8 µg/kg of amyloid β1-42 (Aβ1-42). The animals were divided into three groups of eight rats each: I) control; II) AD model; and III) MSC-treated model. Behavioral tests (i.e., passive avoidance and Morris water maze tests) showed cognitive improvements. Also, amelioration of cells in the CA1 area of the hippocampus was detected by cresyl violet (Nissl) staining. Besides, real-time polymerase chain reaction (RT-PCR) of the hippocampus indicated an increase in BDNF and NGF genes and a decrease in apoptosis-related genes (BCL2, BAX, and caspase 3). Overall, the WJ-MSCs improved the cognitive function in AD rat models by increasing neurotrophic factors and decreasing apoptotic factors.
Research Article
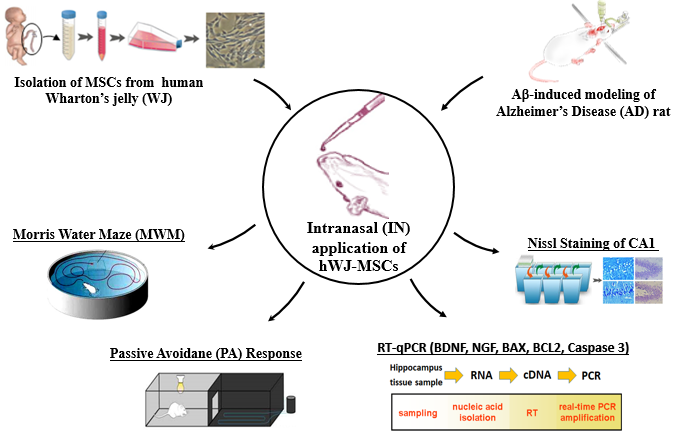
Intranasal Delivery of Human Wharton’s Jelly-Derived Mesenchymal Stem Cells Alleviates Memory Deficits In Sporadic Alzheimer’s Rat Models By Regulating Neurotrophic and Apoptotic Genes
https://doi.org/10.21203/rs.3.rs-508884/v1
This work is licensed under a CC BY 4.0 License
Version 1
posted
You are reading this latest preprint version
Alzheimer’s model
Mesenchymal stem cells
Wharton's jelly
Neurotrophic factors
Apoptotic factors
Alzheimer's disease (AD), as the most common cause of dementia in the elderly, is associated with memory loss and cognitive/behavioral dysfunctions [1]. These impairments are mainly caused by the loss of cholinergic neurons, especially in basal forebrain cholinergic neurons (BFCN), as a result of extracellular deposition of Aβ proteins (senile plaques) and intracellular formation of neurofibrillary tangles (NFTs) in the brain, especially in the hippocampus [2, 3]. It has been reported that these lesions (i.e., Aβ deposition and NFT formation) can result from a decrease in neurotrophic factors, mainly the brain-derived neurotrophic factor (BDNF) and nerve growth factor (NGF) [4], and finally lead to apoptosis and cell death [5]. Therefore, apoptosis, also known as programmed cell death, contributes to neuronal cell death in AD due to trophic factor deprivation [6].
The most important factors involved in apoptosis include the B-cell lymphoma 2 (BCL2) family (mainly anti-apoptotic BCL2 and pro-apoptotic BAX) and the caspase family (mainly caspase 3) [5, 7]. Currently, there is no definitive treatment for AD, and available treatments, such as administration of acetylcholinesterase inhibitors (AchEI), can only reduce the symptoms, with possible side effects [8, 9], which necessitate an effective treatment.
The recent mesenchymal stem cell (MSC)-based breakthroughs in preclinical experiments have been shown to be more effective in the treatment of neurodegenerative diseases [10]. MSCs are considered as the most appropriate option for the treatment of neurodegenerative diseases [13] due to their wide range of activities, including self-renewal, replenishing lost cells via differentiation into other cell lineages [11, 12], triggering neurorestorative processes, providing neuroprotection by secretion of trophic factors and anti-inflammatory cytokines, decreasing oxidative stress and apoptosis, and stimulating in situ neurogenesis [10].
Among different sources of MSCs, recently, the human umbilical cord Wharton’s jelly (WJ) has been considered in MSC-based therapies for neurodegenerative diseases [14], as they are non-invasively accessible and overexpress high levels of neurotrophic factors [15, 16]. BDNF and NGF are among the most well-known neuroregulatory factors, secreted by WJ-MSCs [16, 17]. They play an essential role in neurogenesis, synaptic plasticity, inhibition of apoptosis, immunomodulation, and cell survival [17-19]. Among various routes of cell delivery [20], intranasal (IN) administration seems to be more effective and non-invasive, since, in this route of delivery, the cells can easily bypass peripheral organs and the blood-brain barrier (BBB) and migrate along the olfactory nerve into the brain parenchyma and cerebrospinal fluid (CSF) [21, 22].
This study aimed to investigate the effects of WJ-MSCs on the cognitive status of AD rats by evaluating the levels of neurotrophic factors (BDNF and NGF) and apoptosis-related factors (BCL2, BAX, and caspase 3) after the IN administration of these cells.
Isolation of MSCs from WJ and confirmation of isolated cells
Stem cell isolation and characterization procedures were performed as described in our previous study [23]. Briefly, human umbilical cords were collected from full-term cesarean section births, the blood vessels and amniotic membrane were separated, and the remaining tissue, known as WJ, was cut into small pieces of 5 mm3. Next, they were transferred into a sterile centrifuge tube containing collagenase type I (300 U/mL) and hyaluronidase (1 mg/mL) enzymes for the first enzymatic digestion in an incubator (37oC in 5% CO2) for one hour. After filtering the lysed solution with a 70-μm cell strainer and centrifuging at 300 g for five minutes, the remaining tissue was transferred to another centrifuge tube, containing 0.1% trypsin enzyme (Sigma-Aldrich, St. Louis, MO, USA) for the second enzymatic digestion for 30 minutes. Next, it was filtered and centrifuged again. Both cell pellets derived from two enzymatic digestion steps were mixed, suspended, and cultured in a complete culture medium, including Dulbecco’s Modified Eagle’s Medium (DMEM; Gibco, Billings, USA), containing 10% fetal bovine serum (FBS; Sigma, Missouri, USA) and 1% penicillin-streptomycin solution (Invitrogen, Waltham, USA) for expansion. The viability of isolated cells was assessed by the trypan blue exclusion method, using 0.4% trypan blue dye (Sigma-Aldrich, St. Louis, MO, USA).
Flow cytometry: To quantitatively detect the mesenchymal CD markers in WJ-isolated cells, passage 3 cells were incubated with monoclonal mouse anti-human antibodies against mesenchymal markers (CD105 and CD73) as positive markers and hematopoietic markers (CD45 and CD34) as negative markers, followed by 10 mg/mL of fluorescein isothiocyanate (FITC)–conjugated anti-mouse immunoglobulin G (IgG) antibodies (Abcam, Cambridge, UK) for one hour at room temperature (RT). Also, a fluorescence-activated cell sorting (FACS) analyzer (Becton, Dickinson, Franklin Lakes, NJ, USA) and FlowJo software were used for antibody binding analysis and data analysis, respectively.
Immunocytochemistry (ICC): To qualitatively confirm the mesenchymal CD markers on WJ-isolated cells, passage 3 cells were incubated with primary anti-human nuclei antibodies against mesenchymal markers (CD105 and CD73), hematopoietic marker (CD31 as a negative marker), and neuronal marker (β-tubulin III as a negative marker). The coverslips were mounted and observed under a Nikon Eclipse TE300 inverted microscope (Spectra Services, Ontario, NY, USA), and images were acquired by a charge-coupled device (CCD) camera, connected to a microscope.
Osteogenic and adipogenic differentiation: The passage 3 cells were incubated in two differentiation media, that is, an osteogenic induction medium (DMEM‐LG+10% FBS, 50 μg/mL of ascorbic acid 2-phosphate, 10−8 M dexamethasone, and 10 mM β‐glycerophosphate; Invitrogen, Waltham, USA) for 14 days and an adipogenic differentiation medium (DMEM+1 g/mL of glucose [DMEM‐LG], 10% FBS, 50 μg/mL of ascorbate 1 phosphate, 10−7 M dexamethasone, and 50 μg/mL of indomethacin; Invitrogen, Waltham, USA) for 21 days. The media in both cell types were changed every three days, and completion of cell differentiation was established by morphology and staining (i.e., Alizarin Red S for osteocytes and Oil Red O for adipocytes; Sigma, Missouri, USA).
AD modeling and IN administration of WJ-MSCs
Adult 220–260 g male Wistar rats were obtained from IUMS animal lab and AD modeling was performed as described in our previous study [23]. Briefly, rats were anesthetized using ketamine/xylazine (50/4 mg/kg, i.p), and fixed in the stereotaxic device. After exposing the skull, freshly prepared amyloid β 1–42 (Sigma, 8 µg/kg of Aβ1–42 in 16 μl PBS) was administered using a hamilton microsyringe during 3 min into the dorsal hippocampus bilaterally according to Paxinos rat brain atlas (coordinates: 3.6 mm posterior, ± 2 mm lateral to the bregma, and 3.2 mm ventral to the skull surface).
The rats were randomly divided into 3 groups (n=8 in each group) as follows: i) control group (vehicle [PBS]-treated rats), ii) AD model group (Aβ-treated rats), and iii) MSC-treated group (AD models those which treated with IN administration of WJ-MSCs).
IN-administration of WJ-MSCs was performed on day 14 after AD induction as previously described [21, 24]. Briefly, animals anesthetized and immobilized facing upward. First, 100U hyaluronidase was freshly dissolved in sterile PBS (4 U/μl) and 3 μl of the suspension administered in each nostril using a pipette, which was repeated 4 times up to almost 100U of hyaluronidase suspension. Next, after keeping treated rats facing upward for 30 min, 3 ×10⁵ WJ-MSCs/rat was suspended in 36 μl PBS and administered 6 μl/nostril. After 30 s, that the sample drops were completely disappeared the administration with a 2 min interval repeated 3 times.
Behavioral assessments
Two months after cell therapy, to evaluate the effect of WJ-MSCs on spatial learning and memory, two tests, including passive avoidance (PA) response and Morris water maze (MWM), were conducted:
PA response: This test was performed using a shuttle box device with two connected equal-sized chambers, separated by a guillotine door, as previously described [25]. First, a habituation trial was performed to familiarize all animals with the apparatus without any stimuli. Next, for the acquisition trial, the animals in all groups were guided individually into the illuminated chamber for ten seconds, and the guillotine door was opened to determine the latency to enter the dark chamber as the initial latency (IL). Once the animal entered the dark chamber, its feet were exposed to electrical stimulation (0.5 mA, 50 Hz, 2 sec) through a stainless steel floor. Finally, after 24 hours, for the retention trial, the rats re-entered the light chamber without any foot shock to record latency to enter the dark chamber as retention time (step through latency [STL]). The total time spent by the rat in the dark chamber (time spent in the dark chamber) was also recorded as an indicator of contextual learning. The maximum cutoff time for STL and the time spent in the dark chamber was 300 and 600 seconds, respectively. If a rat avoided entering the dark chamber for up to 300 seconds, the acquisition of PA response was considered successful.
MWM test: Spatial reference learning and memory were evaluated in the water maze task as previously described [26, 27]. This test was performed over six days using a circular water tank (22°C), which was divided into four imaginary quadrants with a platform inside and a camera above the tank, as previously described [28, 29]. The MWM test included three phases: (1) habituation phase on the first day with an apparent platform in the center of the tank; (2) acquisition phase in which the learning goals were achieved on days 2-5 with a hidden platform in one of the quadrants (each day for four trials, with each trial lasting 60 seconds); and (3) the probe trial phase on day six without a platform in which the time spent and the distance traveled in the target quadrant (the platform was situated in the acquisition phase) were measured as two criteria for spatial memory.
Histological assessments
RNA extraction and real-time quantitative reverse transcription-polymerase chain reaction (RT-qPCR): Total RNA from the hippocampus was extracted and purified with a TRIzol™ reagent (Sigma, Pool, UK), according to the manufacturer's instructions, and its concentration was measured with a NanoDrop ND-100 spectrophotometer. The RT-qPCR assay was employed to quantify the gene expression levels of neurotrophic factors (BDNF and NGF) and apoptosis-related factors (BCL2, BAX, and caspase 3) in the AD rat hippocampus after treatment with WJ-MSCs. For this purpose, 500 ng of RNA was reverse-transcribed into complementary DNA (cDNA) with the Transcriptor High-Fidelity cDNA Synthesis Kit (Invitrogen, Paisley, UK), using oligo(dT) primers (Roche, Germany). Next, 1 µL of cDNA was amplified using Opticon II (Invitrogen, Paisley, UK) and SYBR Green PCR Master Mix (Invitrogen, Paisley, UK), based on the manufacturer's instructions.
The PCR assay was performed in 40 cycles at an annealing temperature of 60°C for all genes. The primers used in this study were specifically designed between two adjacent exons in the Gene Runner program, and the sequences are listed in Table 2. The mRNA levels for target genes were normalized to the reference gene (β-actin) by subtracting the cycle threshold (Ct) of the reference gene (β-actin) from the Ct value of the samples (ΔCt= Ctsample - Ctreference). The relative expression of the calibrator target gene was quantified using the 2-ΔΔCt method.
Cresyl violet (Nissl) staining: Two months after cell therapy, this test was performed to distinguish healthy neurons from damaged neurons in the cornu ammonis-1 (CA1) area of rats’ hippocampus [30]. Briefly, the samples were fixed, 7μm coronal sections (5 sections) were taken from -3.84 to -5.8 from Bregma, the sections were transported to gelatinized slides and stained with cresyl violet stain. An optical microscope (Carl Zeiss; Oberkochen, Germany) was used to take images from stained slides.
Statistical analysis
The data were normalized and analyzed using one-way ANOVA followed by Tukey post hoc test to determine the statistical significance between different groups using SPSS software version 24 (SPSS Inc., Chicago, IL, USA). Also, analysis of PA response data was analyzed by paired t-test, and a significant level between groups was determined by one-way ANOVA. All results were considered significant at P < 0.05 and expressed as mean ± SEM. Image analysis was done using ImageJ software.
WJ-MSCs
Adherent stem cells were isolated from WJ of the human umbilical cord with a viability of >95%, indicating a spindle-shaped morphology (Figure 1a). The ability to differentiate toward osteocytes by producing calcium nodules (Figure 1b) and toward adipocytes by producing lipid droplets (Figure 1c), which is one of the important characteristics of MSCs, confirmed that the WJ-MCs were mesenchymal cells. The flow cytometry indicated that these cells strongly expressed mesenchymal markers, CD105 and CD73, but did not noticeably express hematopoietic markers, CD34 and CD45 (Figure 2a and Table 1). The ICC showed that the WJ-MSCs were significantly positive for mesenchymal markers, CD105 and CD73, and negative for hematopoietic and neuronal markers (CD31 and β-tubulin III, respectively) (Figure 2b).
IN-delivered WJ-MSCs alleviated memory deficits in Alzheimer’s rat models
PA response: The step-through PA test indicated very short and almost similar IL in entering the dark chamber before applying electric shock in all animal groups (Figure 3a). After applying an electric shock, first, STL was significantly lower in the AD group as compared to the control group (*P<0.05; Figure 3a); however, it was significantly higher in the MSC-treated group as compared to the AD group (#P<0.05; Figure 3a). The time spent in the dark chamber was significantly longer in the AD group as compared to the control group (*P<0.05; Figure 3b), while it was significantly shorter in the MSC-treated group compared to the AD group (#P<0.05; Figure 3b).
MWM test: Both the time spent (Figure 3c) and the distance travelled (Figure 3d) in the target quadrant on the probe trial test were significantly lower in the AD group as compared to the control group (*P<0.05). These parameters were significantly higher in the MSC-treated group as compared to the AD group (#P<0.05).
Gene expression in the hippocampus
The mean mRNA levels of neurotrophic factors (BDNF and NGF) and anti-apoptotic factor (BCL2) in the AD model group were significantly lower than the control group (Figure 4; *P<0.05). After two months of treatment with the WJ-MSCs in the MSC-treated group, the mRNA level of these genes (i.e., BDNF, NGF, and BCL2) significantly increased as compared to the AD group (#P<0.05). Considering the apoptotic factors (BAX and caspase 3), the mean mRNA level was significantly higher in the AD group as compared to the control group (Figure 4; *P<0.05), while it significantly decreased in the MSC-treated group as compared to the AD group (Figure 4; #P<0.05).
Nissl-stained cells decreased following the IN delivery of WJ-MSCs
Figure 5a shows the Nissl-stained images of the CA1 area, where the number of dark cells (cells with a cell body shrinkage) was significantly higher in the AD group as compared to the control and MSC-treated groups. The quantitative analysis showed a significantly higher level of dark cells in the AD group as compared to the control group. However, a low level of dark cells was detected in the treatment group compared to the AD group (Figure 5b; #P<0.05).
Neurodegeneration and apoptosis play a key role in memory and learning deficits [31, 32]. In this study, IN-administered human WJ-MSCs in Alzheimer’s rat models effectively improved the behavioral and cognitive performance by improving the memory and learning capabilities. This finding was assessed by measuring the levels of trophic factors and apoptosis-related factors in the hippocampus. In agreement with previous studies [24, 33], the IN route of MSC delivery to the brain was more effective in the present study. In this regard, Danielyan et al. examined the possible routes of IN-administered cells and hypothesized that these cells could bypass the BBB by migrating from the nasal mucosa through the cribriform plate along the olfactory neural pathway into the brain and CSF [21].
Regarding the trophic factors, the WJ-MSCs effectively enhanced the trophic support by increasing the mRNA levels of BDNF and NGF in the hippocampus, leading to an improved cognitive performance on MWM and PA response tests. Similarly, other studies demonstrated that these trophic factors were essential to neural survival. A clinical trial of NGF gene therapy in AD patients found these factors to be useful in preventing cognitive decline [34]. Recently, it has been reported that IN-delivered BMSCs in PD mice could successfully migrate into the hippocampus, olfactory bulb, substantia nigra, striatum, and lateral ventricle and enhance the BDNF level in these areas, resulting in the survival of existing dopaminergic neurons and finally, functional and motor improvements [22]. Also, in the aforementioned study, after IN administration of BMSCs, the expression of Nestin, a neuronal precursor cell marker, was increased in the subventricular zone (SVZ), indicating the stimulation of endogenous neurogenesis [22].
Moreover, it has been reported that application of fetal human neural stem cells (hNSCs) in the brain of transgenic mice could excrete high levels of neurotrophic factors, including BDNF and NGF, and activate the Akt/GSK3β signaling pathway, resulting in the prevention of tau phosphorylation, attenuation of Aβ synaptotoxicity, promotion of synaptic plasticity, and therefore, enhanced spatial memory [35]. In a previous study, although NSC transplantation in a transgenic model of AD had no significant effects on either Aβ or tau, it led to cognitive improvements by elevation of BDNF level and increasing the hippocampal synaptic density [36].
Regarding apoptosis, evidence suggests that apoptosis in the temporal cortex and hippocampus of AD patients [37], as well as dying neural cells in the brains of AD patients, is associated with increased caspase 3 and caspase 6 levels [38]. The current study demonstrated that WJ-MSCs suppressed apoptosis in Aβ-induced AD rat models by enhancing the expression of anti-apoptotic factor (BCL2) and suppressing the expression of apoptotic factors (BAX and caspase 3). Besides its neurotrophic activity, BDNF can induce multiple neuroprotective mechanisms, including anti-apoptosis (by expression of anti-apoptotic BCL2 proteins), anti-oxidation (by expression of antioxidative thioredoxins), and suppression of autophagy and neuronal death in neurodegenerative diseases [39]. In another study, a substantial decrease in the level of active caspase 3 was found in the brains of hNSC-injected transgenic mice, indicating the interference of hNSCs in the prevention of cell death [35]. Beyond apoptosis, inhibition of caspase 3 also effectively blocked the microglia activation and neuroinflammation, which are common in neurodegenerative diseases, including AD and Parkinson’s disease [40].
Neurotrophic factors play an essential role in neuron survival, and alterations in their expression levels seem to lead to the progression of apoptosis and neurodegeneration. Among new drug delivery and gene therapy approaches, MSC-based cell therapy can be considered as the main therapeutic tool since MSCs (secretion of neurotrophic factors) can play a supporting role by secretion of necessary trophic factors, according to the needs of the target organ. The results of this study showed that IN delivery of human WJ-MSCs in AD rat models could significantly improve learning and memory by enhancing the trophic support and suppressing apoptosis. Neurotrophic support of cholinergic neurons could result from the increased levels of BDNF and NGF in the hippocampus. Also, the increased level of anti-apoptotic factor (BCL2), besides the decreased levels of apoptotic factors (BAX and caspase 3) in the hippocampus, indicated suppressed apoptosis in WJ-MSC-treated AD rat models.
AD: Alzheimer’s disease, MSCs; mesenchymal stem cells, WJ-MSCs: Wharton’s jelly-derived MSCs, dex-SPIONs: dextran-coated superparamagnetic iron oxide nanoparticles, MTCD: magnetic targeting cell delivery, MRI: Magnetic resonance imaging, ChAT: choline acetyltransferase, AChE: acetylcholinesterase, IL: initial latency, MWM: Morris Water Maze, DMEM: Dulbecco's modified Eagle's medium ,FBS: fetal bovine serum, DLS: dynamic light scattering, BBB: blood brain barrier, TR: Repetition time , FOV: Field of View ,WT :Wild type, IV; intravenous, IV-TC: IV -targeted cells , ICV: intracerebroventricular
Funding: This work was supported by grants from Iran University of Medical Sciences (IUMS) (97-4-75-13504) and Iran National Science Foundation (INSF).
Conflict of interest/Competing interests: None.
Availability of data and materials: The datasets used and/or analyzed during the current study are available from the corresponding author on reasonable request.
Code Availability: Not applicable.
Authors’ Contributions: FQH, EE, MS, MA, RSH, and MM collaboratively conducted the experiments, carried out the data analysis, designed the experiments, and wrote the manuscript. All authors read and approved the final manuscript.
Ethics approval and consent to participate: All procedures performed in this study were in accordance with the ethical standards of the institutional research ethics committee and with the 1964 Helsinki declaration and its later amendments or comparable ethical standards. Informed consent was obtained from all individual participants included in the study. All procedures performed on animals were in accordance with the ethical standards of the IUMS (IR.iums.rec.1397.1299).
Consent for Publication: Not applicable.
Acknowledgments
This work was supported by grants from the IUMS (97-4-75-13504) and Iran National Science Foundation (INSF) for a Master’s dissertation. Experiments were performed at the Cellular and Molecular Research Center (CMRC) and IUMS Core Laboratory (ICL), Tehran, Iran.
- Madadi, S. and M. Mehdizaded, Alzheimer diseases. Avicenna Journal of Neuro Psych Physiology, 2014. 1(2). http://dx.doi.org/10.17795/ajnpp-19713
- Barati, E., et al., Effect of Borage on hipocampal TNF-α protein and gene in the Amyloid β-Peptide (25–35)-Induced of Alzheimer model in rat. Biosciences Biotechnology Research Asia, 2016. 13(1): p. 37-42. http://dx.doi.org/10.13005/bbra/2000
- Jahanshahi, M., et al., Female rat hippocampal cell density after conditioned place preference. Folia Biologica (Czech Republic), 2014. 60(1): p. 47-51.
- Sampaio, T.B., et al., Neurotrophic factors in Alzheimer's and Parkinson's diseases: implications for pathogenesis and therapy. Neural regeneration research, 2017. 12(4): p. 549. http://dx.doi.org/10.4103/1673-5374.205084
- Radi, E., et al., Apoptosis and oxidative stress in neurodegenerative diseases. Journal of Alzheimer's disease, 2014. 42(s3): p. S125-S152. http://dx.doi.org/10.3233/JAD-132738
- Dragunow, Μ., et al., Apoptosis, neurotrophic factors and neurodegeneration. Reviews in the Neurosciences, 1997. 8(3-4): p. 223-265. http://dx.doi.org/10.1515/revneuro.1997.8.3-4.223
- Shaabani, R., et al., Effect of morphine based CPP on the hippocampal astrocytes of male Wistar rats. Asian Journal of Cell Biology, 2011. 6(3): p. 89-96. http://dx.doi.org/10.3923/ajcb.2011.89.96
- Joyce, N., et al., Mesenchymal stem cells for the treatment of neurodegenerative disease. Regenerative medicine, 2010. 5(6): p. 933-946. http://dx.doi.org/10.2217/rme.10.72
- Aisen, P.S., J. Cummings, and L.S. Schneider, Symptomatic and nonamyloid/tau based pharmacologic treatment for Alzheimer disease. Cold Spring Harbor perspectives in medicine, 2012. 2(3): p. a006395. http://dx.doi.org/10.1101/cshperspect.a006395
- Alipour, M., et al., Stem cell therapy in Alzheimer’s disease: possible benefits and limiting drawbacks. Molecular biology reports, 2019. 46(1): p. 1425-1446. http://dx.doi.org/10.1007/s11033-018-4499-7
- Kolf, C.M., E. Cho, and R.S. Tuan, Mesenchymal stromal cells: biology of adult mesenchymal stem cells: regulation of niche, self-renewal and differentiation. Arthritis research & therapy, 2007. 9(1): p. 204. http://dx.doi.org/10.1186/ar2116
- Yang, H., et al., Concise Review: The Regulatory Mechanism of Lysine Acetylation in Mesenchymal Stem Cell Differentiation. Stem Cells International, 2020. 2020. https://doi.org/10.1155/2020/7618506
- Lo Furno, D., G. Mannino, and R. Giuffrida, Functional role of mesenchymal stem cells in the treatment of chronic neurodegenerative diseases. Journal of cellular physiology, 2018. 233(5): p. 3982-3999. http://dx.doi.org/10.1002/jcp.26192
- Lee, N.K., et al., Agouti related peptide secreted via human mesenchymal stem cells upregulates proteasome activity in an Alzheimer’s disease model. Scientific reports, 2017. 7(1): p. 1-9. http://dx.doi.org/10.1038/srep39340
- Donders, R., et al., Human Wharton's Jelly-Derived Stem Cells Display a Distinct Immunomodulatory and Proregenerative Transcriptional Signature Compared to Bone Marrow-Derived Stem Cells. Stem cells and development, 2018. 27(2): p. 65-84. http://dx.doi.org/10.1089/scd.20170029
- Ribeiro, C.A., et al., The secretome of stem cells isolated from the adipose tissue and Wharton jelly acts differently on central nervous system derived cell populations. Stem cell research & therapy, 2012. 3(3): p. 18. https://doi.org/10.1155/2014/438352
- Hsieh, J.-Y., et al., Mesenchymal stem cells from human umbilical cord express preferentially secreted factors related to neuroprotection, neurogenesis, and angiogenesis. PloS one, 2013. 8(8). https://doi.org/10.1371/journal.pone.0072604
- Mattson, M.P., S. Maudsley, and B. Martin, BDNF and 5-HT: a dynamic duo in age-related neuronal plasticity and neurodegenerative disorders. Trends in neurosciences, 2004. 27(10): p. 589-594. https://doi.org/10.1016/j.tins.2004.08.001
- Teixeira, F.G., et al., Mesenchymal stem cells secretome: a new paradigm for central nervous system regeneration? Cellular and Molecular Life Sciences, 2013. 70(20): p. 3871-3882. https://doi.org/10.1007/s00018-013-1290-8
- Park, S.E., et al., Optimal mesenchymal stem cell delivery routes to enhance neurogenesis for the treatment of Alzheimer’s disease. Histology and histopathology: cellular and molecular biology, 2018. 33(6): p. 533-541. https://doi.org/10.14670/HH-11-950
- Danielyan, L., et al., Intranasal delivery of cells to the brain. European journal of cell biology, 2009. 88(6): p. 315-324. https://doi.org/10.1016/jejcb.2009.02.001
- Tang, Y., et al., Intranasal Delivery of Bone Marrow Stromal Cells Preconditioned with Fasudil to Treat a Mouse Model of Parkinson’s Disease. Neuropsychiatric Disease and Treatment, 2020. 16: p. 249. https://doi.org/10.2147/NDT.S238646
- Hour, F.Q., et al., Magnetic targeted delivery of the SPIONs-labeled mesenchymal stem cells derived from human Wharton's jelly in Alzheimer's rat models. Journal of Controlled Release, 2020. https://doi.org/10.1016/j.jconrel.2020.02.035
- Shahror, R.A., et al., Tracking Superparamagnetic Iron Oxide-labeled Mesenchymal Stem Cells using MRI after Intranasal Delivery in a Traumatic Brain Injury Murine Model. JoVE (Journal of Visualized Experiments), 2019(153): p. e60450. https://doi.org/10.3791/60450.
- Vafaee, F., et al., Effect of Recombinant Insulin-like Growth Factor-2 Injected into the Hippocampus on Memory Impairment Following Hippocampal Intracerebral Hemorrhage in Rats. Galen Medical Journal, 2018. 7: p. 1353. https://doi.org/10.22086/gmj.v0i0.1353
- Morris, R.G., et al., Place navigation impaired in rats with hippocampal lesions. Nature, 1982. 297(5868): p. 681-683. https://doi.org/10.1038/297681a0
- Mehdizadeh, M., et al., Protective effects of cyperus rotundus extract on amyloid β-peptide (1-40)-induced memory impairment in male rats: a behavioral study. Basic and clinical neuroscience, 2017. 8(3): p. 249. https://doi.org/10.18869/nirp.bcn.8.3.249
- Morris, R., Developments of a water-maze procedure for studying spatial learning in the rat. Journal of neuroscience methods, 1984. 11(1): p. 47-60. https://doi.org/10.1016/0165-0270(84)90007-4
- Tamtaji, O.R., et al., Protective Effects of Red Onion (Allium cepa) Ethanolic Extract on Learning and Memory Impairments in Animal Models of Diabetes. Galen Medical Journal, 2017. 6(3): p. 249-257. https://doi.org/10.22086/gmj.v6i3.909
- Faghani, M., et al., The Neuroprotective Effect of Atorvastatin on Apoptosis of Hippocampus Following Transient Global Ischemia/Reperfusion. Galen Medical Journal, 2016. 5(2): p. 82-89.
- Wozniak, D.F., et al., Apoptotic neurodegeneration induced by ethanol in neonatal mice is associated with profound learning/memory deficits in juveniles followed by progressive functional recovery in adults. Neurobiology of disease, 2004. 17(3): p. 403-414. https://doi.org/10.1016/j.nbd.2004.08.006
- Mattson, M.P., Apoptosis in neurodegenerative disorders. Nature reviews Molecular cell biology, 2000. 1(2): p. 120-130. https://doi.org/10.1038/35040009
- Beigi Boroujeni, F., et al., Intranasal delivery of SDF‐1α‐preconditioned bone marrow mesenchymal cells improves remyelination in the cuprizone‐induced mouse model of multiple sclerosis. Cell biology international, 2020. 44(2): p. 499-511. https://doi.org/10.1002/cbin.11250
- Tuszynski, M.H., et al., A phase 1 clinical trial of nerve growth factor gene therapy for Alzheimer disease. Nature medicine, 2005. 11(5): p. 551-555. https://doi.org/10.1038/nm1239
- Lee, I.-S., et al., Human neural stem cells alleviate Alzheimer-like pathology in a mouse model. Molecular neurodegeneration, 2015. 10(1): p. 38. https://doi.org/10.1186/s13024-015-0035-6
- Blurton-Jones, M., et al., Neural stem cells improve cognition via BDNF in a transgenic model of Alzheimer disease. Proceedings of the National Academy of Sciences, 2009. 106(32): p. 13594-13599. https://doi.org/10.1073/pnas.0901402106
- Dragunow, M., et al., In situevidence for DNA fragmentation in Huntington's disease striatum and Alzheimer's disease temporal lobes. Neuroreport, 1995. 6(7): p. 1053-1057. https://doi.org/10.1097/00001756-199505090-00026
- Deigner, H.-P., U. Haberkorn, and R. Kinscherf, Apoptosis modulators in the therapy of neurodegenerative diseases. Expert opinion on investigational drugs, 2000. 9(4): p. 747-764. https://doi.org/10.1517/13543784.9.4.747
- Chen, S.-D., et al., More insight into BDNF against neurodegeneration: anti-apoptosis, anti-oxidation, and suppression of autophagy. International journal of molecular sciences, 2017. 18(3): p. 545. https://doi.org/10.3390/ijms18030545
- D’Amelio, M., M. Sheng, and F. Cecconi, Caspase-3 in the central nervous system: beyond apoptosis. Trends in neurosciences, 2012. 35(11): p. 700-709. https://doi.org/10.1016/j.tins.2012.06.004
Table1 Flow cytometry analysis of Wharton's jelly-derived stem cells. WJ cells strongly expressed mesenchymal markers CD105 and CD73 and weakly expressed hematopoietic markers CD34 and CD45

Table2 Sequence of specific primers used for quantitative real-time revers transcription PCR
