Study population
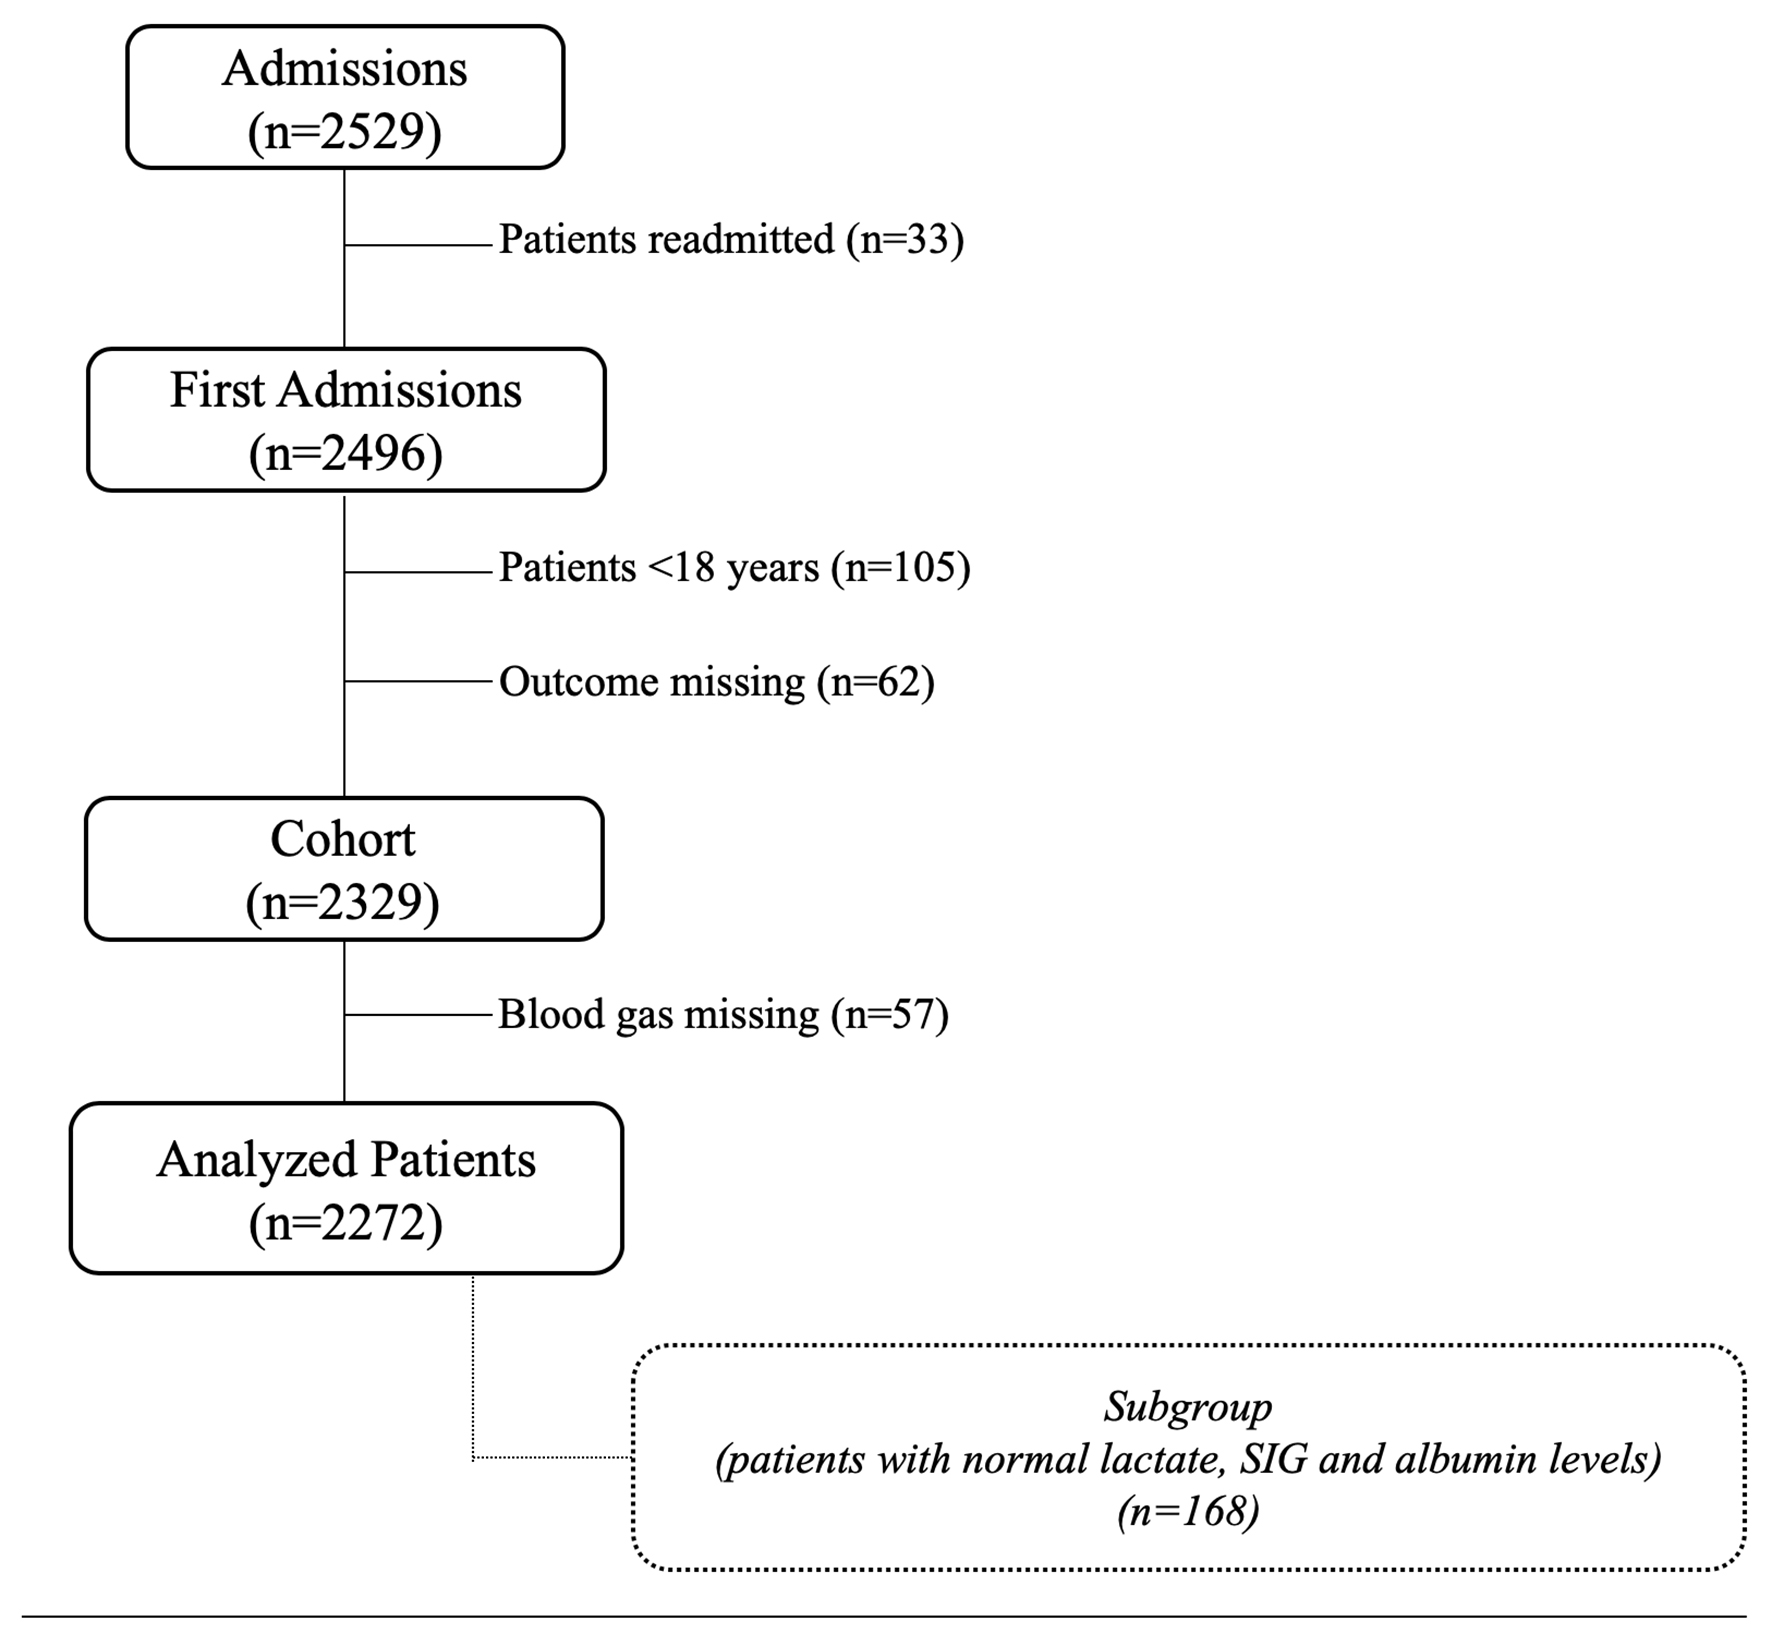
After receiving approval from the Acıbadem University Medical Research Assessment Council (ATADEK, 2016–18/1), 2529 patients who were admitted to the tertiary intensive care unit (ICU) in Acıbadem International Hospital were retrospectively evaluated between January 1st, 2011, and January 1st, 2018. Patients who were under 18 years old, readmitted or had missing blood gas parameters and outcomes were excluded (Fig. S1 in the Supplementary Appendix).
Database
Patient demographic and laboratory data were collected from the Acıbadem Health Group Database. ABL 800 (Radiometer, Denmark, Copenhagen), which employs an ion-selective electrode, was used for blood gas analysis. At ICU admission, demographic data (age, sex), diagnosis (medical, elective and emergency surgeries), Acute Physiology And Chronic Health Evaluation II (APACHE II) score, pH, PaCO2 (mmHg), Na (mmol/L), K (mmol/L), Ca (mmol/L), Cl (mmol/L), HCO3 (mmol/L), standard base excess (SBE) (mmol/L), apparent strong ion difference (SIDa) (mmol/L), effective strong ion difference (SIDe) (mmol/L), strong ion gap (SIG) (mmol/L), BECl (mmol/L), serum lactate (mmol/L), albumin (g/L) and outcomes were recorded.
Normal values for Na and Cl (Nan and Cln) and calculations
For the first approach that only Clobs levels are used, Cln ranges were accepted as 98–106 mmol/L [6]. For the Cldef/exc, Nan and Cln were 142 mmol/L and 104–108 mmol/L respectively whereas they were 140 mmol/L and 102 mmol/L for the Clmod. While there are no Nan and Cln for the BECl and Cl/Na ratio, normal values of BECl and Cl/Na ratio were zero and 0.75–0.80 respectively[2–4,6]. All formulations and evaluations are detailed for all Cl approaches in Table 1.
SIDa, SIDe, SIG, Cldef/exc, Clmod and BECl were calculated as follows:[9]
SIDa = (Na + K + Ca)—(Cl + lactate)
SIDe = (2.46 x 10⁻⁸ x (PaCO2/10-pH)) + (albumin in g/L x (0.123 x pH—0.631)
SIG = SIDa - SIDe
Cldef/exc = Cln - (Clobs x (Nan / Naobs)), [Nan = 142, Cln = 104–108]
Clmod = Cln - (Clobs x (Nan / Naobs)), [Nan = 140, Cln = 102]
BECl = (Naobs - Clobs - 32 mmol/L)
To detect only the effect of Cl on the acid-base status, a subgroup that included patients with normal lactate (≤1.6 mmol/L), albumin (≥35 gl/L, the lowest value of normal laboratory limits) and SIG (0–2 mmol/L) values was created [3,9].
Statistical analysis
All data were analysed by using SPSS version 26. The Kolmogorov-Smirnov test was used to detect normal distributions. The data were presented as percentages or medians (minimum-maximum). The effects of chloride on the acid-base status according to the different approaches were validated by the SBE and SIDa. The agreement between each pair of approaches was analysed with the Kappa test. The Pearson correlation was used for all correlations. For all patients, Clobs, Cldef/exc, Clmod, Naobs, Cl/Na ratio, K, Ca, BECl, albumin, lactate, SIG and PaCO2 were added to the multivariate linear regression models to determine their relationship with the SBE. In the subgroup, the Bland & Altman test was used to determine the limits of agreement between SBE and each of Clmod, Cldef/exc and BECl. Acceptable agreement was a bias of up to ±1 mmol/L and the limits of agreement were less than ±1.96 mmol/L. A p-value <0.05 was considered statistically significant.