Organic phase change materials (PCMs) have been widely applied in thermal energy storage fields due to their good structural stability, high energy storage density, adjustable phase change temperature and non-toxic. However, the poor solar-thermal conversion performance and structure stability restrict the large-scale application of organic PCMs. Herein,novel PCM composites (CMPCMs) with good structure stability, improved photothermal conversion efficiency, and superior energy storage density were successfully synthesized by impregnating poly (ethylene glycol) (PEG) into cellulose nanofibers/melanin hybrid aerogel. The three-dimensional (3D) aerogel framework had good shape stability and strong encapsulation ability, which inhibited the leakage of PEG and enhanced the shape stability of the synthesized PCM. The differential scanning calorimetry (DSC) results showed that CMPCMs exhibited relatively high melting enthalpies ranging from 168.3 to 175.9 J/g, and the introduction of melanin almost unchanged the energy storage density of the synthesized PCM composites. Simulated sunlight test revealed that the introduction of melanin significantly improved the photothermal conversion efficiency of CMPCMs (from 47.2 to 85.9%). The thermal cycling test and thermogravimetric analysis showed that CMPCMs possessed excellent thermal stability and good encapsulation ability. In conclusion, the synthesized CMPCMs showed great potential in the practical utilization and storage of solar energy.
Research Article
Cellulose Nanofibers/Melanin Hybrid Aerogel Supported Phase Change Materials with Improved Photothermal Conversion Efficiency and Superior Energy Storage Density
https://doi.org/10.21203/rs.3.rs-529394/v1
This work is licensed under a CC BY 4.0 License
Journal Publication
published 21 Aug, 2021
You are reading this latest preprint version
Solar energy is the most popular energy source because it is abundant, accessible, and inexhaustible. It has become an ideal choice for dealing with energy crises, fossil fuel shortages, and global warming. Currently, one of the most common applications of solar energy is solar thermal energy conversion. However, solar energy is not easy to store, and it is greatly affected by the change of day and night, which greatly limits the application of solar energy. Phase change materials (PCMs) currently have great application potential in the field of solar energy materials due to their ability to absorb or release a large amount of heat during the phase change process(Pielichowska and Pielichowski 2014). The application of phase change materials in solar thermal energy conversion can greatly improve energy utilization efficiency and overcome the problem of solar radiation interval. Organic solid-liquid phase change materials are widely used in thermal energy storage systems because of their excellent structural stability, excellent energy storage density, adjustable phase transition temperature, and non-toxic properties(Weigand and Fleischer 2014; Velasco-Carrasco et al. 2020). However, the large-scale application of PCMs in solar energy conversion is limited by the problem of liquid leakage during the phase change process(Pielichowska et al. 2015; Han et al. 2017; Woods et al. 2021). At the same time, the low solar-thermal conversion efficiency of organic phase change materials also limits the use of PCM in the field of solar energy conversion.
The main way to solve the problem of PCM leakage is to use microcapsules to wrap the PCM or use porous materials to adsorb the PCM, so that the shape stability of the PCM can be ensured during the phase change process and liquid leakage can be prevented. However, the above method introduces substances that cannot perform phase change energy storage into the PCM, resulting in a greatly reduced phase change enthalpy of the PCM. At present, an effective technology to prevent phase change liquid leakage due to high surface tension(WOIGNIER, T. and PHALIPPOU, J. 1989) and capillary force is to impregnate organic PCMs into cellulose-based aerogel(Hasnain 1998; Farid et al. 2004; Zhang et al. 2014; Ye et al. 2015). Aerogel is porous three-dimensional (3D) interconnect materials with extremely low density, ultra-high specific surface area and excellent insulating properties(Fricke 1988; Fricke and Tillotson 1997). However, since both cellulose-based aerogel and PCM are organic materials, they have the characteristics of poor solar-thermal conversion performance(Sharma et al. 2009; Yang et al. 2018), and the introduction of cellulose-based aerogel will reduce the phase change enthalpy of PCM, which greatly limits the application of PCM/cellulose aerogel composites in solar thermal conversion systems(Qian et al. 2019). Therefore, how to improve the solar-thermal conversion performance of the composite material and reduce the decrease in the PCM phase change enthalpy caused by the cellulose-based aerogel is an inevitable problem when preparing the PCM/cellulose aerogel composite(Sheng et al. 2019).
Melanin is the general term for a class of phenolic or indole biological macromolecular pigments with complex and diverse structures(Cordero and Casadevall 2020). Melanin is a very effective substance produced by organisms to fight ultraviolet rays(Meredith and Sarna 2006). When ultraviolet rays hit the melanin chemical chain, the melanin chemical chain vibrates at an extremely fast speed, converting 99% of the harmful ultraviolet rays into harmless heat(Forest and Simon 1998; Wakamatsu and Ito 2002; Ito and Wakamatsu 2003; Eisenman and Casadevall 2012; Wang et al. 2019). At the same time, the extraction of melanin from organisms is very simple and efficient(Di Mauro et al. 2017; Solano 2017), and does not require chemical synthesis(d’Ischia et al. 2013), so the use of natural melanin is more environmentally friendly. The introduction of melanin particles into PCM/cellulose aerogel composites can improve the thermal conversion efficiency of the composite material to sunlight, especially ultraviolet rays, and make composites more efficient(Brenner and Hearing 2008).
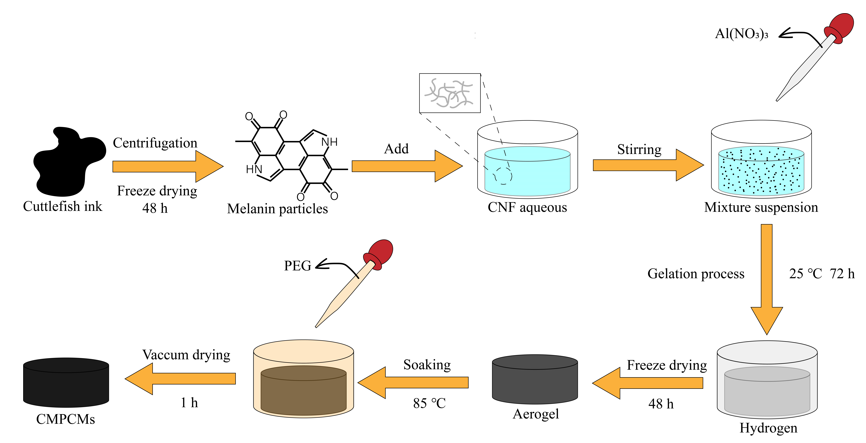
In this work, fresh cuttlefish ink was used as raw material to obtain natural melanin particles through centrifugal treatment and washing, and then cellulose nanofibers/melanin hybrid aerogel (CMA) based on melanin particles and cellulose nanofibers (CNF) were fabricated through induced by cation-induced gelation. After that, polyethylene glycol (PEG) was vacuum immersed into the aerogel to prepare the PCM composite material. The microstructure, loading rate, packaging performance, thermal stability and solar-thermal conversion performance of composites are systematically studied. As expected, the 3D porous aerogel can fully support the PEG during the phase change process and prevent its leakage, and the addition of natural melanin particles can effectively improve the solar-thermal conversion efficiency of CMA/PEG composite PCMs (CMPCMs). At the same time, the reduction of the phase change enthalpy of the PCM is in a lower range. This means that CMPCMs have huge application potential in solar energy utilization systems.
Materials
CNF aqueous (length: 1–3 µm, diameter: 4–10 nm, 1wt%) was supplied from Guilin Qihong Tech Co., Ltd., China. Cuttlefish ink (Unprocessed, food grade) was purchased from Qingdao Xinjie Aquatic Products Co., Ltd., China. Aluminum nitrate nonahydrate (Al(NO3)3⋅9H2O, AR) was obtained from Chengdu Kelong Chemical Reagent Co., Ltd., China. PEG was provided by Chengdu Chron Chemicals Co., Ltd., China.
Extraction of natural melanin
Firstly, use centrifugation (12000 rpm, 20 min) to separate melanin particles from fresh cuttlefish ink. Then, clean melanin particles were received after 4-times of centrifuge-after-washing process with deionized water. After Freeze-drying (-50℃, 20 Pa) for 48 h, excess water was removed, and dry melanin particles were obtained.
Preparation of CMAs
Firstly, prepare the Al(NO3)3/H2O solution with a concentration of 1.84 wt% (50 mmol/L) by dissolving 3.75 g Al(NO3)3⋅9H2O into 200 mL deionized water. Then add a certain amount of melanin into CNF (The mass ratio of CNF to melanin is 4:1, 2:1, 4:3, 1:1), and mechanical stirring for 15 min in a container. Next, add 15 mL Al(NO3)3/H2O solution (The concentration is 1.84 wt%) into the container. After 1 day, the Al(NO3)3/H2O solution was changed 1 time/day for 2 days. Then, aerogel was transferred in to freeze-dry machine for 48 h to obtain dried CMAs, respectively labeled as CMA-1, CMA-2, CMA-3, and CMA-4. At the same time, for the convenience of experimental control, a sample without melanin was also prepared by a completely consistent method, and it was named CA.
Fabrication of CMPCMs
Firstly, PEG was heated to 85℃ in the vacuum oven. Then, the CA and CMAs were placed in PEG that turns into liquid phase. After that, the bubbles in the aerogel was removed by increasing the vacuum until the oven nearly completely vacuums and continued to 1 h. Then, the CA/PEG composite PCM (CPCM) and CMPCMs were prepared, as presented in Scheme 1. Respectively marked as CPCM, CMPCM-1, CMPCM-2, CMPCM-3, and CMPCM-4.
Characterization
The chemical structure of melanin was analyzed by a Fourier transform infrared spectrometer (FTIR, PE Spectrum Two, PerkinElmer, America), the spectra were from 648 to 4000 cm− 1, with a resolution of 2 cm− 1. A Lambda 750 spectrophotometer (Perkin Elmer, America) was used to record the UV-vis-NIR absorption spectrum of the natural melanin particle.
The chemical structure of CMAs and CMPCMs was characterized by an X-ray photoelectron spectroscopy (XPS) spectrometer (K-Alpha+, Thermo Scientific, America).
The internal morphologies and structures of CA, CMAs, CPCM, and CMPCMs were observed by a scanning electron microscope (SEM, Helios G4 UC, Thermo Scientific, America).
The phase transition performance of the CPCM and CMPCMs was measured by differential scanning calorimetry (DSC, 214 Polyma, Netzsch, Germany) with temperature range from 15 to 85 ℃ at a heating/freezing rate of 10 ℃ min− 1 under nitrogen atmosphere. The thermal stability of the CPCM and CMPCMs was evaluated by a TG analyzer (209 F3 Tarsus, Netzsch, Germany), with temperature range from 50 to 800 ℃ at a heating rate 10 ℃ min− 1 under nitrogen atmosphere.
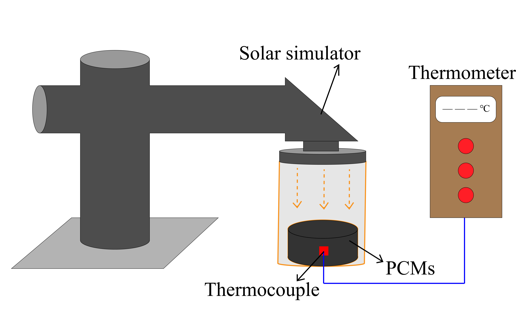
A solar-thermal conversion measurement system was used to evaluate the thermal conversion and storage capability of the CPCM and CMPCMs in practical application, as present in Scheme 2. To simulated sunlight, a solar simulator (CHF-XM500, Beijing Changtuo, China) was used. To measure and record the temperature variations of CPCM and CMPCMs during the light test, a thermocouple thermometer (F-8855, Shenzhen Flank Electronics Co., Ltd, China) was used. The CPCM and CMPCMs were placed under a constant irradiation intensity of 250 mW cm− 2, and the thermocouple was placed into the center of the CPCM and CMPCMs. The solar-thermal conversion and storage efficiency (ε) of CMPCMs was calculated using the equation:

where m, S, and ∆Hm represent the weight, received light irradiation area, and melting enthalpy of the CMPCM sample, respectively, I represents irradiation intensity, and Ts and Te represent the start and end times of phase transition of CMPCMs, respectively. To intuitively demonstrate the leakage, prevent property of CPCM and CMPCMs, the samples were heated at 80°C and photographed at 0min, 10 min, 20 min and 30 min.
Characterization of melanin
FTIR test is used to identify the chemical structure of melanin, the FITR spectra result is shown in Fig. 1a. The strong resonance absorption peak at 3404 cm− 1 corresponds to the N-H stretching vibration of indole and O-H group, indicating that it has a typical melanin indole structure. A peak at 2922 cm− 1 corresponds to the stretching vibration of aliphatic C-H groups, shows that cuttlefish melanin has aromatic hydrocarbon structure. This weak peak at 2922 cm− 1 is one of the characteristics of cuttlefish melanin FTIR spectra. The characteristic strong band at 1616 cm− 1 is attributed to the C = O stretching vibration and the C = C vibration of the aromatic ring or the symmetric stretching of the COO- group. This band together with the strong absorption peak at 3400 cm− 1 indicates the existence of COOH structure. Therefore, it can be concluded that squid black pigments contain specific binding sites (O-H, N-H and COOH) of melanin. The UV-visible absorption spectrum (Fig. 1b) indicates that the sample melanin image has no obvious chromogenic peak and has monotonic broad-band absorbance in the ultraviolet to visible wavelength range.
Chemical structure of CMAs and CMPCMs
XPS was used to analysis the element composition of CPCM, CMPCM-2 and CMPCM-4. Compared with the pure CPCM sample, the spectrum of CMPCM clearly shows the presence of nitrogen (Table 1). XPS spectrums obtained from pure CPCM samples (Fig. 2a) showed signals near 532eV and 286.0eV, indicating the presence of oxygen and carbon, respectively. There is also a weak peak at 400eV, which is presumed to be nitrogen-containing impurities. The XPS spectrums of CMPCM-2 (Fig. 2b) and CMPCM-4 (Fig. 2c) also showed strong peaks around 532eV and 286.0eV. A new peak appeared on the right side of the impurity peak of 400eV, and the new peak was more obvious with the increase of melanin content. This indicates that CMPCM is composed of carbon, nitrogen and oxygen, and nitrogen is introduced by the doping of melanin. The analysis of XPS data showed that the addition of melanin increased the nitrogen content of the sample, which was caused by the nitrogen-containing functional groups of melanin.
As shown in Fig. 2d, the high-resolution XPS C 1s spectrum of CPCM shows that the carbon peak consists of C-C (284.8eV), C-O (286.0eV) and C = O (288.0eV). The high-resolution XPS C 1s spectra of CMPCM-2 (Fig. 2e) and CMPCM-4 (Fig. 2f) showed that the signal of carbon peak was contributed by C-C (284.8eV/284.7eV), C-O (286.4eV/286.0eV), C = O (287.8eV/288.5eV) and C-N/N-H (286.2eV). The high resolution XPS N 1 spectra showed that both CMPCM-2 (Fig. 2g) and CMPCM-4 (Fig. 2h) contained N-H (399.6eV) and –NH+- (400.3eV) functional groups. The high resolution XPS O 1s spectrum of CMPCM-4 (Fig. 2i) corresponds to C-O (532.2 eV) and C = O (532.8eV), respectively. The results of XPS further demonstrated that the in-situ polymerization of melanin and CPCM was successful.
| Element | CPCM | CMPCM-2 | CMPMCM-4 |
|---|---|---|---|
| C (%) | 40.8 | 53.21 | 53.04 |
| O (%) | 57.54 | 43.69 | 40.39 |
| N (%) | 1.65 | 3.11 | 6.57 |
Morphology of CMAs and CMPCMs
The microstructures of CA, CMAs, CPCM and CMPCMs were studied by SEM, as presented in Fig. 3. CA (Fig. 3a) is porous under microscope, most of the pore sizes are in the range of a few microns to a few hundred microns. The structure of pore wall is nano sheet, and the nano sheet has a certain sense of hierarchy. CMAs (Fig. 3b is CMA-2 and Fig. 3c is CMA-4) are also porous under the microscope, and the pore size is mostly in the range of a few microns to a few hundred microns. The main framework is still CA structure. The only difference is that there are irregular protrusions on the pore wall structure, which are formed by the addition of melanin.
The composite materials CPCM (Fig. 3d) and CMPCMs (Fig. 3e is CMPCM-2 and Fig. 3f is CMPCM-4) are blocky structures under the microscope. PEG fills the whole pore structure and forms blocky structure. It still can see the CA framework in some angle sections (Fig. 3d and Fig. 3f), which is enough to support the judgment. The formation of blocky structure indicates that PEG and CA and CMAs have good compatibility. The porous structure and good compatibility can make the low-density aerogel encapsulate a large number of PEG and maintain a higher energy storage density.
Shape stability of CMPCMs
Shape ability is a very important property of composite phase change materials, which often plays a decisive role in the practical application of such materials. When the temperature is higher than the phase transition temperature, most organic PCMs will show fluidity and leak out from the composites, which is the leakage problem of organic phase change materials. To solve this problem, inorganic or organic carrier materials are often used to encapsulate organic PCMs, so it is necessary to measure the encapsulation ability of the materials. The encapsulation ability can be judged by detecting the leakage of materials at different time in the phase transformation stage. For CPCM and CMPCMs, the leakage material in the phase transformation stage is PEG. In this experiment, the phase transition temperature is 80 ℃, and the conditions of 0 min, 10 min, 20 min and 30 min are recorded. The comparison of test results is shown in Fig. 4.
At 25 ℃, PEG, CPCM and CMPCM-4 were smooth white opaque solid, rough white opaque solid and rough black opaque solid, respectively. After heating at 80 ℃ for 10 minutes, PEG began to melt, and the filter paper was wet. CPCM and CMPCM-4 did not change significantly, and the filter paper remained dry. After heating at 80 ℃ for 20 minutes, PEG melts obviously and cannot keep its original shape, the filter paper is wetter. CPCM and CMPCM-4 began to leakage some liquid, and the filter paper was slightly wet. After heating at 80 ℃ for 30 minutes, a large amount of PEG melts and becomes semi solid and semi liquid, and liquid begins to accumulate on the filter paper. CPCM and CMPCM-4 slightly leakage, the morphology remained unchanged, the filter paper is slightly wet. In general, the difference between CPCM and CMPCMs is not obvious, but compared with pure PEG, it has stronger thermal stability and better encapsulation ability.
Thermal properties of CMPCMs
Thermal properties of materials are the different thermal physical properties of materials in the process of using at different temperatures and conditions. Heat capacity is one of the most important thermal properties of phase change energy storage materials. Differential scanning calorimetry (DSC) can measure the specific heat capacity and related thermal properties of samples by measuring and analyzing the data of heat flow corresponding to time or temperature input to the samples. The heat energy storage ability has a very strong connection between phase change properties. Therefore, in order to quantitatively evaluate the effect of the added melanin particles on the PCM phase change enthalpy, DSC analysis was used. Processed the result with software, the melting enthalpy (ΔHm), crystallization enthalpy (ΔHc), melting and crystallization point (Tm and Tc) were collected in Table 2, and the DSC curves of pure PEG, CPCM and CMPCMs were presented in Fig. 5. As expected, a separate and obvious peak could be observed in both heating and cooling processes for all samples. Moreover, the DSC curves exhibited the endothermic peaks of CPCM and CMPCMs in the range of 66.3–69.8 ℃ and the exothermic peaks in the range of 34.7–38.1 ℃, which were almost the same as pure PEG. The reason is that the melanin particles are only dispersed in the aerogel, and there is no chemical reaction between the PEG and the melanin particles, so the melanin particles will not affect the heat absorption capacity of the PEG. But with the increase of melanin content, the peak of crystallization slightly moves to low temperature, and the peak of melting slightly moves to high temperature. This arises because other substance restricted arrangement of PEG molecules and effect their phase transition process. This effect will hinder the crystallization and melting process of the PEG.
| Table 2 Thermal storage property of PEG, CPCM and CMPCMs | |||||
|---|---|---|---|---|---|
| Sample | Tm (℃) | ΔHm (J/g) | Tc (℃) | ΔHc (J/g) | |
| PEG | 65.9 | 197.6 | 33.9 | 178.4 | |
| CPCM | 69.8 | 176.3 | 34.7 | 165.9 | |
| CMPCM-1 | 69.1 | 175.9 | 37.2 | 164.6 | |
| CMPCM-2 | 66.3 | 173.6 | 36.0 | 163.5 | |
| CMPCM-3 | 68.0 | 167.1 | 37.6 | 160.1 | |
| CMPCM-4 | 67.9 | 168.3 | 38.1 | 161.8 | |
As shown in Table 2, the ΔHm of pure PEG, CPCM and CMPCMs were 197.6 J/g, 176.3 J/g, 175.9 J/g, 173.6 J/g, 167.1 J/g, 168.3 J/g, respectively and ΔHc were 178.4 J/g, 165.9 J/g, 164.6 J/g, 163.5 J/g, 160.1 J/g, 161.8, respectively. It can be found that melting enthalpy of CPCM is about 11% lower than that of PEG and crystallization enthalpy of CPCM is about 7% lower than of PEG, because CNF and other substances will replace a certain amount of PEG with the same quality, and the overall enthalpy is reduced. With the increase of melanin content, the enthalpy of CMPCMs decreases gradually, which indicates that melanin can also replace PEG, which has a negative impact on the overall energy storage properties of the sample. This also shows that the porous structure of CNF aerogel has good bearing capacity for PEG.
Thermal reliability can reflect the performance changes of materials in long-term use. For phase change energy storage materials, their energy storage performance will generally change with the increase of use times, and the change of performance determines how to apply the materials. The thermal energy storage properties of the sample after 100 times of heating and cooling from 0 ℃ to 80 ℃ are shown in the Table 3. The melting point and crystallization point of CPCM and CPMCMs samples had negligible changes after 100 repeated thermal cycles. Compared with samples before experiment, the melting point and crystallization point of CPCM and CPMCMs samples decreased by about 2% respectively. The results of accelerated thermal cycling measurement show that CPCM and CPMCMs have excellent thermal reliability.
| Sample | Tm (℃) | ΔHm (J/g) | Tc (℃) | ΔHc (J/g) |
|---|---|---|---|---|
| CPCM | 69.8 | 171.9 | 34.6 | 162.1 |
| CMPCM-1 | 69.2 | 172.8 | 37.2 | 162.2 |
| CMPCM-2 | 66.4 | 169.6 | 36.1 | 160.4 |
| CMPCM-3 | 68.0 | 165.1 | 37.5 | 157.8 |
| CMPCM-4 | 67.9 | 165.7 | 38.0 | 158.9 |
Thermal stability of CMPCMs
Thermal stability refers to ability of a material to remain stable or resist thermal shock at a certain temperature. Thermogravimetry (TG) is one kind of thermal analysis method to measure the relationship between the mass of sample and temperature under temperature-control program. By thermogravimetry, the stability of the samples under different temperature conditions can be summarized, the temperature range suitable for the normal operation of different samples can be found, and the change of internal structure of different samples can be inferred.
Figure 6 displays the TG graphs of CPCM and CMPCMs. The TG curves of CPCM and CMPCMs are similar, almost all the curves have the characteristics of one-step thermal decomposition, and their detailed Tmax (maximum weight loss rate temperature), T− 50 wt% (50 wt% weight loss temperature) and char residue at 650°C are summarised in Table 4. The decomposition temperature is between 350 ℃ and 420 ℃. It shows that melanin has no chemical reaction with PEG, and PEG will volatilize in this temperature range. The maximum mass loss rate is about 392 ℃. With the increase of melanin, the curve will gradually slope downward at 150 ℃, which means melanin will volatilize from 150℃ to 350℃. The residual weight of each sample is different, which shows melanin can affect the structure of the material, but the distribution of the influence is not uniform. With different structure, the sample will have different residual weight.
| Sample | T− 50 wt% (℃) | Tmax (℃) | char yield at 650 ℃ (wt%) |
|---|---|---|---|
| CPCM | 395.8 | 422.3 | 2.71 |
| CMPCM-1 | 393.2 | 418.6 | 13.86 |
| CMPCM-2 | 390.2 | 423.8 | 0.57 |
| CMPCM-3 | 391.3 | 417.8 | 7.54 |
| CMPCM-4 | 391.4 | 418.7 | 9.69 |
Solar-thermal conversion and storage of CMPCMs
Photothermal conversion efficiency reflects the material's ability to use sunlight, which is an important property of photothermal materials. The higher the photothermal conversion efficiency is, the better the thermal storage performance of the composite is, and the practical application is more extensive. In order to test the photothermal conversion and thermal storage capacity of CMPCMs under practical conditions, we carried out simulated sunlight experiments on CPCM and CMPCMs. A cylindrical sample with a diameter of 3cm and a height of 1cm is placed in an insulating foam box and exposed directly to the 250 mW cm− 2 irradiance simulator. Thermocouples are used to measure the temperature of CMPCM over time. A data recorder is connected to collect the temperature of CMPCMs. As shown in scheme 2.
Figure 7 shows the temperature-time curve of CMPCMs under illumination. The temperature of the sample rises gradually from the time of irradiating the sample. When the temperature of each sample rises to the range of 50–55 ℃, the heating curve begins to slow down, and the heating rate drops sharply. This change is due to the endothermic process of PEG phase transition in CMPCMs. After the phase transition, the temperature of the sample continues to rise, and when the measured temperature reaches 80 ℃, the illumination was stopped immediately. After illumination stopped, the actual sample temperature continued to rise to 83 ℃, and then began to cool down. During the cooling process, the solidification temperature of PEG is about 50 ℃. From the image, we can see that with the increase of the mass ratio of CNF and melanin, the phase transition time becomes shorter.
After calculation, the photothermal conversion and storage efficiency of CPCM, CMPCM-1, CMPCM-2, CMPCM-3, and CMPCM-4 are 47.2%, 61.4%, 70.8%, 78.6% and 85.9% respectively. The results show that CPCM after adding melanin can obtain the photothermal properties of melanin, and the photothermal conversion efficiency increases with the increase of the proportion of melanin. Compared with CPCM, the photothermal conversion rates of MPCM-1, MPCM-2, MCM-3, and MPCM-4 are increased by 30.1%, 50.0%, 66.5% and 82.0%, respectively, which can show that melanin can greatly improve the photothermal properties of CPCM and optimize it to a phase change material with high photothermal properties and high energy storage density.
Novel CMPCMs with good structure stability, improved photothermal conversion efficiency, and superior energy storage density were successfully synthesized by impregnating PEG into cellulose nanofibers/melanin hybrid aerogel which was prepared by in situ polymerization method. The 3D aerogel framework had good shape stability and strong encapsulation ability, which inhibited the leakage of PEG and enhanced the shape stability of the synthesized PCM. The DSC results showed that CMPCMs exhibited relatively high melting enthalpies ranging from 168.3 to 175.9 J/g, and the introduction of melanin almost unchanged the energy storage density of the synthesized PCM composites. Simulated sunlight test revealed that the introduction of melanin significantly improved the photothermal conversion efficiency of CMPCMs (from 47.2 to 85.9%). The thermal cycling test and thermogravimetric analysis showed that CMPCMs possessed excellent thermal stability and good encapsulation ability. In conclusion, the synthesized CMPCMs showed great potential in the practical utilization and storage of solar energy.
Competing of interest The authors declare that they have no known competing financial interests or personal relationships that could have appeared to influence the work reported in this paper.
Ethical approval The article does not include human participants and/or animals research.
Authorship contribution Jiulong Chen: Investigation, Writing - Original Draft, Writing - Review & Editing, Visualization. Yiyang Zhang: Data curation, Formal analysis. Fugeng Wu: Validation. Bin Guan: Software. Xiaosheng Du: Conceptualization, Methodology, Project administration, Resources. Haibo Wang: Supervision, Funding acquisition.
Acknowledgements This work was funded by the National Natural Science Foundation of China (NO. 51773129, 51903167). The author appreciates Professor Xinfeng Quan from Sichuan University - Pittsburgh Institute for his careful guidance. Also thank Yulong Tan, Jianing Xu from College of Biomass Science and Engineering of Sichuan University and Jinbo Zhao from Sichuan University - Pittsburgh Institute for their help in the experiment.
- Brenner M, Hearing VJ (2008) The Protective Role of Melanin Against UV Damage in Human Skin. Photochem Photobiol 84:539–49
- Cordero RJB, Casadevall A (2020) Melanin. Curr Biol 30:R142–R143. https://doi.org/10.1016/j.cub.2019.12.042
- d’Ischia M, Wakamatsu K, Napolitano A, et al (2013) Melanins and melanogenesis: methods, standards, protocols. Pigment Cell Melanoma Res 26:616–633. https://doi.org/10.1111/pcmr.12121
- Di Mauro E, Xu R, Soliveri G, Santato C (2017) Natural melanin pigments and their interfaces with metal ions and oxides: emerging concepts and technologies. MRS Commun 7:141–151. https://doi.org/10.1557/mrc.2017.33
- Eisenman HC, Casadevall A (2012) Synthesis and assembly of fungal melanin. Appl Microbiol Biotechnol 93:931–940. https://doi.org/10.1007/s00253-011-3777-2
- Farid MM, Khudhair AM, Razack SAK, Al-Hallaj S (2004) A review on phase change energy storage: materials and applications. Energy Convers Manag 45:1597–1615. https://doi.org/10.1016/j.enconman.2003.09.015
- Forest SE, Simon JD (1998) Wavelength-dependent Photoacoustic Calorimetry Study of Melanin. Photochem Photobiol 68:296–298. https://doi.org/10.1111/j.1751-1097.1998.tb09684.x
- Fricke J (1988) Aerogels — highly tenuous solids with fascinating properties. Glas Glass Ceram Gels 100:169–173. https://doi.org/10.1016/0022-3093(88)90014-2
- Fricke J, Tillotson T (1997) Aerogels: Production, characterization, and applications. Thin Solid Films 297:212–223. https://doi.org/10.1016/S0040-6090(96)09441-2
- Han GGD, Li H, Grossman JC (2017) Optically-controlled long-term storage and release of thermal energy in phase-change materials. Nat Commun 8:1446. https://doi.org/10.1038/s41467-017-01608-y
- Hasnain SM (1998) Review on sustainable thermal energy storage technologies, Part I: heat storage materials and techniques. Energy Convers Manag 39:1127–1138. https://doi.org/10.1016/S0196-8904(98)00025-9
- Ito S, Wakamatsu K (2003) Quantitative Analysis of Eumelanin and Pheomelanin in Humans, Mice, and Other Animals: a Comparative Review. Pigment Cell Res 16:523–531. https://doi.org/10.1034/j.1600-0749.2003.00072.x
- Meredith P, Sarna T (2006) The physical and chemical properties of eumelanin. Pigment Cell Res 19:572–594. https://doi.org/10.1111/j.1600-0749.2006.00345.x
- Pielichowska K, Pielichowski K (2014) Phase change materials for thermal energy storage. Prog Mater Sci 65:67–123. https://doi.org/10.1016/j.pmatsci.2014.03.005
- Pielichowska K, Szatkowski P, Zambrzycki M, Macherzynska B (2015) Polyurethane/graphene nanocomposites as phase change materials for thermal energy storage. In: 2015 IEEE 15th International Conference on Nanotechnology (IEEE-NANO). IEEE, Rome, pp 105–108
- Qian Y, Han N, Zhang Z, et al (2019) Enhanced Thermal-to-Flexible Phase Change Materials Based on Cellulose/Modified Graphene Composites for Thermal Management of Solar Energy. ACS Appl Mater Interfaces 11:45832–45843. https://doi.org/10.1021/acsami.9b18543
- Sharma A, Tyagi VV, Chen CR, Buddhi D (2009) Review on thermal energy storage with phase change materials and applications. Renew Sustain Energy Rev 13:318–345. https://doi.org/10.1016/j.rser.2007.10.005
- Sheng N, Nomura T, Zhu C, et al (2019) Cotton-derived carbon sponge as support for form-stabilized composite phase change materials with enhanced thermal conductivity. Sol Energy Mater Sol Cells 192:8–15. https://doi.org/10.1016/j.solmat.2018.12.018
- Solano F (2017) Melanin and Melanin-Related Polymers as Materials with Biomedical and Biotechnological Applications—Cuttlefish Ink and Mussel Foot Proteins as Inspired Biomolecules. Int J Mol Sci 18:1561. https://doi.org/10.3390/ijms18071561
- Velasco-Carrasco M, Chen Z, Aguilar-Santana JL, Riffat S (2020) Experimental Evaluation of Phase Change Material Blister Panels for Building Application. Future Cities Environ 6:6. https://doi.org/10.5334/fce.84
- Wakamatsu K, Ito S (2002) Advanced Chemical Methods in Melanin Determination. Pigment Cell Res 10
- Wang K, Hou Y, Poudel B, et al (2019) Melanin–Perovskite Composites for Photothermal Conversion. Adv Energy Mater 9:1901753. https://doi.org/10.1002/aenm.201901753
- Weigand R, Fleischer AS (2014) The influence of nanoparticle loading and surfactant on the viscosity of nanoenhanced energy storage materials. In: Fourteenth Intersociety Conference on Thermal and Thermomechanical Phenomena in Electronic Systems (ITherm). IEEE, Orlando, FL, USA, pp 846–850
- WOIGNIER, T., PHALIPPOU, J. (1989) SCALING LAW VARIATION OF THE MECHANICAL PROPERTIES OF SILICA AEROGELS. J Phys Colloq 50:C4-179-C4-184. https://doi.org/10.1051/jphyscol:1989429
- Woods J, Mahvi A, Goyal A, et al (2021) Rate capability and Ragone plots for phase change thermal energy storage. Nat Energy 6:295–302. https://doi.org/10.1038/s41560-021-00778-w
- Yang J, Li X, Han S, et al (2018) High-quality graphene aerogels for thermally conductive phase change composites with excellent shape stability. J Mater Chem A 6:5880–5886. https://doi.org/10.1039/C8TA00078F
- Ye S, Zhang Q, Hu D, Feng J (2015) Core–shell-like structured graphene aerogel encapsulating paraffin: shape-stable phase change material for thermal energy storage. J Mater Chem A 3:4018–4025. https://doi.org/10.1039/C4TA05448B
- Zhang Y, Zheng X, Wang H, Du Q (2014) Encapsulated phase change materials stabilized by modified graphene oxide. J Mater Chem A 2:5304–5314. https://doi.org/10.1039/C3TA15242A
- scheme1.png
Scheme 1. Synthetic scheme of the CMPCMs.
- scheme2.png
Scheme 2. Schematic of the solar-thermal conversion measurement system.