Synthesis and characterization of CMSN@SRT@Anti
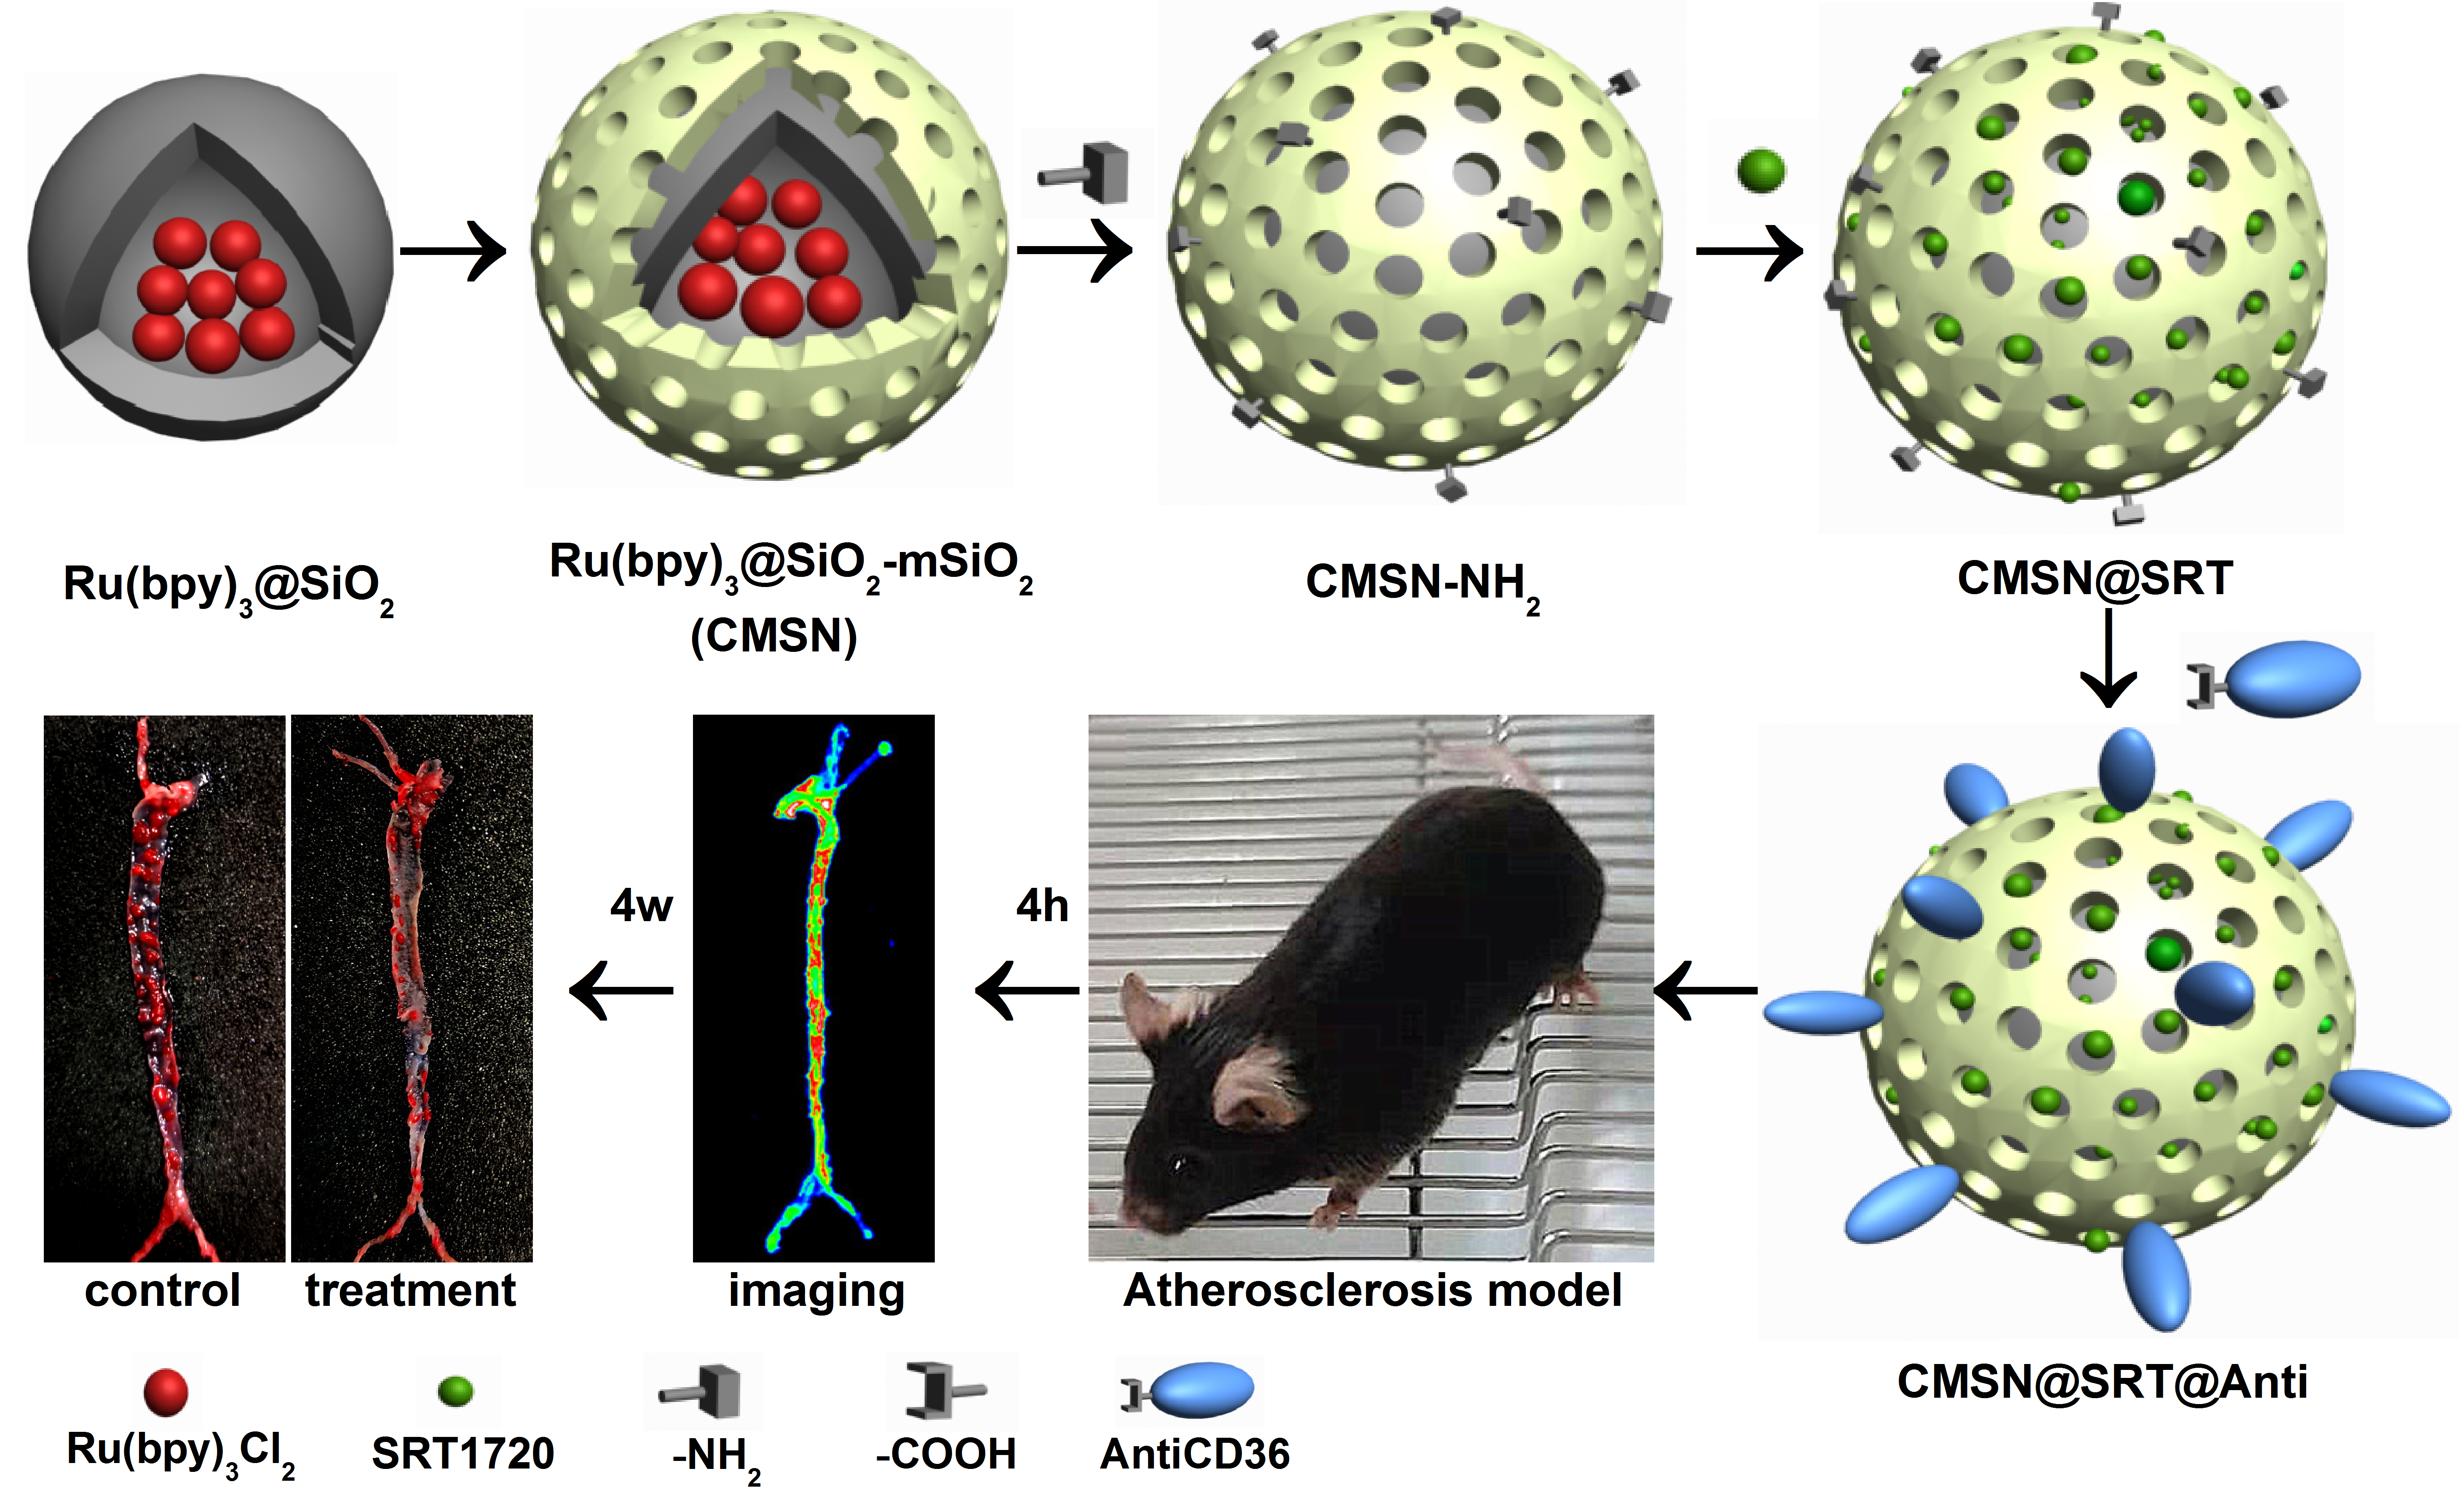
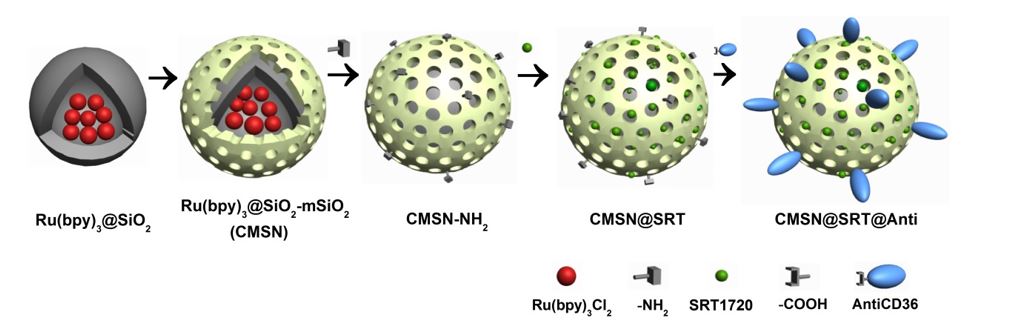
The fabrication of the CMSN@SRT@Anti began with the preparation of Ru(bpy)3@SiO2. Typically, 3.5 mL of Ru(bpy)3Cl2 solution (10 mM in H2O) was added to a mixture of 35 mL cyclohexane, TritonX-100 and hexanol with a ratio of 4:1:1. The obtained mixture was maintained at room temperature for 30 min under magnetic stirring. Then, 1 mL mixed solution of TEOS and NH3.H2O with a ratio of 1:1 was added and was continued stirred for 24 h. At the end of the reaction, the mixed solution was centrifuged (6000 rpm, 30 min) to obtain a light red precipitate, namely Ru(bpy)3@SiO2. The product was washed with ethanol for 3 times, and then dried in a lyophilizer and stored at 4°C away from light.
The covering of mSiO2 layer was used for drug delivery in the current study. Briefly, 25 mL N-Hexadecyltrimethylammonium chloride (CTAC) aqueous solution (25% wt) and 250 µL triethylamine (TEA) were added into 35 mL Ru(bpy)3@SiO2 solution (3 mg/mL). After mixing evenly, 20 mL tetraethyl orthosilicate (TEOS) (5%, v/v) was added. The mixture was stirred at 60°C (200 rpm) for 24 h without light. After the reaction, the obtained product was demoulded by NaCl-methanol solution (1% wt) (3 times, 24 h each time). The obtained Ru(bpy)3@SiO2-mSiO2(CMSN) was washed, dried and finally preserved at 4°C in isolation from sunlight.
The CMSN@SRT@Anti was formed in three steps. Firstly, the amination of CMSN was performed. 20 µL (3-Aminopropyl) triethoxysilane (APTES) was dropped in 3 mL CMSN solution (10 mg/mL in anhydrous toluene) slowly, and they were stirred at 60°C for 5 h under nitrogen protection. The precipitate was washed by anhydrous ethanol for three times and dried for later use. Secondly, SRT1720 was loaded. Briefly, 30 µL SRT1720 solution (50 mM in Dimethyl sulfoxide) were incubated with 470 µL amino modified CMSN (1.0 mg/mL) overnight in a thermostatic oscillator (37°C, 100 rpm). After the reaction, the centrifugal precipitate was washed with PBS for three times to remove the unloaded drugs. Finally, covalent binding of CMSN@SRT with AntiCD36 was performed. 4 µg AntiCD36 was dissolved in 1-(3-Dimethylaminopropyl)-3-ethylcarbodiimide hydrochloride (EDC) solution (2 mg/mL in 500 µL PBS) for 15min for carboxyl group activation. Then, it was mixed with 500 µL solution containing 1 mg CMSN@SRT and 1 mg N-hydroxysuccinimide (NHS) for 2 h incubation at 37°C. After centrifugation and washing, the precipitates were dispersed in 1mL PBS and stored at 4°C before use. The CMSN@Anti were prepared following the same procedures as described above, except without SRT loading.
Ru(bpy)3@SiO2 and CMSN were characterized by TEM (TECNAI- G2, FEI, USA). The absorption spectra and the fluorescence spectra were recorded by an ultra-micro spectrophotometer (NanoDrop One, Thermo Fisher Scientific, Waltham mass, USA ) and a fluorescence spectrophotometer (LS-55, PerkinElmer, USA), respectively. Infrared spectra were detected by Fourier transform infrared spectrometer (GB/T 2186 − 2007, Piketech, UK). The surface potential and hydrated particle size were detected by Zeta potentiometer (Nano ZS90, Malven, UK).
Drug release in vitro
In order to understand the drug loading and drug release of CMSN@SRT@Anti, the standard curve of SRT1720 was firstly determined with the absorbance intensity of SRT1720 at 246 nm as the ordinate and the corresponding concentrations (0.01–5 mM) as the abscissa. The determinations of EE, LE and the drug release were all based on this.
The method of in vitro release is as follows. 0.5 mL CMSN@SRT@Anti (0.25 mg/mL) was transferred into a dialysis bag (MWCO = 100 KDa) and placed in tubes containing PBS with pH of 6.5, 7.4, or 9, respectively. They were rotated at 37°C with a speed of 200 rpm for 48 h. 2 µL liquid in the tubes was picked up at scheduled time points, and their UV-vis absorbance values were measured using an ultra-micro spectrophotometer. The PBS buffer volume in the test tube remains constant
Cell Culture
RAW264.7 (mouse macrophage cell line) and NIH-3T3 (mouse embryonic fibroblast cell line) were purchased from the Cell Bank of the Chinese Academy of Sciences (Shanghai, China). They were incubated with DMEM (Gibco, Logan, Utah, USA) supplemented with 10% fetal bovine serum (Thermo Fisher Scientific, Waltham mass, USA) and 1% Penicillin-Streptomycin (Biyuntian, Shanghai, China). The cells were maintained in a 5% CO2 incubator at 37°C. For in vitro AS simulation, RAW264.7 cell were pretreated with 60 µg/mL ox-LDL (Yuanye Biotechnology, Shanghai, China).
Biocompatibility evaluation in vitro and in vivo
The cytotoxic effect of CMSN@SRT@Anti on RAW264.7 or NIH-3T3 was evaluated by the MTT method. After the incubation of RAW264.7 or NIH-3T3 with different concentrations of nanomaterials in 96-well plates (n = 6) for 24 h (0–40 µg/mL), the media was removed. After washing with PBS, 100 µL 1 mg/mL MTT (Haoran Biotechnology, Shanghai, China) was added to each well. After further culture for 4 h, the MTT solution was discarded gently and 100 µL of Dimethyl sulfoxide (DMSO) (Pierce, Rockford, USA) was added to dissolve the formazan crystals. Finally, the absorbance of each well at 490 nm was measured with a microplate analyzer (Multiskon MK3, Thermo Fisher Scientific, Waltham mass, USA).
For in vivo biocompatibility evaluation, hematological and biochemical analyses of mouse with intraperitoneal injection of CMSN@SRT@Anti were carried out. The Kunming mice were treated with CMSN@SRT@Anti or an equivalent volume of PBS at a dose of 170 mg/kg/d every other day. Eyeball blood samples were taken at 1 day, 7 day and 21 day after nanomaterials injection as well as 21 day after PBS injection. The collected blood was used for blood biochemical detection (n = 3) and routine blood detection (n = 3). Hematoxylin-eosin (H&E) staining was performed for the main organs of the mice after different treatment and observed under an optical microscope.
To further study the metabolism of CMSN@SRT@Anti, the Kunming mice were injected intraperitoneally with the nanomaterials (170 mg/kg). The mice were sacrificed at scheduled time points (0, 0.5, 1, 2, 4, 6, 12, 24h). The liver and cholecyst were collected and imaged (5200Multi, Ton, Shanghai, China).
The evaluation of inhibition effect of macrophage cell foaming in vitro
To further evaluate the therapy effect of CMSN@SRT@Anti in vitro, macrophage cells were treated with different groups: blank control group (BLK, RAW264.7 without any intervention), Model group (MG, RAW264.7 was incubated with ox-LDL only), CMSN group ( RAW264.7 was incubated with ox-LDL and CMSN), CMSN@Anti group (RAW264.7 was incubated with ox-LDL and CMSN@Anti), CMSN@SRT group (RAW264.7 was incubated with ox-LDL and CMSN@SRT), CMSN@SRT@Anti group (RAW264.7 was incubated with ox-LDL and CMSN@SRT@Anti), free AntiCD36 group (RAW264.7 was incubated with ox-LDL and AntiCD36), and free SRT1720 group (RAW264.7 was incubated with ox-LDL and SRT1720). The concentrations of ox-LDL in all groups were 60 µg/mL. After different treatments, the TC contents in cells were quantitatively analyzed using the TC assay kit (Suoqiao Biology, Shanghai, China) (n = 3).
In order to more intuitively demonstrate the inhibitory effect of different treatments on the RAW264.7 cell foaming, oil red staining was carried out to instead TC value determination. ImageJ software was used to semi-quantitatively analyze the red stained area (n = 3).
The cell oil red O staining method was referred to the instruction. In brief, the treated cells were fixed with 4 % paraformaldehyde (VICMED, Xuzhou, China) at room temperature for 15 min. After rinsed with PBS twice, the oil red working solution was added to stain for 40 min in the dark. Then, the cells were rinsed with distilled water for three times and observed under a fluorescent inverted microscope. The configuration of the oil red O working liquid was prepared as follows. 6 mL 0.5 % saturated oil red O was mixed with 4 mL distilled water, and purified by filtering through a filter paper in the dark.
In vitro fluorescence imaging
To show the specific targeting ability of our fabricated CMSN@SRT@Anti to macrophages, RAW264.7, NIH-3T3, RAW264.7 pre-treated with 60 µg/mL ox-LDL or NIH-3T3 pre-treated with 60 µg/mL ox-LDL were first inoculated in 6-well plates, respectively (n = 3). Then, the cells were then incubated with CMSN@SRT@Anti or CMSN@SRT with a concentration of 16 µg/mL for 2 h at 37°C. After fixed with 4 % paraformaldehyde at room temperature for 15min, the cells were washed twice with PBS and the nuclei were stained with DAPI. The cellular fluorescence imaging were observed under an inverted fluorescence microscope (DMI3000B, Leica, Germany).
Development Of Animal Model
The purchased six week-old male ApoE-/-mice (male, GemPharmatech, Nanjing, China), initially fed a normal diet feeding 1 week to adapt to the new environment. Then, mice continued to be fed with the normal diet as a negative control group (low-fat diet, LFD) and a (high-fat diet, HFD) for 12 weeks to establish AS model. Composition of HFD is 40 % Fat and 1.25 % Cholesterol. Kunming male mice (Xuzhou Medical University, Xuzhou, China) were used to study the potential toxicity and metabolism of our prepared nanomaterials. All animal procedures followed the regulations of the Chinese Physiological Society for the Management of Laboratory Animals. The experimental scheme was in line with the ethical requirements of the Animal Care Committee of Xuzhou Medical University (202008A077).
In vivo targeted fluorescence imaging
In order to select the best imaging time point of nanoparticles in vivo, 5 male AS-model mice (HFD for 16 w) with similar weight and status were used. 4 of them were treated with intraperitoneal injection with CMSN@SRT@Anti (170 mg/kg) respectively. The mice were sacrificed at different time points (0, 1, 4, 8, 24 h), and the isolated aortas were collected. Then, the arteries were washed with saline three times and visualized using a small animal fluorescence imaging system.
To further compare the specific targeting ability of CMSN@SRT@Anti and CMSN@SRT, the AS-model mice were intraperitoneal injection with PBS, CMSN@SRT@Anti or CMSN@SRT with an amount of 170 mg/kg (n = 3), respectively. Four hours later, the isolated aortas were washed with saline and placed in a small animal fluorescence imaging system. The signal intensities of whole arteries were quantified using Tanon Image Gel software (Tanon, Shanghai, China).
In vivo therapy
To evaluate the therapy effect of AS by CMSN@SRT@Anti in vivo, ApoE-/-mice (HFD for 12 w) were divided into five groups(n = 4): the LFD + PBS group (LFD), the HFD + PBS group (Vehicle), the HFD + CMSN@SRT@Anti, the HFD + CMSN@SRT, and the HFD + free SRT1720 group (SRT1720). AS-model mice fed with HFD were intraperitoneal injected with nanomaterials (170 mg/kg/d) or SRT1720 (50 mg/kg/d) [38] or the same volume of PBS liquid every other day for four weeks. The mice were sacrificed after the treatment. The TC values in blood were determined by the TC determination kit, and the aorta red staining areas after oil red staining were analyzed semi-quantitatively by ImageJ. H&E was introduced to show the changes of the main organs of mice after CMSN@SRT@Anti treatment.
The Oil Red O staining procedure to observe the plaque of lipid deposits was as follows. The aorta was dissected, and the adventitial fat was removed after being opened longitudinally with the luminal surface toward the outside. After fixed in 4 % paraformaldehyde at room temperature for 2 h, the aorta was placed in 0.3 % Oil Red O working solution (Solarbio, Beijng, China) at 45 ℃ for 1 h in the dark condition, and then rinsed with 85 % isopropanol for 3 times. The ImageJ quantitatively analyzed the aorta (thoracic aorta, abdominal aorta and aortic arch).
Statistical analysis
All the analyses involved in this project were performed by SPSS 22.0 software. Data were expressed as mean ± standard deviation. Shapiro-Wilk test was used to determine the normality of the data distribution. The multi-group comparisons were made with a one-way ANOVA analysis, followed by Dunnett’s post hoc test. The Student’s t test was used for comparison between the two groups. According to the test level α = 0.05, P < 0.05 was considered to be statistically significant.