Cell-lines and cell culture
Human PANC-1 and MIA PaCa2 pancreatic cancer cells (ATCC, Manassas, VA) were cultured in high glucose (4.5 g/mL) DMEM (Gibco, Thermo Fischer Scientific, Waltham, MA), and human THP-1 cells were cultured in RPMI-1640 (Gibco). All media were supplemented with 10% fetal bovine serum (FBS), L-glutamine (2 mM), except RPMI-1640 media for conditioned media experiments, which was supplemented with 1X GlutaMAX (Gibco), penicillin (100 units/mL), and streptomycin (500 μg/mL) (Lonza, Basel, Switzerland) according to routine cell culture procedures. Cells were incubated in 5% CO2 incubators at 37oC. All cell lines were authenticated by STR profiling (Promega PowerPlex, Leiden, Netherlands) and tested for mycoplasma by PCR monthly.
Generation of M0, M1, M2, and TAM macrophages from THP-1 cells
THP-1 cells were treated with 150 nM phorbol 12-myristate 13-acetate (PMA, Sigma, St. Louis, MO, USA) for 24 hours in RPMI-1640 medium. Next, activated THP-1 cells were washed with fresh medium to remove PMA. Cells were cultured in fresh medium for another 24 hours, after which the medium was refreshed once more. Without any other additions, macrophages were considered M0 macrophages at this stage (see Figure 1 for validation). To generate M1 macrophages, M0 macrophages were treated with 1 ng/ml LPS (Ultrapure, Invivogen, Toulouse, France) for 24 hours. To generate M2 macrophages, M0 macrophages were treated with 20 ng/ml recombinant IL-4 (Peprotech, Rocky Hill, NJ) and IL-13 (Peprotech) each for 72 hours. To generate tumor-associated macrophages (TAM), M0 macrophages were treated with a supernatant mix (collected from PANC-1 and MIA PaCa-2 cells at ~80% confluence) in a 1:1 dilution with fresh complete RPMI-1640 media. At the end of each incubation, macrophages were washed twice with a fully supplemented medium to remove the cytokines and other factors from the flask. Media collections were done after 48 hours of incubation. The media were centrifuged at 1200 rpm for 4 minutes to remove cell debris, filtered using 0.2 µm syringe filters (Corning, Corning, New York), and stored at 4oC. For experimental procedures, all conditioned media were diluted 1:1 with fresh media (DMEM) to ascertain the medium’s appropriate nutrient content.
Generation of monocyte-derived macrophages from peripheral blood mononuclear cells
Peripheral blood mononuclear cells (PBMC) were obtained by Ficoll-Paque (GE Healthcare, Chicago, IL, USA) density centrifugation from whole blood collected from a single healthy volunteer (following institutional standard operating protocol and under the approval of Medical Ethics Review Committee) in lithium-heparin coated blood tubes (BD, Franklin Lakes, NJ). For monocyte isolation from PBMC, the MACS Monocyte Isolation kit with CD14+ magnetic beads was used with MACS LS Columns according to the manufacturer’s manual (Miltenyi Biotec, Bergisch Gladbach, Germany). Isolated monocytes were plated in fully supplemented RPMI media and treated with either 50 ng/ml M-CSF (Prospec, Rehovot, Israel) or 50 ng/ml GM-CSF (Prospec) for 6 days to obtain M0 subtype monocyte-derived macrophages (MDM); media were refreshed together with the cytokines every 2 days. To obtain M1 and M2 MDM subtypes, all media were removed on day 6 after which the M0 macrophages were treated for 24 hours with 50 ng/ml IFN-γ (Peprotech) on the previously GM-CSF treated group, or with 20 ng/ml IL-4 (Peprotech) and IL-13 (Peprotech) on the previously M-CSF treated group to obtain M1 and M2 MDMs respectively. Conditioned media from all subtypes were collected and processed as for the THP-1 derived macrophage media.
Quantitative real-time PCR
Total RNA was isolated using a NucleoSpin RNA miniprep kit (Macherey Nagel, Düren, Germany). cDNA was synthesized from DNase-treated total RNA using M-MLV-RT (Promega, Leiden, Netherlands) and random hexamers (Qiagen, Hilden, Germany). Quantitative RT-PCR was performed using a Sensifast SYBR No-Rox Kit (Bioline, London, UK) on a LightCycler 480 II (Roche, Basel, Switzerland). Relative expression levels were calculated using the comparative threshold cycle (dCt method) and normalized for the expression of the reference gene TBP. Primer sequences of the analyzed genes are shown in Supplementary Table 1.
BrdU proliferation assay
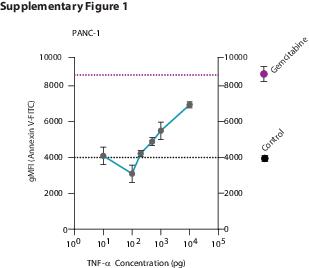
PANC-1 and MIA PaCa2 cells were seeded in black, clear-bottom 96-well plates (Corning) in DMEM without serum. The following day, macrophage conditioned media were added in a 1:1 dilution with complete DMEM. BrdU labeling solution was given to cells after 48 hours of conditioned media treatment. The BrdU assay was performed according to the manufacturer’s instructions (Chemiluminescent BrdU assay, Roche). Luminescence was measured on a Synergy HT Biotek Microplate Reader (Biotek Instruments, Winooski, VT). For testing the functional importance of TNF-a in M0 conditioned medium, we included human recombinant TNF-a (Sigma) in concentrations from 10 pg to 10 ng and the TNF-α inhibitor Infliximab (Remicade, MSD, Kenilworth, NJ) at 25 ug/ml.
TNF-a ELISA
A commercially available ELISA kit (R&D Systems, Minneapolis, MN) was used to determine TNF-a levels from THP-1- and MDM-derived macrophage supernatants. Samples were measured in 4 biological replicates. The analysis was according to the manufacturer’s instructions. Absorbance was measured with a Synergy HT Biotek microplate reader (Biotek Instruments) at 450 and 655 nm.
Flow cytometry detection of Annexin V
Cells were treated for 48 hours with different macrophage supernatants and with 1:1 DMEM-RPMI mix as control. Cell supernatants were collected in a tube to include non-adherent cells. Cells were detached using trypsin, and this cell fraction was pooled with the cell supernatant in a 15 mL tube. The mix was pelleted by centrifugation at 1200 rpm for 5 minutes. The pellet was re-suspended in Annexin V binding buffer (BD) and distributed to 96-well plates for staining. Each well contained 100 µl of cell mix and 1 µl Annexin V FITC (BD). The plate was incubated on ice, in the dark, for 1 hour. After incubation, the plate was washed twice with Annexin V binding buffer and cells were re-suspended in 200 µL in the same buffer for measuring. The measurements were performed on a FACS Canto II (BD). Data were analyzed using FLOWJO v10 (FlowJo LLC, Ashland, OR). Cells were gated initially based on FCS and SSC for the main cell population, and then on FCS-H and FCS-W to obtain single cells. FITC-positive populations were gated based on isotype antibody control samples. For analysis, Geometric Mean Fluorescent Intensity (gMFI) on FITC values were used.
Statistical Analysis
Data were presented as mean ± SEM. Statistical analyses were performed using GraphPad PRISM 7.0 (Graphpad Software Inc., La Jolla, CA). Differences were considered statistically significant at a p-value of less than 0.05. For further details of the statistical analysis, see figure legends. P-values are indicated by asterisks with * p < 0.05, ** p < 0.01, *** p < 0.001, and **** p < 0.0001.