The nomo1 mRNA expression level from early embryonic development to the juvenile stage and generation of nomo1 mutant zebrafish
The nomo1 gene in zebrafish is homologous to the human NOMO1 gene, and they share 68% and 70% identity in cDNA and protein sequences, respectively. Cao et al. and Haffner et al. have confirmed the expression pattern of nomo1 from early embryonic development to larval stages in zebrafish using WISH [9, 13]. RT-qPCR was performed to determine the expression level of nomo1 during different developmental stages. At 12 hpf-7 dpf, whole zebrafish embryo were used since they were a smaller size. At 14 dpf, heads of zebrafish were used and at 1-2 mpf, the brain tissues were studied. The expression of the nomo1 mRNA in embryonic zebrafish increased before 48 hpf and decreased at 5 dpf and 7 dpf, as determined using RT-qPCR (12 hpf-7 dpf). As development progressed, the expression of the nomo1 mRNA peaked a second time at 14 dpf, and the highest mRNA expression level was detected in brain tissues from 2 mpf zebrafish (Fig. 1F).
The sgRNA of nomo1 was designed by editing exon 7, which was located before the functional structural domain FN3 in the genomic sequence of zebrafish [31]. The sequence was 5’- GGG CTA TGA TGT CTC TGG AG- 3’ (Fig. 1A). Fig. 1B-D shows the process by which nomo1 homozygous zebrafish were generated using CRISPR/Cas9 technology. Genomic DNA was extracted, and the specific PCR products were sequenced, confirming that the nomo1 sequence contained a 1-base deletion (Fig. 1E), resulting in a frameshift mutation and truncated protein 10 amino acids after the mutation (Fig. 1H). The abnormal nomo1 mRNA expression level was detected in mutant zebrafish at 48 hpf, 14 dpf and 2 mpf, as determined using RT-qPCR (Fig. 1G).
Morphological analysis of nomo1-/- zebrafish
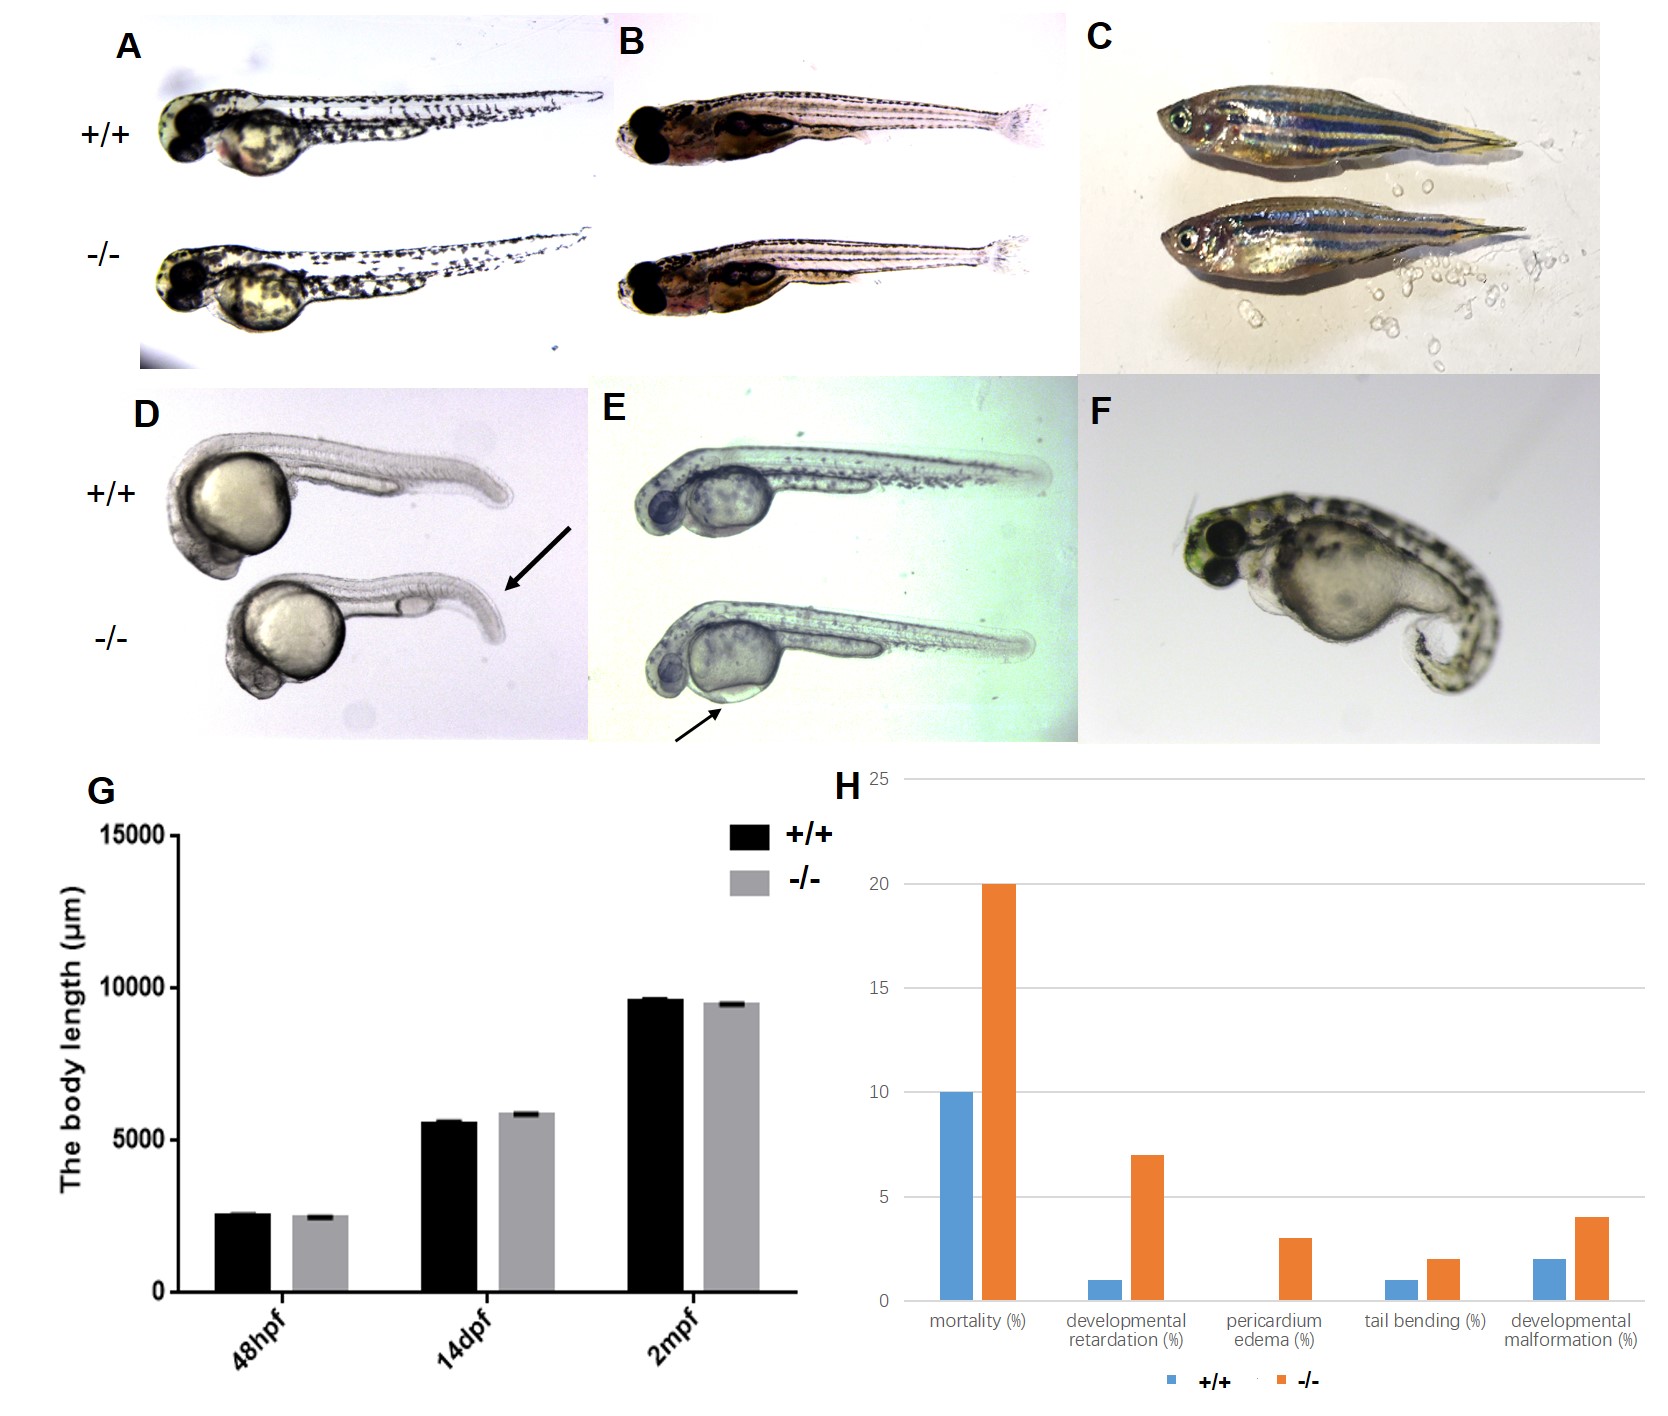
We measured morphological changes in mutant zebrafish to examine the consequences of nomo1 deficiency during zebrafish development (Fig. S1). The mortality of the early mutant embryos (24 hpf) was higher than WT zebrafish (Fig. S1H). Mutant embryos exhibited the following morphological changes during development: developmental retardation (the extended rupture of membranes), tail bending (Fig. S1D, arrow), pericardial edema (Fig. S1E, arrow) and developmental malformation (Fig. S1F). The ratios of morphological changes are shown in Fig. S1H. However, these morphological differences in the phenotype of nomo1-/- zebrafish gradually became less noticeable during development (Fig. S1A-C). We statistically analyzed the body length of zebrafish at different developmental stages and did not observe a significant difference (Fig. S1G).
Nomo1 deficiency significantly affected the locomotion of 7 dpf zebrafish under different illumination intensities
We examined the locomotor activity of 7 dpf zebrafish and their reactions to light-dark transitions to determine whether the loss-of-function of nomo1 would modulate the behavior of larval zebrafish. After 20 min of adaptation, the locomotion and thigmotaxis behaviors of larval zebrafish were analyzed (Fig. 2A). We recorded the trends in the swimming behaviors of WT and mutant zebrafish in 24-well plates (Fig. 2B). An analysis of the average distance moved per minute from minutes 21 to 60 (L0) under light conditions (Fig. 2C) showed that the locomotion of nomo1-/- zebrafish was significantly reduced compared with nomo1+/+ zebrafish, confirming the specificity of the phenotype.
Similarly, the mutant zebrafish displayed significantly decreased locomotor activity during the two light-dark cycles, and WT and mutant zebrafish showed a light-sensitive reaction in every light-dark cycle (Fig. 2D-E). Although the WT and mutant zebrafish showed photosensitivity in the two light-dark cycles, the mutant zebrafish had a more intense response to lighting changes in the first light-dark cycle than WT zebrafish, whereas no statistically significant differences in photosensitivity were observed in the second light-dark cycle (Fig. 2F).
In addition, we measured the thigmotaxis of WT and mutant zebrafish under light conditions by recording the percentage of time spent/distance moved in the inner zone (Fig. 2G). The nomo1 mutant zebrafish exhibited an edge preference under continuous illumination, indicating increased thigmotaxis behavior (Fig. 2H).
The 15 dpf and 30 dpf nomo1-/- zebrafish showed increased locomotion
We also analyzed the locomotion of nomo1-/- zebrafish during development. A different sized container was used for 15 dpf and 30 dpf zebrafish, and the trajectories of the zebrafish are shown in Fig. 3A and 3C. The diagram shows a trend in the swimming behavior of WT and mutant developing zebrafish during the experimental period (Fig. 3B, D, and E). The locomotor activity of 15 dpf and 30 dpf zebrafish was significantly enhanced. The average distance moved per minute was not significantly different between nomo1-/- zebrafish and WT zebrafish at 2 mpf (Fig. 3F).
Juvenile nomo1-/- zebrafish exhibited autism-like behaviors
The social preference behavior (Videos S1-S2) and shoaling behavior (Videos S3-S4) were visually presented in the form of videos. The nomo1+/+ zebrafish swam along the social area throughout the experiment, whereas the nomo1-/- zebrafish swam in a dispersed and random manner. The heat map in Fig. 4B-C was obtained by analyzing the trajectory of the zebrafish in the mating tank. The ratio of time spent/distance moved in the social area was statistically significantly lower for nomo1-/- zebrafish than for nomo1+/+ zebrafish (Fig. 4D-E). We used one of the videos to analyze the trajectory of the zebrafish. The shoaling behavior was detected to assess the social skills of WT and nomo1-/- zebrafish [32]. Generally, the group WT zebrafish swam together in an open-field test, reflecting the social nature of the species. The nomo1-/-zebrafish showed an increased inter-individual distance with their companions than the nomo1+/+ zebrafish, indicating that the nomo1-/-zebrafish had a weaker clustering ability (Fig. 4G).
We also used videos to display the different types of repetitive behaviors of 2 mpf mutant zebrafish, including back-and-forth motion (Video S5), stereotypic movement (Video S6) and large circular movement (Video S7). The trajectories of the repetitive behaviors are shown in Fig. 4H. The numbers of different types of repetitive behaviors were counted. The mutant zebrafish exhibited more of these behaviors than the WT zebrafish and displayed a repetitive behavior-related pattern. The back-and-forth motion was significantly increased in mutant zebrafish compared to WT zebrafish (Fig. 4I). However, the number of stereotypic movements and large circular movements were not significantly different between nomo1-/- and WT zebrafish (Fig. 4I).
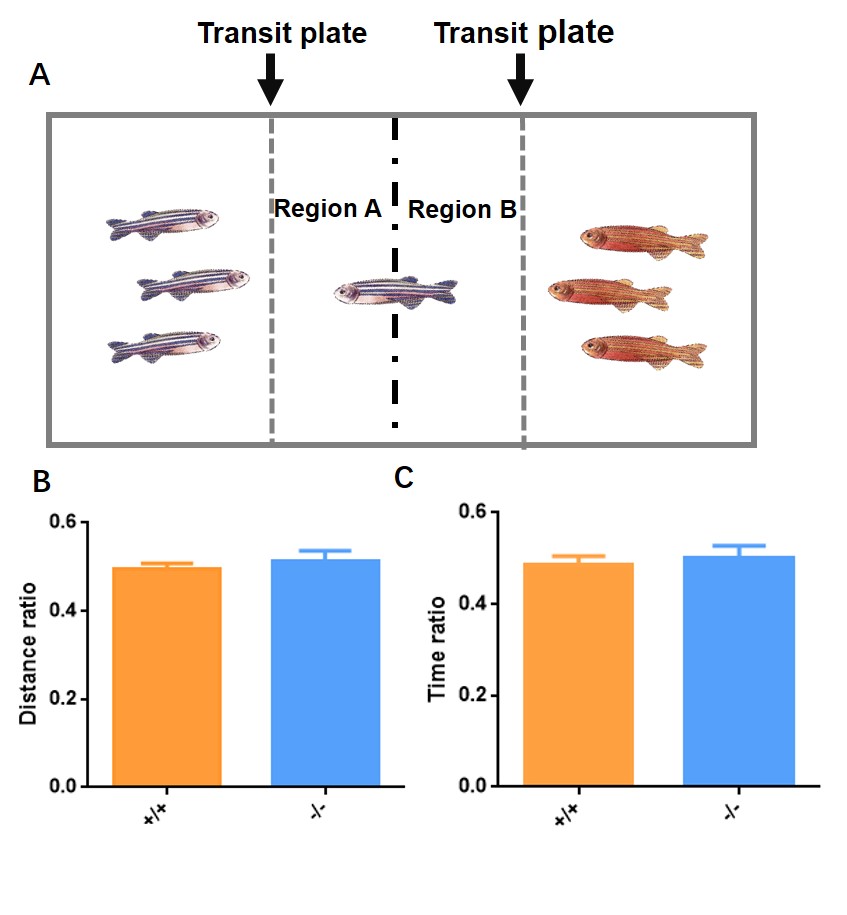
The WT zebrafish (Video S8) and nomo1-/- zebrafish (Video S9) displayed similar tendencies in kin preference region and non-kin preference region. The time spent/distance moved ratio of the mutant was the same as nomo1+/+ zebrafish (Fig. S3B-C).
Loss-of-function of nomo1 affected the midbrain and hindbrain during zebrafish development
At early stages, abundant nomo1 mRNA is transcribed in the endoderm and anterior mesendoderm [9]. In our study, changes in the patterning of the endoderm marker sox17 and mesoderm marker hgg1 were detected in nomo1-deficient mutants. Loss-of-function of nomo1 resulted in a different expression pattern of hgg1 (Fig. 5A-B) (50% of cases, n=20). In our study, nomo1 mutant embryos displayed an increased number of sox17-positive cells (Fig. 5C-D, arrows) (62% of cases, n=18).
Because nomo1 is important for the development of the early mesendoderm, we examined various key neural development-related genes in WT and mutant zebrafish. The expression levels of the genes (HuC, neurog1, islet1, egr2b and foxb1a) in nomo1 mutant zebrafish were not detectably different compared with the levels in WT zebrafish at 24 hpf (Fig. 5E), whereas the mRNA expression levels of the genes decreased significantly in the zebrafish at 48 hpf (Fig. 5F). We used RT-qPCR to detect the differences in expression levels in zebrafish, and then a semi-quantitative analysis was performed using WISH to verify the expression pattern. The nomo1-/- zebrafish exhibited significant differences in brain development compared with the WT, which was characterized by an absence of expression in midbrain and hindbrain at 48 hpf (Fig. 5G-L, arrows).
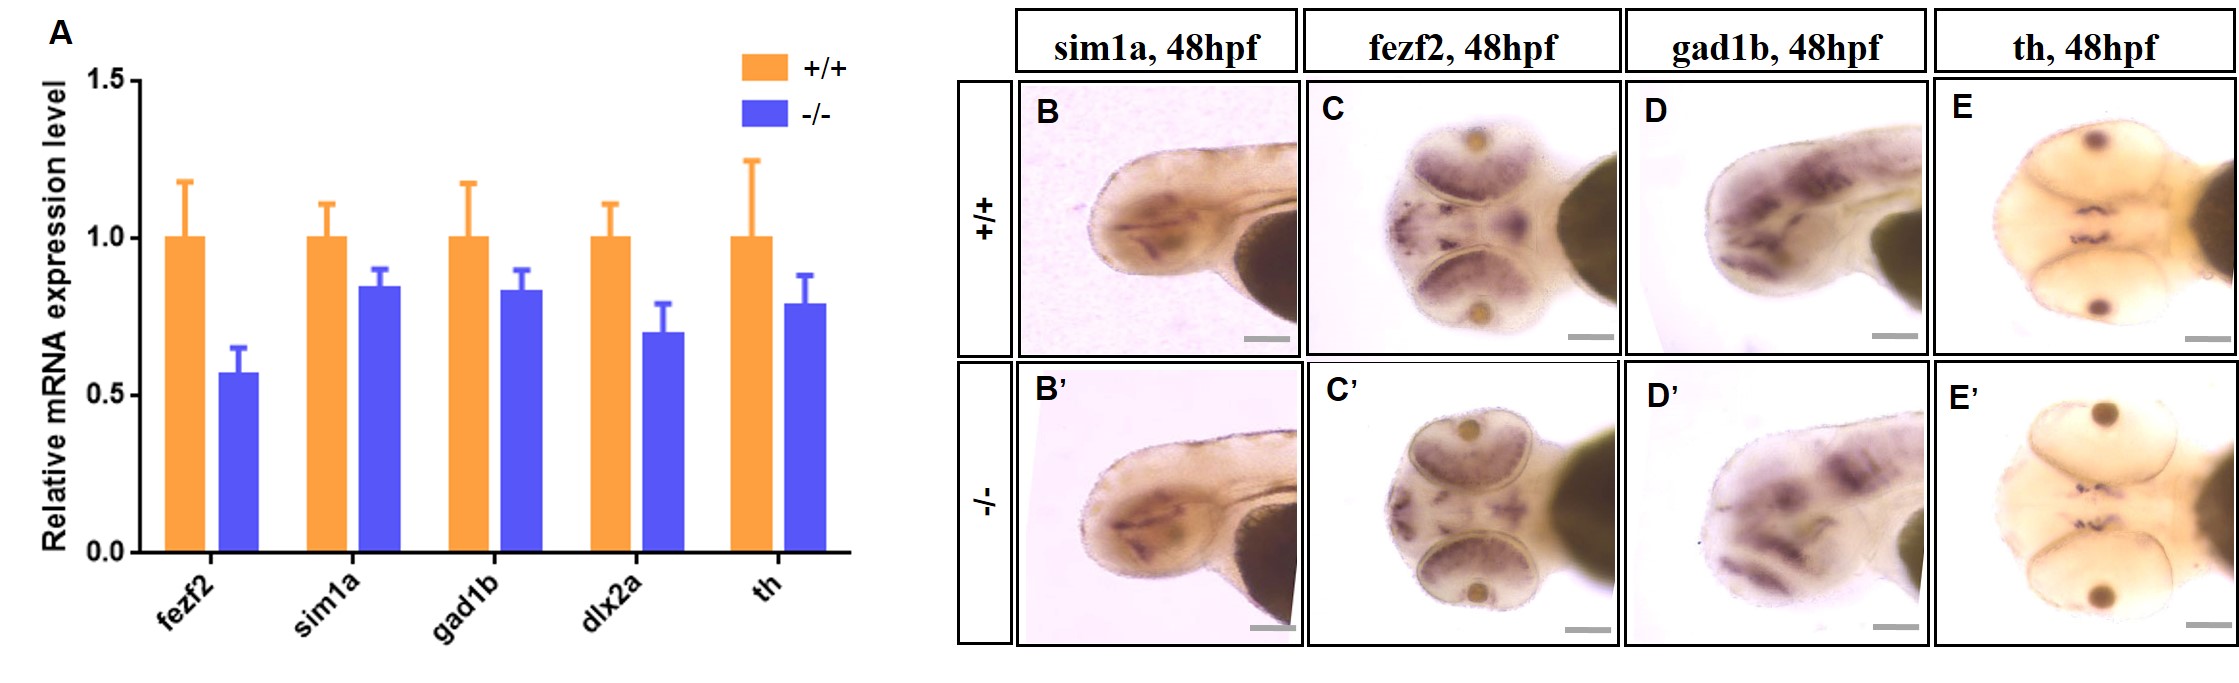
We performed HE staining of brain slices from adult zebrafish to determine whether the abnormalities in the brains of larval zebrafish persist throughout development (Fig. 5M-P). HE staining showed that the nomo1-deficient zebrafish had an abnormal brain structure during development. The changes were mainly manifested as loose and fragile brain tissue, and the midbrain and hindbrain regions of mutant zebrafish exhibited enlarged interstitial spaces. However, staining for forebrain-related markers, such as fezf2, and dopaminergic neurons did not reveal differences between WT and nomo1-/- larvae, indicating that the nomo1 deficiency did not substantially alter forebrain and dopaminergic neuron development (Fig. S2). Based on the aforementioned microscopic morphology at the overall cellular level, we concluded that nomo1 regulates early neural developmental patterning in vivo, strongly influencing the development of the midbrain and hindbrain in zebrafish.
Expression levels of neurotransmitters and metabolites were altered in the brains of juvenile nomo1-/- zebrafish
We examined neurotransmitters and metabolites in juvenile zebrafish brains to reveal the mechanism underlying the autism-like behaviors. Here, we focused on the following 13 neurotransmitters and their metabolites using the LC-MS/MS method: r-amino-butyric acid, levodopa, DA, epinephrine, 5-HIAA, serotonin, 3-methoxytyramine, acetylcholine, histamine, normetanephrine, tyramine, glutamate, and glutamine. Fig. 6A shows the cluster relationships of each metabolite between nomo1+/+ and nomo1-/- zebrafish, and the tree structure at the left shows the clustering relationship of each group. The results of the hierarchical clustering analysis showed increased levels of ten neurotransmitters and their metabolites in nomo1-/- zebrafish compared with nomo1+/+ zebrafish. Detailed descriptions of the quantities of the different metabolites are shown in Fig. 6B, and the expression of γ-aminobutyric acid, levodopa, epinephrine, serotonin, 3-methoxytyramine, histamine, normetanephrine, tyramine, glutamate, and glutamine was significantly higher in nomo1-/- zebrafish than in nomo1+/+zebrafish.
Another method for detecting neurotransmitters, HPLC analysis, produced the same trend. In nomo1-/- zebrafish, the levels of serotonin and norepinephrine were obviously increased (Fig. 6C). Although the levels of dopamine and its metabolite DOPAC showed an increasing trend, the difference was not statistically significant (Fig. 6C).
The transcriptome analysis showed different gene expression patterns in the WT and mutant zebrafish
The juvenile zebrafish were selected for the transcriptome sequencing analysis to further study the functional mechanism between ASD-like phenotypes and nomo1 deficiency at the genetic level. A volcano map visually shows the distributions of DEGs for each of the comparisons. Two hundred ninety-two genes were downregulated, 254 genes were upregulated, and the expression of 546 genes was changed at the transcriptional level in mutant zebrafish (Fig. 7A). The altered DEGs are listed and their p-values are shown in Table S2. We performed GO annotation and KEGG pathway analyses to understand the functions and roles of DEGs. The GO annotation classification chart revealed the functions of DEGs in biological processes, cellular components and molecular functions (Fig. 7B). Through the classification and statistical analysis of KEGG signaling pathways, nomo1 was shown to participate in the biological processes of metabolism, cellular function, intestinal immunity, and pathogen infection (Fig. 7C).
A functional analysis of the DEGs revealed that nos2a and hbba1 were upregulated, whereas rnps1, ass1, slc39a8, slc43a2b, cfap100, slc15a2 and entpd8 were downregulated in mutant zebrafish compared to their expression in WT zebrafish. RT-qPCR was used to verify the mRNA expression levels of DEGs and confirmed that the difference in gene expression was consistent with the sequencing results (Fig. 7D).
The decreased locomotion of 7 dpf zebrafish was recovered by the neuroactive drug PTZ
We applied the neuroactive drug PTZ, an antagonist of the γ-aminobutyrate (GABA) receptor, and measured the locomotor activity of larval zebrafish to explore the effects of drugs that alter neurological disease-related phenotypes. Here, 8 mM PTZ was utilized. The experiment lasted for 60 min and was conducted under continuous illumination. The zebrafish were maintained in a 24-well plate at a room temperature of 28°C room. The movement trajectories of zebrafish (nomo1+/+, nomo1-/-, nomo1+/++PTZ, and nomo1-/-+PTZ) in the experimental period are shown in Fig. 2I. Upon exposure to PTZ, WT zebrafish exhibited increased locomotion, similar to our previous study [20]. The locomotor activity of mutant zebrafish treated with PTZ increased significantly compared with nomo1-/- zebrafish, and a statistically significant difference in locomotor activity was observed under continuous illumination conditions (Fig. 2J).