3.1 Overview of current global urologic cancer epidemiology
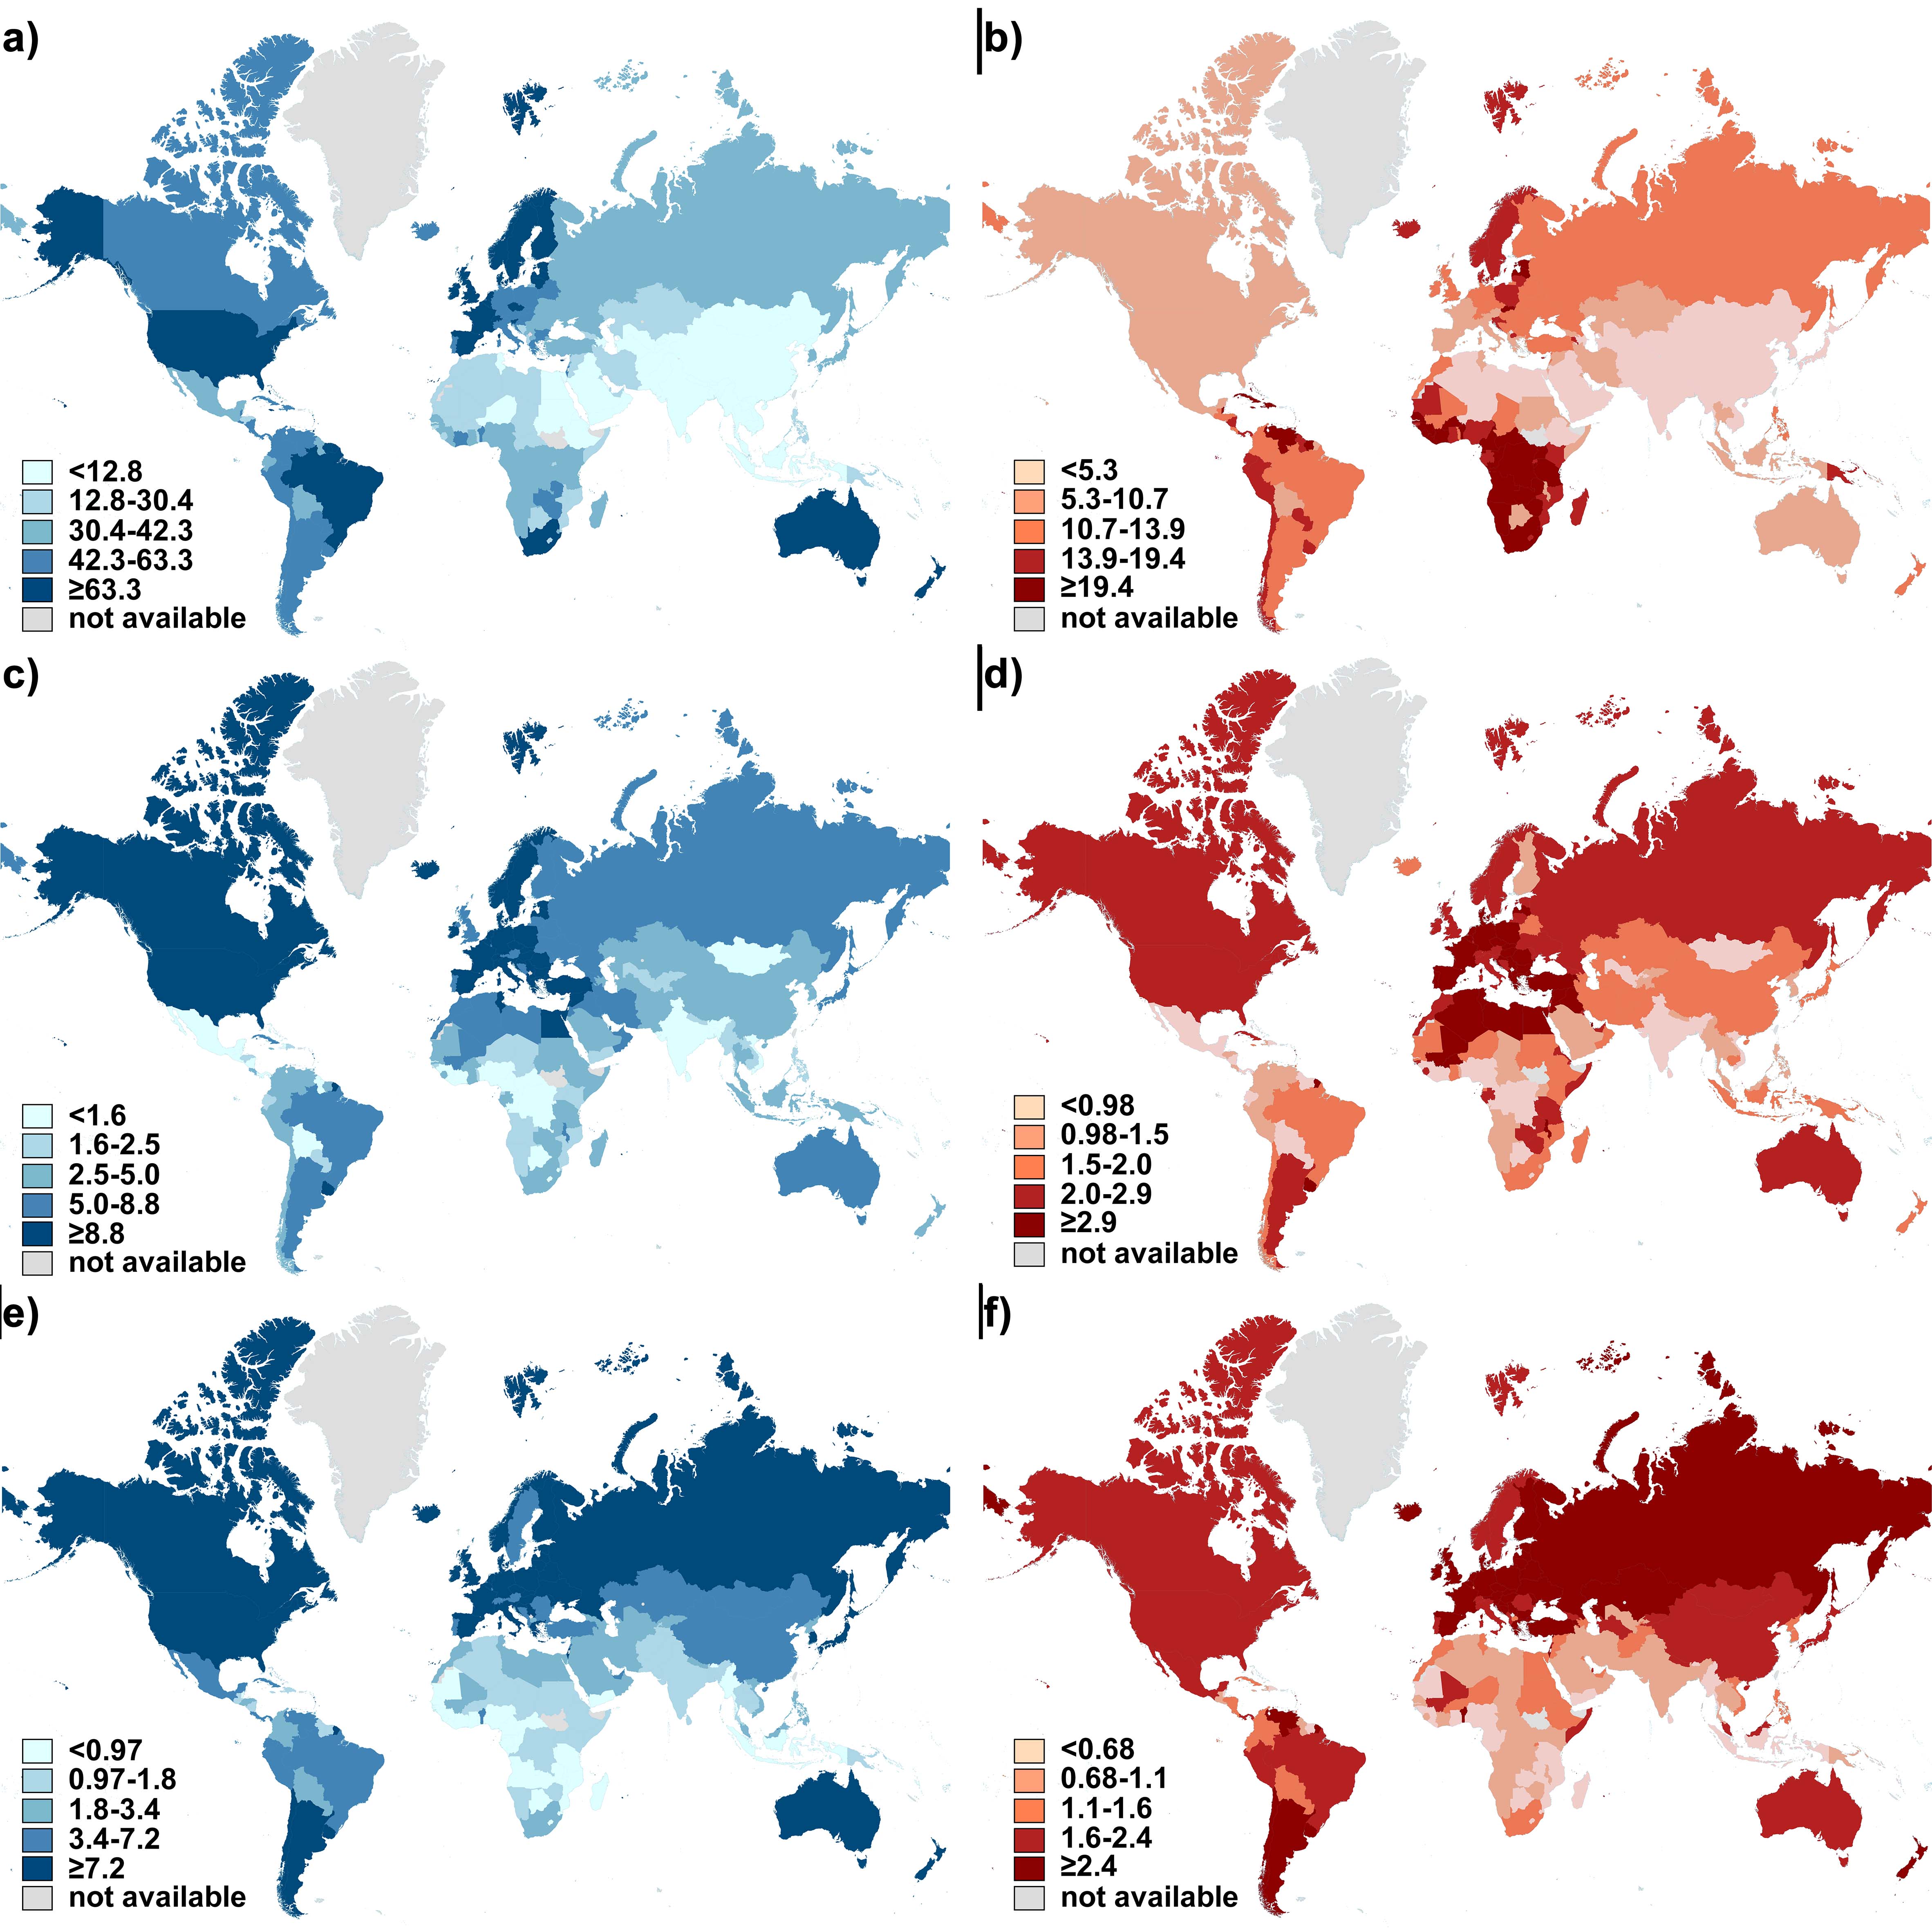
Development levels of countries were classified into 4 classes according to HDI values by the UNDP (Fig. 1a). The global age-standardized incidence and mortality rates of prostate, bladder and kidney cancer in 2018 were presented separately (Fig. S1a-f). Mortality-to-incidence ratios (MIRs) were calculated and their global distribution was depicted in the form of world maps (Fig. 1b-d).
Prostate cancer ranked as the second most frequent cancer in men. The top countries with the highest incidence rates of prostate cancer were all in very-high HDI group (Fig. S1a), including Europe (e.g., Ireland, Estonia, Norway, Sweden, France, United Kingdom, etc.), North America (United States), Australia/ New Zealand, and Barbados. However, mortality rates did not follow those of incidence. The highest mortality rates fell mainly in countries with lower HDI (Fig. S1b), including the Caribbean and Africa. The lowest MIRs were achieved in highly developed countries (Fig. 1b), such as France, Ireland, Italy, Spain, United States. Whereas low-to-medium HDI countries owned the highest MIRs (Afghanistan, Guinea, Pakistan, Liberia). Similarly, bladder and kidney cancer was most common to happen in high-to-very high HDI regions (Fig. S1c, 1e), especially European countries. However, the top 10 countries with highest MIRs of bladder cancer were all from low-HDI group in Africa (Fig. 1c, 1d). The lowest MIR was from very-high HDI group.
3.2 The correlation between urologic cancer MIR and national HDI
The global MIR of prostate, bladder and kidney cancer in 2018 was 0.358, 0.251, and 0.410, respectively (Fig. 1b-d). We found that as the level of national HDI increased, the corresponding urologic cancer MIR was relatively lower, with strong correlation (r < 0, p < 0.0001). We also applied nonlinear regression analysis on data, verifying the existence of a “dose-to-response” inhibitory effect between HDI values and MIRs (Fig. 2a-b, d-e, g-h). The HDI values at half maximal MIR (HDI50) of prostate, bladder and kidney cancer in 2018 was 0.639, 0.704 and 0.736, respectively.
We further compared the MIRs of urologic cancer among 4-tier HDI groups and clarified the persistent disparities associated with HDI levels (p < 0.0001, One-way ANOVA). Take prostate cancer in 2018 for example, the mean MIR in very-high HDI countries (0.224) was significantly lower than that in high- (0.424), medium- (0.522), or low- (0.641) HDI countries (p < 0.0001, Tukey's post hoc test; Fig. 2c). Similar results were obtained in other cancer sites (bladder, kidney) as well as data in 2012 (p < 0.0001, Tukey's post hoc test; Fig. 2f, i).
3.3 Association between incidence rates of urologic cancer and HDI
Since the fact that urologic cancers tended to happen more in high-to-very high-HDI countries, we also applied correlation analysis on the association between incidence rates and HDI. It was demonstrated that national incidence rates in urologic cancer all had strong correlation with corresponding HDIs via linear regression (r > 0, p < 0.0001; Fig. 3a-c).
3.4 The impact of HDI on 5-year survival of prostate cancer
The 5-year net survival rates were available in 57 countries for prostate cancer in CONCORD-3 program (Fig. 4a). Similar to MIRs, patients diagnosed during 2010-2014 from very-high-HDI countries like Cyprus (99.2%), United States (98.1%) and Israel (95.6%) topped in survival rates. While countries with limited developments, like South Africa (37.8%), India (44.3%) and Nigeria (58.7%), fell far behind other regions. Cross-national analysis demonstrated that survival rates of patients diagnosed in 2010-2014 correlated positively with HDI values via linear regression (r = 1.084, p < 0.0001; Fig. 4b). Accordingly, the survival rates correlated inversely with national MIR (r = -0.730, p < 0.0001; Fig. 4c).
3.5 Temporal transition of urologic cancer burdens and outcomes fromm 2012 to 2018
3.5.1 Prostate cancer
Incidence and mortality rates of prostate cancer have risen considerably since the end of last century [2]. Nevertheless, it should be noted that between 2012 and 2018, new prostate cases decreased from 1276706 to 1111689, and fell from 358989 to 307417 in deaths. In general, the MIR of prostate cancer did not change much during the past 6 years (0.251 vs 0.259). We plotted national HDIs and MIRs in 2018 and 2012 together and noticed similar distributions (Fig. 5a). Notably, there is an evident change that linear regression line has shifted to the lower-left direction from 2012 to 2018, most obviously among countries with lower HDIs. Furthermore, within both low- and medium- HDI groups, the national MIRs in 2018 decreased significantly in comparison to the 2012 data (p < 0.0001 for both groups; Fig. 2c). In high HDI groups, there was only decreasing tendency without significance (0.424 vs 0.460, p > 0.05; Fig. 2c). The survival rates generally increased, with only 7 out of 57 countries dropped more than 1% (p < 0.05) (Fig. 5b; Table 1).
3.5.2 Bladder cancer
New bladder cancer diagnoses shrank nearly a quarter between 2012 and 2018 (549 393 vs 429 793). It is remarkable that MIR of bladder cancer in 2018 had a slight increase when compared with 2012, though not significantly (0.358 vs 0.333; p > 0.05, Fig. 2f, Fig. 5c). There was also only tiny fluctuation between MIR of 2012 and 2018 within each specific HDI group (Fig. 2f).
3.5.3 Kidney cancer
The incidence of kidney cancer also reduced during 2012-2018 (337 860 vs 403 262). In the scatter diagram of HDI-MIR, current MIR of kidney cancer also shifted in the direction when comparing with 2012 (Fig. 5d). Remarkably, two regression lines were nearly parallel (r2018 = -1.153, r2012 = -1.231; p < 0.01). Meanwhile, MIRs of kidney cancer declined overall, across all development status (p < 0.01 for the low-, p < 0.0001 for the medium-, p < 0.001 for the high-, and p = 0.23 for the very-high-HDI group; Fig. 2i).