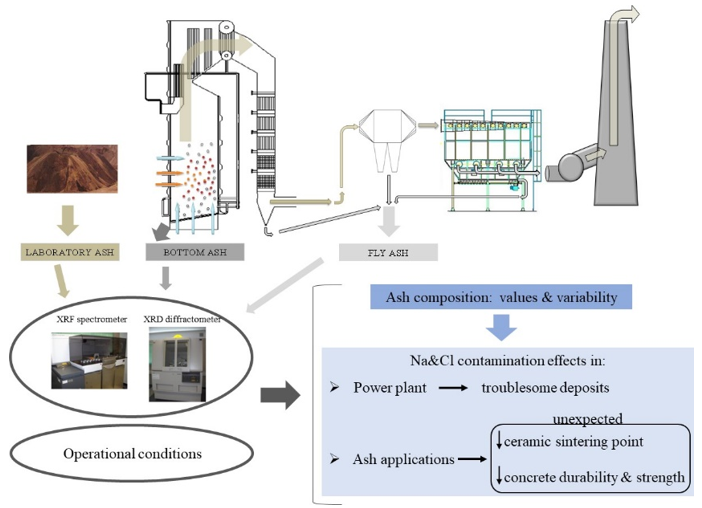
With the aim to prevent possible power plant malfunction due to the feedstock properties and suggest possible ash applications, feedstock samples and bottom and fly ash samples collected along more than a year in a 16 MW suspension-fired boiler power plant, fed mainly with pulverized exhausted olive cake (orujillo), were studied. A detailed characterization of fly and bottom ash has been done, as well as a seasonal evolution study. Altogether in order to find any trend on the ash composition changes and to study the relationship between ash (both fly and bottom fractions) and, on the one hand, the feedstock composition, and on the other hand, the troublesome deposit formation. A relationship between deposit growth and higher Cl and Na content in the feedstock has been noticed, showing the need for some control on these feedstock’s components. The high Cl and Na content is attributed to external contamination. Furthermore, the high Al content in the feedstock and the strong relationship between Al, Fe and Si (indicating a common origin) suggest some biomass soil contamination. However, no relationship was observed between troublesome deposit formation and the hypothesized biomass soil contamination.
Research Article
Effect Of Exhausted Olive Cake Contamination On Fly And Bottom Ash In Power Plants
https://doi.org/10.21203/rs.3.rs-550623/v1
This work is licensed under a CC BY 4.0 License
Journal Publication
published 25 Oct, 2021
Read the published version in Waste and Biomass Valorization →
You are reading this latest preprint version
Biomass residues from olive oil industries is becoming a valuable source of renewable energy. This study contributes to increase the knowledge on the relationship between this biomass and its resulting ash. Emphasis is made on the effect of the biomass variability and the possible sources of contamination. This knowledge may benefit the management of power plants, helping find the optimal operational parameters, defining the biomass components which should be carefully controlled, and providing the appropriate ash characteristics for their industrial valorization.
A very essential requirement to control the deposit growth in biomass boilers is to know the characteristics of the biomass ash forming matter and of the different ash fractions: bottom ash, fly ash collected in the gas cleaning system (fly ash in our study) and fine fly ash escaping by the stack (dust in this paper) generated at a specific boiler. The characteristics and quantity of the ash fractions are dependent on the ash-forming matter from the feed biomass and on the boiler type and operational conditions. Several studies have been conducted on this topic. Bashir et al. [1] showed how straw fly ash differs according to the boiler (grate or suspension one). They found that fly ash from straw suspension firing contains high contents of Si, K and Ca, while fly ash from straw grate firing is rich in the volatile elements K, Cl and S [1]. This is mainly because in grate boilers the relative importance of finest particles (composed mainly of K, S, Cl) in fly ash is high, whereas in suspension boilers the importance of this fraction is lower due to the large amount of ash matter dragged by the flue gas, and finally enclosed in the fly ash (the percentage of fly ash in suspension boilers is around 75–80 % in front of the percentage in grate boilers < 20 % [2]). However, regardless the boiler or biomass employed, an enrichment in volatile species (K, Cl, S, Zn, Pb, Cd) in fly ash and a depletion in bottom ash are often shown with respect to the original ash forming matter (e.g. [1–7]). Such enrichment is even higher in grate boilers. Nevertheless, a slight depletion of K in fly ash of pure straw, burned in suspension boiler conditions was detected by Nordgren et al. [6]. Fly ash volatile enrichment depends on the amount of volatile compounds in the biomass, on their previous devolatilization, on the subsequent homogeneous and heterogeneous condensation, on the amount of non-volatile species dragged by the gas and on the efficient retention of finest particles by the ash recovery systems. These factors are strongly related to the kind of boiler and operational conditions (which affect the contact likelihood between solid and gaseous phases (strongly dependent on boiler type [6]), the % of fly ash, exit temperatures, filtering efficiency…) and also on biomass properties.
A strategic energy source in Europe, and especially in the southwest European Mediterranean areas, is exhausted olive cake (orujillo). Its high heating value (lower heating value between 14 and 17.5 MJ/kg ar -as received-) and its low moisture (it is usually marketed with moistures between 9 and 16% ar) make it a feasible fuel to be used as unique or main fuel, which is a significant practice in these areas. The main applications are medium-sized boilers to generate steam for on-site thermal use at olive oil industries and also power plants with or without steam cogeneration (in Andalusia, Spain, plants with power generation only, ranging from 8 to 16 MWe [8]). Furthermore, it has been used in co-firing in large coal plants in Europe [9–11] because of its easy grinding, which allows its incorporation in coal pretreatment systems with minimal modifications [11], and because of its easy feeding, with no flowing problems given its granular shape and particle size (mostly below 8 mm). Despite coal firing is disappearing in the EU and in UK due their climatic impact, much of the rest of the World has energy programs that still depend on coal for the near future, and orujillo could be a good renewable co-fuel to be used.
Orujillo is composed of de-oiled peel, pulp and kernels from olive fruit. It is the final residue/by-product produced in olive oil extraction. It is a de-oiled and dried solid residue obtained after extraction with solvents of the residual olive oil from the olive cake, which is a residue of the olive oil mechanical extraction process. A remarkable characteristic is its high potassium and chlorine content (K = 1.75% and Cl = 0.1–0.4 % dry basis [12]) which have great influence on fouling and corrosion processes [13–17]. Therefore, boiler conditions should be carefully defined in order to avoid uncontrolled deposit growth and malfunctions. However, power plants using this feedstock are prepared for it. Problems arise when orujillo with higher content of “problematic” elements arrive. Orujillo with higher content in chlorine and sodium derived from external contamination (for example, an eventual source of NaCl contamination is the exposition to sea water or road salting [12, 18]), or specific treatments used in olives being dressed with salt (NaCl solution) or soda (NaOH solution, i.e. lye) for table olives [19–20] could occasionally arrive. When this occurs, serious problems of uncontrolled deposit growth often arise in the boilers [21].
Limited data on recovery ash is available from large scale biomass suspension boilers [1, 2, 7, 22–25] and it is mainly focused on fly ash. Therefore, the major objective of this study is to present detailed characterization of fly and bottom ash obtained during more than a year campaign in a suspension boiler, in order to find any trend on the ash composition changes, to study the relationship between ash (both fly and bottom fractions) and feedstock composition, and to find correlations between the elements composing both of them. This knowledge has two benefits: a) to prevent boilers from biomass that could eventually cause harmful deposit formation (in fact deposit formation associated with contamination has been detected in the analyzed period) and b) to find possible applications for the fly and bottom ash. Moreover, although neither the ash content nor the composition of the feedstock are usually considered in the fuel quality control procedure implemented in power plants because of their high cost [26], the results of this work could be useful to determine which ash components should be measured periodically (maybe in external labs), at least when changing the fuel supplier or the fuel origin.
Power Plant
Biomass and combustion residues (fly and bottom ash) were sampled from a 16 MW suspension-fired boiler power plant (Energías de la Mancha, S.A) located in Villarta de San Juan, Spain. The fuel usually employed is a mixture of: ≥ 95 wt.% of exhausted olive cake (orujillo) and ≤ 5 wt.% of other pulverized biomass (wood, exhausted grape cake, almond shell and others). Table 1 summarizes the plant operational characteristics, including the main fuel characteristics: kind of fuels, particle size and usual moisture. Figure 1 presents a scheme of the boiler and ash recovery system. Around 80 % of the fly ash was collected at the bag filter, 15 % at the multicyclone and 5 % at the boiler final collector.
|
Normal operation |
|
|---|---|
|
Unit capacity |
55 MWth |
|
Electrical capacity |
16 MW |
|
Usual gross electrical output |
14–14.5 MW |
|
Usual steam production |
61–62 tons/h |
|
Total air flow rate |
60–66 tons/h |
|
Superheater steam temperatures |
280 to 450 ºC |
|
Flue gas temperatures at superheater inlet |
650–700 ºC |
|
Flue gas temperatures at boiler generator bank outlet |
390–420 ºC |
|
Soot blowing (of dry steam) frequency |
3 to 6 times per 8h |
|
Fuel |
Primary: Orujillo ≥ 95 wt. % Secondary: wood, forest chips, exhausted grape cake, almond shell etc. ≤ 5 wt. % |
|
Feed biomass particle size |
≤ 1.2 mm |
|
Feed biomass moisture |
12–17 wt. % (wet basis) |
|
Usual biomass consumption |
12.5 tons/h (wet basis) |
|
Biomass consumption per yeara |
91.2∙103 tons/year (wet basis) |
|
Fly ash production per yeara |
6.3∙103 tons/year (wet basis) |
|
Bottom ash production per yeara |
2.5∙103 tons/year (wet basis) |
| a Mean values during the fifteen-month period study | |
Sampling
A combined sample for biomass, for fly ash and for bottom ash were taken once a month during 15 months, plus 8 fly ash samples during 8 additional months. To get a representative sample, the biomass combined sample was composed of increments of all the biomass consumed during a period of time (about one day) and the corresponding fly and bottom ash increments were taken assuring that they came from the combustion of this biomass. Depending on the sampling time, every combined sample consisted of 8 to 11 increments. For the different kinds of samples, the sampling plan was:
-
The biomass increments were taken at the burner’s fed hoppers during the filling up process of the ash storage silo according to the scheme shown in Fig. 2. Sampling started with an empty ash storage silo and finished one hour before the new silo discharge to ensure the concordance between biomass and fly ash sampled.
-
Bottom ash increments were taken at the bottom ash discharge following the same biomass scheme (Fig. 2). Bottom ash is composed of two fractions, fine and coarse, and only coarse fraction was taken. The coarse fraction represents 75% of total bottom ash.
-
Fly ash increments were taken at constant time intervals during the discharge of ash from the storage silo.
The total time for sampling was not always the same because it was dependent on the arrival time of the truck transporting fly ash, which is variable.
Test and Laboratory Equipment
Table 2 summarizes the methods and the equipment used to analyze biomass and combustion residues (bottom and fly ash). Below some of the analysis are described with more detail.
Ash chemical composition was determined with semiquantitative X-ray fluorescence technique (XRF), on powdered sample. Loss on ignition (LOI) was determined by heating some ash powders in a muffle furnace at 1100 ºC for 5 h. Laboratory ash samples were produced from the biomass samples in order to determine their chemical composition. Standard EN 14775 was followed with a final temperature of 550ºC.
The crystalline phases were detected in the ash with a powered X-ray diffractometer (X'Pert MPC, Panalytical) using Cu Kα1 radiation. The scan was run from 3° to 75° (2-theta-scale), with increments of 0.05° and a counting time of 0.5 s per step. Identification of compounds was made using the Joint Committee on Powder Diffraction Standards (JCPDS) database. Diffractograms obtained are complex multicomponent systems with too many peaks in which different compounds can be overlapped. Therefore, for a better determination of the crystalline phases, the samples were water washed to separate water-soluble phases (such us chlorides, sulfates, and some carbonates) from other insoluble phases (such us quartz, silicates and some phosphates) which remain in the solid residue. Then, comparing diffractograms of the original sample from that of the insoluble fraction, it is easier to identify the peaks from soluble phases, since they are not present anymore in the latter diffractogram.
|
Standard |
Method |
Equipment |
|||
|---|---|---|---|---|---|
|
Biomass |
|||||
|
Proximate analysis: |
|||||
|
volatiles |
EN 15148 |
Heat out of contact with air at 900 ºC |
Muffle furnace |
||
|
ash |
EN 14775 |
Heat in air following a ramp heating program up to 550 ºC |
Muffle furnace |
||
|
Ultimate analysis: |
|||||
|
C, H, N / S |
EN 15104 / EN 15289 |
High oxygen combustion - Gas analysis: - C,H,S infrared absorption - N thermal conductivity |
Elemental analyzer (LECO - TruSpec) |
||
|
Cl |
EN 15289 |
Biomass microwave acid digestion - Liquid Ion chromatography analysis |
Microwave - Ion chromatograph (883 compact IC Pro, Metrohm) |
||
|
Ash samples: biomass ash (laboratory asha) and combustion residues (fly and bottom ash) |
|||||
|
Chemical composition (expressed as oxides): Al, Ca, Fe, K, Mg, Na, P, Si, Cl, S |
- |
X-ray fluorescence (XRF) |
X-ray fluorescence spectrometer (Magix Pro, Panalytical |
||
|
Crystalline phases |
- |
X - ray diffraction (XRD) |
X-ray diffractometer (X'Pert MPC, Panalytical) |
||
| a Biomass laboratory ash made at 550 ºC | |||||
Statistical Analysis
The statistical analysis was performed by using Statistical Package for Social Sciences (SPSS version 24) using hierarchical cluster analysis. Clustering techniques involve measurement of the distances (differences) and the resemblances between the samples to be clustered. The samples are grouped in clusters according to their similarity. In this work, similar groups of monthly ash samples composition were searched considering the following compounds: SiO2, Al2O3, Fe2O3, MgO, CaO, Na2O, K2O, P2O5, SO3 and Cl. The results were standardized using the Ward Grouping Method with Square Euclidean Distance as show in Eq. 1 where a an b are two different samples. The results were analysed from their respective dendograms.
 Eq. 1
Eq. 1
Since only fly ash samples were taken for all the period studied, the hierarchical cluster analysis were performed only with this type of samples.
Moreover, coefficient of variation (Cv), defined as the ratio of the standard deviation (σ) to the mean value (µ, Eq. 2), was used to express the variability of the different properties at the biomass and ash collected in different months. The higher Cv, the higher heterogeneity of the variable.
 Eq. 2
Eq. 2
Feedstock and Recovery Ash Composition: Values and Variability
Chemical Composition
Physicochemical properties of the feed biomass consumed during the 15 months are summarized in Table 3 and the chemical composition of biomass ash is shown in Fig. 3. Unfortunately, when the samples taken in December (1st year) and August (2nd year) were inspected, they were rotted, so there are no results from these samples. Values obtained show that C, H, N, S, volatile matter, and calorific value obtained in all the tests are quite constant over time (their respectively coefficients of variation (Cv) are less than 10%), while Cl and ash content are more variable, particularly chlorine content which has an extremely high coefficient of variation, 41 %. The average ash content at 550°C (11.11 % wt.) is close to the maximum of the typical range shown in the literature for exhausted olive cake [12], the main component of biomass samples in this plant (≥ 95 %). Mean contents of carbon, hydrogen, nitrogen, sulfur, chlorine and oxygen are within the typical range for orujillo. However, the sample from November (1st year), has an extremely high concentration of chlorine (Table 3) and sodium (Fig. 3), more than expected for orujillo and the other biomass used in the feed mixture [12]. This extremely high Cl and Na content also occurs during December (1st year) and was reflected on the fly ash composition (Fig. 4). The unusual high chloride and sodium content should be related to an orujillo contamination, which could derive from different causes. For example, the infrequent employment of table olives dressed with sodium chloride and, in some cases, with lye, in the olive oil production process. The process to obtain table olives from fresh olives increases the Cl and Na contents. For instance, Na content of olive pulp and peel varies from around 10–40 ppm of fresh olive [27] to 5700–16600 ppm for table olives (value variable depending on origin and treatment) [20]. Spanish standard [28] prevents from the thermal use of fuels derived from table olives. Other eventual source of Na and Cl contamination are the exposition to sea water or road salting [12, 18] or other non-controlled contaminations.
This period of unusual high Cl and Na content (November (1st year) and December (1st year)) caused a huge trouble at the boiler, leading to an uncontrolled superheater deposit growth and to a complete flue gas blockage and plant shutdown in December 1st year. Therefore, it is necessary to include the control of Cl and Na content in the plant feedstock´s quality control. Traditionally, power plants control fuel moisture [26] and, some of them, heating value. However, these measurements cannot alert from high Cl and Na contents.
|
Month |
Year |
Proximate analysis |
Ultimate analysis |
Heating value |
||||||
|---|---|---|---|---|---|---|---|---|---|---|
|
Volatile matter (VM) |
Ash (A) |
C |
H |
N |
S |
Cl |
High Heating Value (HHV) |
Low Heating Value (LHV) |
||
|
Weight % |
MJ/kg |
|||||||||
|
November |
1st |
70.66 |
8.59 |
49.40 |
6.27 |
1.50 |
0.12 |
0.56 |
20.90 |
19.54 |
|
December a |
1st |
- |
- |
- |
- |
- |
- |
- |
- |
- |
|
January |
1st |
70.64 |
9.10 |
50.39 |
5.81 |
1.56 |
0.11 |
0.24 |
20.17 |
18.91 |
|
February |
1st |
70.49 |
10.10 |
49.55 |
5.51 |
1.64 |
0.10 |
0.26 |
19.50 |
18.31 |
|
March |
2nd |
69.80 |
12.83 |
48.29 |
5.71 |
1.55 |
0.11 |
0.18 |
19.28 |
18.11 |
|
April |
2nd |
69.89 |
11.37 |
48.69 |
5.69 |
1.90 |
0.12 |
0.33 |
19.41 |
18.25 |
|
May |
2nd |
69.70 |
12.44 |
48.03 |
5.68 |
1.59 |
0.13 |
0.25 |
19.35 |
18.20 |
|
June |
2nd |
69.46 |
12.16 |
48.18 |
5.63 |
1.48 |
0.12 |
0.23 |
19.36 |
18.20 |
|
July |
2nd |
70.08 |
11.27 |
48.94 |
5.73 |
1.61 |
0.13 |
0.23 |
19.70 |
18.52 |
|
August a |
2nd |
- |
- |
- |
- |
- |
- |
- |
- |
- |
|
September |
2nd |
71.22 |
9.93 |
49.00 |
5.95 |
1.62 |
0.13 |
0.20 |
20.28 |
18.99 |
|
October |
2nd |
68.73 |
12.23 |
48.58 |
5.83 |
1.67 |
0.14 |
0.23 |
20.11 |
18.85 |
|
November |
2nd |
68.99 |
12.29 |
48.15 |
5.84 |
1.61 |
0.14 |
0.21 |
19.93 |
18.67 |
|
December |
2nd |
66.37 |
12.15 |
48.99 |
5.55 |
1.67 |
0.13 |
0.17 |
19.90 |
18.70 |
|
January |
2nd |
69.73 |
9.91 |
48.39 |
5.82 |
1.48 |
0.13 |
0.16 |
19.62 |
18.36 |
|
Minimum |
66.37 |
8.59 |
48.03 |
5.51 |
1.48 |
0.10 |
0.16 |
19.28 |
18.11 |
|
|
Mean |
69.67 |
11.11 |
48.81 |
5.77 |
1.61 |
0.12 |
0.25 |
19.81 |
18.58 |
|
|
Maximum |
71.22 |
12.83 |
50.39 |
6.27 |
1.90 |
0.14 |
0.56 |
20.90 |
19.54 |
|
|
Average deviation |
0.79 |
1.22 |
0.52 |
0.14 |
0.07 |
0.01 |
0.06 |
0.37 |
0.33 |
|
|
Sample standard deviation |
1.21 |
1.41 |
0.67 |
0.19 |
0.11 |
0.01 |
0.10 |
0.47 |
0.41 |
|
|
Coefficient of variation Cv(%) |
1.7 |
12.7 |
1.4 |
3.4 |
6.8 |
8.8 |
41.4 |
2.4 |
2.2 |
|
|
Typical values for exhausted olive cake (EN ISO 17225-1, 2014 [12]) |
- |
3.4–11.3 |
48–52 |
4.6–6.3 |
1.4–2.7 |
0–0.5 |
0.1–0.4 |
18.1–21.6 |
13.9–19.2 |
|
| a Corrupted and not analyzed | ||||||||||
For fly ash the coefficient of variation of the different compounds is around 20–35 % except for potassium (K2O), that remains almost constant (coefficient of variation 5.8 %), sulfur and phosphorous (8.8 and 9.7 % respectively), and sodium, with an extremely high variation (coefficient of variation 118 %). The high sodium’s coefficient of variation is mainly due to the extremely high content in November (1st year) and December (1st year), that constitute an unusual composition with respect to the results from all other months (as shown for feedstock samples). Excluding these months, all coefficients of variation decrease, but this decrease is considerably higher for sodium (which drops to 57 %, half of the initial one) and chlorine (which drops to 6.2 %, being 22.6 % the initial one). Differentiation from November and December (1st year) with respect other months is confirmed by the statistical analysis carried out using clustering techniques. As can be seen in Fig. 6, the smallest and most homogeneous group, when analyzing simultaneously all chemical compounds, was observed for November (1st year) and December (1st year) samples. Furthermore, the separation between groups shows a high linkage distance between the November-December 1st group from the group formed by the other samples. This linkage distance is similar to that observed by Zajᶏc et al. [29] between different kinds of biomass. Therefore, separation between groups seems to confirm the unusual Cl and Na contents at these months. This high Na content, together with the high chlorine content, led to harmful deposit formation, due to the major role that high alkaline and chlorine contents play in the deposition process [1, 5, 30].
For bottom ash the coefficient of variation of the different compounds is around 10–30 %. The least variable oxide content is that of Fe2O3 (coefficient of variation 9.8 %) whereas the most variable one is the Na2O content (coefficient of variation 111.8 %), accordingly with fly ash results. Likewise, the variability decreases when excluding the months with an unusual composition (November (1st year) and December (1st year)).
Table 4 shows the average composition and standard deviation of laboratory, fly and bottom ash considering all samples except November (1st year) and December (1st year) due to their unusual composition. The main component, as commented before, in fly ash is K2O (39.96 % wt.), four times higher than the second one (CaO (10.23 % wt.). Contents in SiO2 (7.31 % wt.), SO3 (5.91 % wt.) and Cl (4.47 % wt.) are also important. For bottom ash, K2O (29.66 % wt.) is also the main component, but SiO2 (19.75 % wt.) and CaO (17.93 % wt.) contents are also high, whereas SO3 (1.41 % wt.) and chlorine (1.28 % wt.) are less abundant.
|
Oxides |
Laboratory ash |
Fly ash |
Bottom ash |
|---|---|---|---|
|
SiO2 |
12.08 ± 2.69 |
7.31 ± 1.72 |
19.75 ± 2.43 |
|
Al2O3 |
2.93 ± 0.65 |
1.68 ± 0.41 |
3.67 ± 0.62 |
|
Fe2O3 |
1.60 ± 0.29 |
1.46 ± 0.27 |
2.34 ± 0.25 |
|
MgO |
4.40 ± 0.88 |
2.05 ± 0.35 |
3.92 ± 0.43 |
|
CaO |
12.78 ± 2.31 |
10.23 ± 1.75 |
17.93 ± 2.84 |
|
Na2O |
0.34 ± 0.22 |
0.33 ± 0.23 |
0.43 ± 0.32 |
|
K2O |
32.32 ± 1.68 |
39.96 ± 1.70 |
29.66 ± 3.83 |
|
P2O5 |
4.30 ± 0.40 |
2.63 ± 0.22 |
4.36 ± 0.45 |
|
SO3 |
2.66 ± 0.28 |
5.91 ± 0.43 |
1.41 ± 0.45 |
|
Cl |
2.29 ± 0.23 |
4.47 ± 0.30 |
1.28 ± 0.60 |
According to their composition, all ash samples are classified as low acid “K” type following the chemical classification system of inorganic matter in biomass and biomass ash proposed by Vassilev et al. [18] (Fig. 7). This classification is also use by Eliche-Quesada and Leite-Costa [25] for the same kind of ash, although in their article they misclassify their sample as “C” type. Categorization of ash type is useful when looking for possible applications. These applications are discussed in the last section (Ash Applications).
Results from Table 4 are graphically presented in Fig. 8 to show more clearly how the orujillo ash forming matter (denoted as laboratory ash) is distributed among the ash fractions (fly and bottom). As shown, the enrichment in volatile elements (K, S and Cl, expressed as oxides in the figure) in fly ash and the enrichment in Si, Al, Fe, Ca and P in bottom ash with respect to the laboratory composition can be clearly observed. The higher K, S and Cl contents in fly ash are due to the vaporization of these elements, their reactions, and the subsequent condensation of the formed species containing these elements, on already existing ash particles or nucleation of new particles. These results are consistent with other combustion biomass studies [1–7]. Nevertheless, the fly ash from orujillo shows higher potassium content than fly ash from straw (biomass also with high K and Cl contents) as shown in other studies, despite different analysis techniques [1]. This could be explained not only by the initial high potassium content of orujillo but also by the better release of potassium, at pulverized combustion conditions, for olive residue than for straw, as shown by Shah et al. [31].
Phase Composition
The study of phase minerals identified by XRD shows some general conclusions. A broad halo can be observed from the XRD patterns, which is associated with presence of a large amount of amorphous materials. There are some phases which have been identified in all months, while other phases could only be identified in certain months. Table 5 summarizes the identified crystalline phases for each kind of ash, and distinguishes those which have been identified for all samples from those which have been identified in most samples but not all. As a representative example, diffractograms showing XRD results are shown in Figs. 9 to 11, and the peaks of the identified crystalline phases are marked with the acronyms shown in Table 5. As an example and for a better visual comparison, the diffractograms of all kinds of ash for a particular month and, their water insoluble fraction, are shown in a single figure (Fig. 12). In these figures (from 9 to 12), the halo associated with amorphous material can be observed, and it is remarkable at the moving range of 25–35 (2Θ for Cu Kα1 radiation). The relative importance of the different identified phases clearly changes along the different months. For example, at laboratory ash (Fig. 9), Fairchildite is the peak of maximum intensity at June 2nd whereas Quartz is the most intense peak at November 2nd. As shown in Table 5, most of the phases identified are common in the different kinds of ash, although with different relative intensity. Sulphates and chlorides are more intense in laboratory ash and, especially, in fly ash, while silicates and phosphates are intense in bottom ash (Figs. 9 to 11). Carbonates are also identified in all kinds of ash. These results are consistent with their classification as “K type” ash, and with the results from XRF (for example, higher S and Cl content in fly ash).
Laboratory ash is useful as a reference to compare with industrial ash. However, the high temperature and short residence time of biomass in a suspension-fired boiler affect the amount of volatile matter present in the bottom and fly ash (some of this volatile matter, such as alkaline salts, governing fouling) and the crystalline phase transformations. Although the analysis of laboratory ash is useful to prevent from possible problems, it does not provide information about possible deposit locations (grate, superheaters, etc.), nor about the components causing these problems.
The main carbonates found are potassium and calcium carbonates (Table 5). Calcite has been identified in all laboratory samples, although it is not always marked in Fig. 9 for clarity. The same applies to most of the bottom and fly ash samples. Fairchildite is specific of laboratory ash and huntite appears in both fly and bottom ash, especially in the latter. In bottom ash, the carbonates of calcium and magnesium are more significant than the potassium ones.
Quartz (SiO2) has been identified in all ash samples (Table 5). Other silicates, such as potassium aluminosilicates (KAlSiO4) are found in all bottom and fly ash. However, in fly ash, this phase is masked by a high water-soluble peak. Although under more aggressive conditions it could be solubilized, in this case it is better identified in the insoluble fraction (Fig. 12 peak at 2 θ = 28.50º). A specific silicate, talc, is only identified in the insoluble fraction of the laboratory ash (Fig. 12 peak at 2 θ = 28.60º and 2 θ = 9.47º, the last not shown), although it cannot be observed in the original ash. Talc is not a usual phase in biomass ash, but it is a common additive used to improve oil extraction which finally ends up at the olive cake [32]. It is usually added in a range of 0.5 % to 2 % of the olive weight.
Phosphates in the form of apatites (chloro- and hydroxyl-) are the most repeatedly found. They are present in fly and bottom ash (Figs. 10–12, where the range of most intense peaks is 2 θ = 31º – 34º), but their importance is higher in bottom ash, result which agrees with a higher content of phosphorous and calcium (Table 4). On the contrary, apatites do not appear in the laboratory ash (only soluble compounds appear within the range of most intense peaks for apatites), which suggest that they are not in the original biomass. According to these results apatites are supposed to be secondary phases, formed during the combustion process. This agrees with Vassilev et al. [33] who stated that the dominant origin of phosphates is secondary, as a result of the interaction of oxides, such as those of Ca, Fe, K, Mg, with phosphorous from the organic matter.
The presence of sylvite (KCl) in the orujillo ash is clear. It is always present on laboratory and fly ash (Table 5) and is the most intense phase in fly ash. XRD profile of November 1st laboratory and fly ash show a perfect pattern of sylvite (Fig. 9 and Fig. 10). Furthermore, its reduction (or disappearance) in the diffraction intensities in bottom ash can be explained with the volatilization and silication of KCl, [34, 35] which for some samples is not complete and still appears in the bottom ash. On the other hand, KCl present in fly ash is mostly attributed to condensation of gaseous KCl (derived from K and Cl volatilization and recombination) over existing ash. KCl plays an essential role on deposit formation because it promotes the formation of the first deposit layer and acts as glue [36] for the impacting ash particles, facilitating deposit growth. The role of sylvite on deposits formed at this plant was widely studied in a previous work [21] and the presence of this phase was evident (it was the most intense phase in all deposits, and specially at the inner layers).
Arcanite (K2SO4) follows similar trend as KCl. It has been identified in laboratory and fly ash but not in bottom ash. Similarly to KCl, the origin of potassium sulfate in fly ash is mostly attributed to the condensation of this compound on the existing particles in the flue gas. At an initial stage, when exiting the combustion chamber, these particles have quite similar structural characteristics to those ending as bottom ash. This initial similarity is, in some way, confirmed by the resemblance between the insoluble fractions of fly and bottom ash (Fig. 12). Later, some reactions take place, like carbonatation (in both types of ash) and condensation of volatile and soluble chlorides and sulfates (on fly ash). These are clearly identified in the original fly ash (Fig. 12) at 2 θ: 28.30º and 40.45º for KCl and at 2 θ: 29.70º and 30.80º for K2SO4.
Although the presence of NaCl has been observed on ash samples for November and December 1st, the most intense phase is still KCl in these samples. Chlorine has been widely considered as a promoter of alkalis release [31, 34]. Therefore, higher Cl content usually leads to higher alkali release, which is able to react with chlorine at the gaseous phase. Once at the gaseous phase, potassium remains in higher proportion than sodium, favoring the formation of KCl. Figure 13 presents the height of the highest peak associated with KCl along months for fly and laboratory ash samples. Highest peaks are associated with the abnormal months November and December 1st. The importance of KCl during the abnormal months on deposit formation has already been discussed above. However, the higher Na content on fly ash probably contributed as well, not only through the NaCl formation, but also causing the molten state of some structures on fly ash particles, which increase the capturing efficiency and the tenacity of the deposits, as have been probed in the previous study at this plant [21].
|
Crystalline phase |
Ash |
||||
|---|---|---|---|---|---|
|
Phase name |
Acronym |
Chemical Formula |
Laboratory |
Fly |
Bottom |
|
Chlorides |
|||||
|
Sylvite |
Sy |
KCl |
● |
● |
○ |
|
Halite |
Ha |
NaCl |
○(a) |
○(a) |
|
|
Silicates |
|||||
|
Potassium aluminium silicate |
Ks |
KAlSiO4 |
● |
● |
|
|
Potassium magnesium silicate |
KMg |
K2MgSiO4 |
○ |
||
|
Talc |
T |
Mg3Si4O10(OH)2 |
● |
||
|
Quartz |
Q |
SiO2 |
● |
● |
● |
|
Carbonates & bicarbonates |
|||||
|
Potassium carbonate |
Kc |
K2CO3 |
○ |
○ |
|
|
Potassium carbonate hydrated |
Kh |
K2CO3 (H2O)1.5 |
○ |
○ |
|
|
Kalicinite |
K |
KHCO3 |
○ |
○ |
|
|
Fairchildite |
F |
K2Ca(CO3)2 |
○(b) |
||
|
Huntite |
H |
CaMg3(CO3)4 |
○ |
○ |
|
|
Calcite |
Cc |
CaCO3 |
● |
○ |
○ |
|
Phosphates |
|||||
|
Chloroapatite |
ApCl |
Ca5(PO4)3Cl0.9F0.1 Ca5(PO4)3Cl |
● |
○ |
|
|
Hydroxylapatite |
ApH |
Ca10(PO4)6(OH)2 |
● |
○(c) |
|
|
Potassium phospate |
P |
K4P2O7 |
○ |
||
|
Sulphates |
|||||
|
Arcanite |
Arc |
K2SO4 |
● |
● |
|
|
Notes: (a) Halite is identified in November and December 1st (b) Fairchildite is identified in all laboratory ash samples except November 1st (c) Hydroxylapatite is identified in all bottom ash samples except December 1st and April 2nd |
|||||
Chemical composition of fly ash, collected along 23 months, was analyzed with the aim to check any seasonal trend. A possible relationship between the weather winter conditions and the high content on Na and Cl observed during the winter of the first year was suspected, and contamination with road salt treatment was presumed to be the cause. In addition, NaCl was detected with XRD. However, as seen in Fig. 14, the episode of high Cl and Na content did not happen during the second winter despite similar weather conditions. Therefore, the road salt treatment should not be assumed to explain the anomalously high Cl and Na contents. Furthermore, the seasonal evolution of the rest of elements was also studied. Figure 15 shows the evolution of Fe, Si and Al, as an example. As can be observed, no seasonal trend has been found since no composition is repeated between similar months or seasons. However, the seasonal study reveals interesting correlations between elements. As observed in Fig. 14 Cl and Na show similar trends. Likewise, clear relationships between Fe, Si and Al can be observed (Fig. 15). Figure 16 shows the best correlation between elements. Left panels (a) show the correlations considering November (1st year) and December (1st year) and the right panels (b) show the same correlations discarding these months. This distinction was done to show that the correlation between Cl and Na (R2 = 0.98 for laboratory ash and 0.96 for fly ash) is much better when considering November and December 1st year (a). On the contrary, this correlation is very weak (R2 = 0.41 for laboratory ash and 0.64 for fly ash) when these months were not considered (b), meaning that there is no significant correlation between these two elements when the usual untainted feedstocks are used, and thus adding consistency to the attributed contamination with NaCl during the aforementioned months. Nevertheless, the strong relationship between Si, Al and Fe (R2 = 0.8 to 0.9 for laboratory ash) is clear in the two scenarios (including and discarding November and December 1st year). As an indicative value, the average Al content on biomass basis for the samples measured in this study is 1754 ppm which is very high for a fruit-based biomass, and could be derived from soil contamination [37]. This hypothesis is consistent with the close relationship between Si, Al and Fe. Soil contamination is commonly derived from storage, handling and transport operations, and evidence of stones in the feedstock at their milling pretreatment have often been observed. Nevertheless, this probable soil contamination happens every month and has never led to troublesome deposit formation on the superheaters.
Ash Applications
Reuse and recycling of biomass ash as a new resource can enhance the development of a circular and sustainable economy. Knowing the quality of recovery ash, including its variability, is necessary to efficiently look for applications [38]. Therefore, this study provides useful information about the chemical and mineralogical composition and the variability of fly and bottom ash from orujillo. This information is useful for any user who must establish the ash quality control, the possible ash applications, and the ash pretreatment (removal of unburnt carbon, thermal treatment, blending with other kind of ash...) need to adapt it for its final use.
Considering the low acid “K” type classification [18] of the recovery ash obtained from orujillo under suspension boiler combustion, a wide variety of utilization possibilities can be foreseed. Some of these possible uses are: fluxing materials, detergents, activate carbons, recovery of water-soluble major, minor and trace elements, glass and glass ceramics, fertilization, insulators and others [39].
Ash from orujillo has been widely used as fertilizer because of its high potassium content [40]. In fact, fly ash from these kinds of plants have been usually sold to fertilizer companies. Other possible uses for this recovery ash are the use in the manufacture of construction materials. Fly [24] and bottom [25] ash from a twin plant (i.e. similar type of fly and bottom ash characterized here) have been studied as raw material for clay bricks. Bonet-Martínez et al. [24] found that up to 25 wt% of fly ash (similar to that studied here) could be incorporated in clay brick, being an economical and sustainable solution without losing quality and fulfilling current regulations. Moreover, Eliche-Quesada and Leite-Costa [25] concluded that up to 20 wt.% of bottom ash (and 10 % as optimum) could be employed in the brick formulation, fulfilling standard requirements for clay masonry units, and, at the same time, with better thermal insulation properties than bricks made only with clay. Fly ash from combustion of orujillo and olive pruning has recently been studied, with promising results, as an alkali activator for generating geopolymers, due its high potassium content [41]. An important point to be further evaluated is the energy saving that is expected when adding orujillo ash (with high content of the fluxing oxides, e.g. K2O) to the construction materials, as a consequence of the reduction in the firing temperature.
Another interesting application studied for orujillo ash [42–43], as well as of other kind of biomass ashes [44–45], is the use as adsorbent to remove metal ions from aqueous solutions.
It must be noticed that using ash with abnormal composition would require revising the proportions to be employed for typical ash. For example, the contamination shown in this study (Cl and Na) produces ash with an abnormally high content of sodium and KCl which significantly decrease their characteristic melting points [46] and thus, could decrease more than expected the paste sintering point in clay or ceramic bodies. Furthermore, high KCl is expected to cause scumming [47], and an excess of chlorine could cause harmful corrosion on the oven metal parts. Moreover, if used in the production of concrete, an excess in chlorine content could attack the oxide passivation layer of concrete, causing a negative effect on the durability and strength of concrete [48]. All these undesirable effects demonstrate the necessity to control both the fed orujillo and the derived ash, especially the Cl and Na contents, at the power plant and at the facility for ash recycling, respectively.
A complete characterization of feedstock, bottom and fly ash collected along more than a year in a 16 MW orujillo’s suspension-fired boiler power plant has been made. One of the main highpoints of this study is the characterization of ash from a real biomass boiler instead of, as usual in most of the works dealing with biomass combustion, ash obtained under well-controlled laboratory conditions.
The study is focused on the distribution of elements and crystalline phases between fly and bottom ash and, on the possible feedstock’s contamination and its implications. The following conclusions can be drawn:
(1) Composition of feedstock is quite invariable except when some contamination occurs. Along more than a year, a clear contamination with Cl and Na has been observed in two-month samples and a clear correlation between the increase in Cl and Na shows a common origin. Furthermore, the identification of NaCl with XRD, suggest possible salt contamination. The seasonal study proves that salt road treatment is not the contamination source since this contamination is not related to the winter conditions. Other possible sources of contamination with Na and Cl are the use of table olives or the spilling of any other sodium- and chlorine-rich substance on the feedstock. However, no specific contamination source could be proved.
(2) No seasonal trend has been found, since no composition is repeated between similar months or seasons.
(3) Fly ash enrichment in volatile species (K, Cl, S) has been evidenced, as well as the enrichment in Si, Al, Fe, Ca and P in bottom ash. It is remarkable that fly ash potassium enrichment is very high, and it is even higher than the one observed in straw fly ash by other authors.
(4) The main component of fly ash is potassium, four times higher than the second one which is calcium. Other important components are silicon, sulfur and chlorine. This shows that KCl, K2SO4 and potassium carbonates are distinctive of this ash.
(5) The main component of bottom ash is potassium followed by silicon and calcium. The prominent crystalline phases of this ash are phosphates, silicates and carbonates of calcium and magnesium, rather than potassium carbonates.
(6) Due to its composition, fly ash is adequate to be used as fertilizer component and as component for construction materials. Its potassium content is interesting for many applications (such as alkali activator) but when Na and Cl contamination occurs the high and unexpected contents could cause some troubles. For instance, they could decrease the strength of concrete or the paste melting point in ceramic bodies.
(7) The feedstock’s aluminum content (higher than expected for a biomass source) and the clear correlation between Fe, Al and Si contents suggest the presence of soil contamination, although this has not resulted in troublesome deposit formation.
(8) A relationship between high Cl and Na contents and a harmful deposit growth has been observed. Therefore, Cl and Na contents should be included in the plant feedstock´s quality control when orujillo is used.
Authors declare no conflict of interest.
Acknowledgements
The company Energías de la Mancha, S.A. is gratefully acknowledged for his great implication on this study participating on the biomass and ash sampling as well as providing all required information about the plant operation. The Government of Castilla-La Mancha (Spain) is also acknowledged for their financial support through the BIOENTE Research Project (Reference SBPLY/19/180501/000283). The authors would like to thank the University of Castilla-La Mancha (UCLM) for financing Esperanza Monedero through the Call for access to the Spanish System for Science, Technology and Innovation (UCLM’s Own Research Plan), funded by the European Social Fund.
- Bashir, M.S., Jensen, P.A., Frandsen, F.J., Wedel, S., Dam-Johansen, K., Wadenbäck, J., Pedersen, S.T.: Ash transformation and deposit build-up during biomass suspension and grate firing: full-scale experimental studies. Fuel Process. Technol. 97, 93–106 (2012)
- Hansen, S.B., Jensen, P.A., Frandsen, F.J., Wu, H., Bashir, M.S., Wadenbäck, J., Sander, B., Glarborg, P.: Deposit probe measurements in large biomass-fired grate boilers and pulverized-fuel boilers. Energy Fuels 28, 3539–3555 (2014)
- Lanzerstorfer, C.: Grate-fired biomass combustion plants using forest residues as fuel: Enrichment factors for components in the fly ash. Waste Biomass Valor 8, 235–240 (2017)
- Obernberger, I., Biedermann, F., Widmann, W., Riedl, R.: Concentrations of inorganic elements in biomass fuels and recovery in the different ash fractions. Biomass Bioenergy 12(3), 211–224 (1997)
- Michelsen, H.P., Frandsen, F., Dam-Johansen, K., Larsen, O.H.: Deposition and high temperature corrosion in a 10 MW straw fired boiler. Fuel Process. Technol. 54, 95–108 (1998)
- Nordgren, D., Hedman, H., Padban, N., Boström, D., Öhman, M.: Ash transformations in pulverised fuel co-combustion of straw and woody biomass. Fuel Process. Technol. 105, 52–58 (2013)
- Hansen, S.B., Jensen, P.A., Jappe Frandsen, F., Wu, H., Sander, B., Wadernbäck, J., Glarborg, P.: Deposit probe measurements in Danish grate and pulverized fuel biomass power boilers. In Proceedings. Impacts of fuel quality on power production and the environment. Puchberg, Austria: (2012)
- Andalusian Energy Agency: La bioenergía en Andalucía (In Spanish). https://www.agenciaandaluzadelaenergia.es/es/biblioteca/la-bioenergia-en-andalucia (2020). Accessed May 2021
- Williams, O., Eastwick, C., Kingman, S., Giddings, D., Lormor, S., Lester, E.: Overcoming the caking phenomenon in olive mill wastes. Ind. Crops Prod. 101, 92–102 (2017)
- Perry, M., Rosillo-Calle, F.: Country report for United Kingdom. Report T40UK5/09. International Energy Agency, Bioenergy https://task40.ieabioenergy.com/wp-content/uploads/sites/6/2013/09/iea-task-40-country-report-2009-uk.pdf (2009). Accessed May 2021
- Perry, M., Rosillo-Calle, F.: Co-firing report-United Kingdom. Report T40UK02R International Energy Agency, Bioenergy: (2006)
- European Committee for Standarization: EN ISO 17225-1:2014. Solid biofuels. Fuel specifications and classes. Part 1: General requirements. Brussels, Belgium: (2014)
- Mlonka-Mędrala, A., Magdziarz, A., Gajek, M., Nowińska, K.: Alkali metals association in biomass and their impact on ash melting behaviour. Fuel 261, 116421 (2020)
- Jin, X., Ye, J., Deng, L., Che, D.: Condensation Behaviors of potassium during biomass combustion. Energy Fuels 31, 2951–2958 (2017)
- Capablo, J.: Formation of alkali salt deposits in biomass combustion. Fuel Process. Technol. 153, 58–73 (2016)
- Febrero, L., Granada, E., Regueiro, A., Míguez, J.L.: Influence of Combustion Parameters on Fouling Composition after Wood Pellet Burning in a Lab-Scale Low-Power Boiler. Energies 8, 9794–9816 (2015)
- Shao, Y., Wang, J., Preto, F., Zhu, J., Xu, C.: Ash Deposition in Biomass Combustion or Co-Firing for Power/Heat Generation. Energies 5, 5171–5189 (2012)
- Vassilev, S.V., Baxter, D., Andersen, L.K., Vassileva, C.G.: An overview of the chemical composition of biomass. Fuel 89(5), 913–933 (2010)
- Sánchez, A.H., Rejano, G.P.: L.: Elaboration of table olives. Int. J. Fats Oils 57(1), 86–94 (2006)
- López, A., García, P., Garrido, A.: Multivariate characterization of table olives according to their mineral nutrient composition. Food Chem. 106, 369–378 (2008)
- Lapuerta, M., Acosta, A., Pazo, A.: Fouling deposits from residual biomass with high sodium content in power plants. Energy Fuels 29, 5007–5017 (2015)
- Fuller, A., Stegmaier, M., Schulz, N., Menke, M., Schellhorn, H., Knödler, F., Maier, J., Scheffknecht, G.: Use of wood dust fly ash from an industrial pulverized fuel facility for rendering. Constr. Build. Mater. 189, 825–848 (2018)
- Skrifvars, B.J., Laurén, T., Hupa, M., Korbee, R., Ljung, P.: Ash behaviour in a pulverized wood fired boiler—a case study. Fuel 83, 1371–1379 (2004)
- Bonet-Martinez, E., Pérez-Villarejo, L., Eliche-Quesada, D., Sánchez-Soto, P.J., Carrasco-Hurtado, B., Castro-Galiano, E.: Manufacture of sustainable clay ceramic composite with composition SiO2-Al2O3-CaO-K2O materials valuing biomass ash from olive pomace. Mater. Lett. 229, 21–25 (2018)
- Eliche-Quesada, D., Leite-Costa, J.: Use of bottom ash from olive pomace combustion in the production of eco-friendly fired clay bricks. Waste Manage 48, 323–333 (2016)
- Hernádez, J.J., Lapuerta, M., Monedero, E., Pazo, A.: Biomass quality control in power plants: Technical and economical implications. Renewable Energy 115, 908–916 (2018)
- Nergiz, C., Engez, Y.: Compositional variation of olive fruit during ripening. Food Chem. 69, 55–59 (2000)
- Spanish Association for Standardisation (AENOR): UNE 164003. Biocombustibles sólidos. Especificaciones y clases de biocombustibles. Huesos de aceituna (In Spanish) España, Madrid: (2014)
- Zajc, G., Szyszlak-Bargłowicz, J., Gołębiowski, W., Szczepanik, M.: Chemical Characteristics of Biomass Ashes. Energies 11, 2885 (2018)
- Hupa, M.: Ash-related issues in fluidized-bed combustion of biomasses: recent research highlights. Energy Fuels 6(2), 4–14 (2012)
- Shah, K.V., Cieplik, M.K., Betrand, C.I., Van de Kamp, W.L., Vuthaluru, H.B.: Correlating the effects of ash elements and their association in the fuel matrix with the ash release during pulverized fuel combustion. Fuel Process. Technol. 91, 531–545 (2010)
- Caponio, F., Squeo, G., Difonzo, G., Pasqualone, A., Summo, C., Paradiso, V.M.: Has the use of talc an effect on yield and extra virgin olive oil quality? J. Sci. Food Agric. 96, 3292–3299 (2016)
- Vassilev, S.V., Baxter, D., Vassileva, C.G.: An overview of the behaviour of biomass during combustion: Part I. Phase-mineral transformations of organic and inorganic matter. Fuel 112, 391–449 (2013)
- Johansen, J.M., Jakobsen, J.G., Frandsen, F.J., Glarborg, P.: Release of K, Cl, and S during Pyrolysis and Combustion of High-Chlorine Biomass. Energy Fuels 25, 4961–4971 (2011)
- Niu, Y., Zhu, Y., Tan, H., Wang, X., Hui, S., Du, W.: Experimental study on the coexistent dual slagging in biomass-fired furnaces: Alkali- and silicate melt-induced slagging. Proc. Combust. Inst. 35: 2405–2413: (2015)
- Niu, Y., Tan, H., Hui, S.: Ash-related issues during biomass combustion: Alkali-induced slagging, silicate melt-induced slagging (ash fusion), agglomeration, corrosion, ash utilization, and related countermeasures. Prog. Energy Combust. Sci. 52, 1–61 (2016)
- Cherney, J.H., Ketterings, Q., Cherney, D.J.R.: Soil contamination of grass biomass hay: measurements and implications. Bioenerg. Res. 9, 773–781 (2016)
- Gupta, V., Pathak, D.K., Siddique, S., Kumar, R., Chaudhary, S.: Study on the mineral phase characteristics of various Indian biomass and coal fly ash for its use in masonry construction products. Constr. Build. Mater. 235, 117413 (2020)
- Vassilev, S., Baxter, D., Andersen, L.K., Vassileva, C.G.: An overview of the composition and application of biomass ash. Part 2. Potential utilisation, technological and ecological advantages and challenges. Fuel 105, 19–39 (2013)
- Valta, K., Aggeli, E., Papadaskalopoulou, C., Panaretou, V., Sotiropoulo, A., Malamis, D., Moustakas, K., Haralambous, K.J.: Adding value to olive oil production through waste and wastewater treatment and valorisation: the case of Greece. Waste Biomass Valor 6, 913–925 (2015)
- Carrillo-Beltran, R., Corpas-Iglesias, F.A., Terrones-Saeta, J.M., Bertoya-Sol, M.: New geopolymers from industrial by-products: Olive biomass fly ash and chamotte as raw materials. Constr. Build. Mater. 272, 121924 (2021)
- Bouzid, J., Elouear, Z., Ksibi, M., Feki, M., Montiel, A.: A study on removal characteristics of copper from aqueous solution by sewage sludge and pomace ashes. J. Hazard. Mater. 152, 838–845 (2008)
- Elouear, Z., Bouzid, J., Boujelben, N., Feki, M., Montiel, A.: The use of exhausted olive cake ash (EOCA) as a low cost adsorbent for the removal of toxic metal ions from aqueous solutions. Fuel 87, 2582–2589 (2008)
- Rodríguez-Díaz, J.M., Prieto, J.O., Bravo, L.R., da Silva, M.G.C., da Silva, V.L., Arteaga-Pérez, L.E.: Comprehensive characterization of sugarcane bagasse ash for its use as an adsorbent. Bioenerg. Res. 8, 1885–1895 (2015)
- Barbosa, R., Lapa, N., Lopes, H., Günther, A., Dias, D., Mendes, B.: Biomass fly ashes as low-cost chemical agents for Pb removal from synthetic and industrial wastewaters. J. Colloid Interface Sci. 424, 27–36 (2014)
- Niu, Y., Lv, Y., Zhang, X., Wang, D., Li, P., Hui, S.: Effects of water leaching (simulated rainfall) and additives (KOH, KCl, and SiO2) on the ash fusion characteristics of corn straw. Appl. Therm. Eng. 154, 485–492 (2019)
- De la Casa, J.A., Castro, E.: Recycling of washed olive pomace ash for fired clay brick manufacturing. Constr. Build. Mater. 61, 320–326 (2014)
- Hinojosa, M.J.R., Galvin, A.P., Agrela, F., Perianes, M., Barbudo, A.: Potential use of biomass bottom ash as alternative construction material: Conflictive chemical parameters according to technical regulations. Fuel 128, 248–259 (2014)