2.1 Chemicals
Acephate (Technical grade, 97.5 %, Meghmani Organics Ltd., Ahmedabad)was received as a gift from the Department of Veterinary Pharmacology and Toxicology, Veterinary College, Anand, AAU, Anand, Gujarat, India, PIN388001. Serum total protein and albumin estimation kits were obtained from Aspen laboratories. DNA molecular weight marker was purchased from MBI Fermentas GERMANY. Boric acid, chloroform, ethanol, glycerol, glycine, HCl, hydrogen peroxide (30 %), isopropanol, isoamyl alcohol, sodium carbonate, methanol were from Merck, Mumbai, INDIA. Ethidium bromide was procured from Hi Media, INDIA. Agarose, DMSO, Con-A, ATChI, PHA-P and other chemicals were purchased from Sigma chemicals, USA. All other reagents used were of analytical grade. Multi-well 24 well plate (35)3043, 96 well flat bottom plate with lid was purchased from Falcon, USA.
2.2 Experimental cockerels
The research was performed in day-old white male leghorn cockerels (WLH), procured from the poultry community Phoenix, Jabalpur (Madhya Pradesh). The cockerels were treated with the 12h of a dark-light period. All experimental protocols were approved by a College of Veterinary Science and AH, NDVSU, Jabalpur, MP, India institutional and/or licensing committee vide No. VPT/IAEC/Vety. College/2011. These experimental birds were offered water ad libitum and regular ration obtained from the feed unit, poultry farm, College of Veterinary Science & Animal Husbandry, Adhartal (Jabalpur). On days 1 and30, RD-F strain of the NewCastle Disease virus (Biological Products Division, IVRI, Izatnagar) was used to vaccinate experimental cockerels intranasally to check the serum antibody titer against NDV. On day 14, the cockerels were vaccinated against Infectious Bursal Disease using Gumboro Disease Vaccine (Live; intermediate plus strain type -Ventri Biologicals, Venkateshwara Hatcheries).
2.3 Experimental design
One day-old cockerels were randomly distributed into husbandry control (C1) and vehicle control (C2), and three treatment (T1-1/40th of LD50, T2-1/30th of LD50, and T3-1/20th of LD50) groups with 20 cockerels in each. Reported LD50 (852 mg kg−1) of acephate was used to calculate the different dose groups [10]. Doses of acephate 21.3 mg kg−1 body weight (1/40 of LD50), 28.4 mg kg−1 body weight (1/30 of LD50) and 42.6 mg kg−1 body weight(1/20 of LD50) dissolved in peanut oil were given to the cockerels of groupT1, T2 and T3, respectively, daily for 60 days from day 1. Cockerels from group C1 received regular feed and water only daily for 60 days from day 1, and acted as husbandry control. In group C2, the cockerels were given peanut oil along with usual feed and water daily for 60 days from day 1, and acted as vehicle control. The selection of dose(s) was based on previous studies [10] and the levels of acephate contamination / residue in drinking water or food supplies [11]. Acephate dissolved in peanut oil was injected directly into the crop through a catheter attached to 1 ml BD syringe. The cockerels were observed every day, and the body weights were reported at intervals of 7 days. At term, immune organs (Bursa of Fabricius, thymus, and spleen) were excised and weighed. All methods were carried out in accordance with relevant guidelines and regulations.
2.4 Body weight and relative lymphoid organ weights
The live body weight of birds was recorded prior to administration of acephate. Birds were observed daily and their live body weights were recorded at 7-day intervals for a period of 60 days in order to observe the manifestation of acephate. On day 61, after taking live body weight, ten cockerels of each experimental group were sacrificed and the spleen, thymus, and bursa of Fabricius were immediately removed and weighed separately for absolute organ weight. The relative body weights of the immune organs were determined by dividing the body weight of the organs. O: BW = Weight of the organ (g)/Body weight (g) X 10
2.5 Blood collection
Blood sampling under strict asepsis was done from cardiac puncture, jugular vein and wing vein of the cockerels of 0-10 day old (pre-experimental for checking maternal antibody titer), 10-40 day old and 40 day old, respectively, until the termination of experiment for hemato-immunological studies. At 20day intervals peripheral blood lymphocytes and serum were collected from heparinized (with 20 IU ml−1 heparin) and non-heparinized tubes, respectively. In immunotoxicity tests, peripheral blood lymphocytes were treated within an hour of collection, while serum was held at -80°C for further study.
2.6 Hematological studies
The day of the blood collection hematological tests were performed. The collected blood samples were diluted with 0.015 Toluidine blue and the total counts of leukocytes were assessed [12]. The differential leukocyte count was made in peripheral blood smears stained by Giemsa (Qualigens) [13].
2.7 Serum Protein profile
2.7.1 Serum chemistry
To determine the non-specific immune response in subchronic acephate-exposed cockerels serum total protein (gm dl−1), serum albumin (gm dl−1), and serum globulin (gm dl−1) were estimated with standard protocol of Core System as-say kits using an autoanalyzer (Photometer BT-224, Biotechnica Instruments, Italy) (Bt 1975 Jul).
2.7.2 SDS Polyacrylamide-Gel Electrophoresis (SDS-PAGE) of serum protein
The changes in the serum protein profile were analysed by 12 % resolving gel prepared according to Laemmli (1970) containing 1.5 M Tris-HCl buffer (pH8.8), 10 % SDS, 10 % ammonium persulphate and TEMED along with a 5 %stacking gel. The stacking gel (5 %) was made using 1.5 M Tris–HCl (pH 6.8), 10 % SDS, 10 % ammonium persulphate and TEMED. The electrophoresis was accomplished at 150 V till dye came out of the gel using 1x Tris glycine buffer. The molecular weights of the serum protein subunits were determined using pre-stained molecular weight standards run along with the samples. The volumes of samples were adjusted to a concentration of 50μg proteins per well. On completion of electrophoresis, the gels were stained for proteins with 0.1 % Coomassie brilliant blue according to conventional methods and destained in a solution of 50 % methanol containing 10 % acetic acid. Prior to viewing, the gel was washed with distilled water until the background was clear. In reference to markers, the different protein fractions and molecular weights were estimated.
2.8 Acetylcholinesterase
2.8.1 Erythrocyte acetylcholinesterase
We assessed depression of Acetylcholinesterase enzyme (AChE) activity, reported for organophosphate toxicity in red blood cells and brain by measuring acetylthiocholine iodide (ATChI) according to standard protocols [14]. AChE activity was determined in blood samples (10μL) collected at 20 day intervals and reported as μM ATChI hydrolyzed min−1 mg−1 protein.
2.8.2 Brain acetylcholinesterase
On day 61 all animals were sacrificed humanely by rapid decapitation. The brain was immediately removed from the head, and put in ice-cold saline. In order to measure brain acetylcholinesterase, dissection for discrete regions of the brain was performed on pre-chilled sterile Petri dishes. Great care has been taken to avoid tissue injury or inflammation of any portion of the brain when separating from the skull or dissecting the different areas [15]. The whole brains were suspended in a buffer (1 g of tissue plus 10 mL of sodium phosphate0.1 M, pH 7.5) and homogenised in an ice bath using a homogenizer. The homogenate was then centrifuged (5,000g/30 min/5°C), discarding the soluble portion. The pellet was then re-suspended using the equal volume of 0.1 g percent of Triton X-100 in 0.1 M sodium phosphate, pH 7.5, solution, and re-homogenized. The supernatant resulting from the resolubilization of the pellet was collected after a second centrifugation (15,000g/90 min/5°C). Brain AChE activity was spectrophotometrically tested in 0.1 M sodium phosphate, Triton X-100 0.1 g percent pH 7.5 by modifying Ellman’s method [14] as described by Silva Filho et al. [16].
2.9 Assessment of cell-mediated and humoral immunity
2.9.1 Delayed type hypersensitivity (DTH) reaction assay
In vivo, cell-mediated immune response was evaluated by assessing the DTH reaction to 2, 4-dinitro-1-chlorobenzene (DNCB) dye by following an earlier standard method with minor modifications [17]. Three cockerels from each group were arbitrarily selected and 2×2 cm2 aseptically defeathered skin areas on the left and right abdomen of each cockerel were marked with India ink at day 50. 100μl DNCB (10 mg ml−1) dye dissolved in acetone and olive oil in 4: 1 ratio was applied to the marked areas of the right side and 100μl acetone (vehicle control) applied to the marked areas of the left side of the cockerel abdomen. The birds were challenged by applying 100μl DNCB (2 mg ml−1) dye at the same areas of right side and 100 μl acetone on the left side after 7 days of first application. The increase in dermal thickness (mm) was measured at 0, 6, 12, 24, 48 and 72 h post-application with a vernier caliper. Increase in skin thickness (mm) = (Tt−T0) R− (Tt−T0) L Where Tt= thickness at t, T0=thickness at 0 h, R = right side, L = left side and t = time. DTH reaction in the form of increase in dermal thickness was also recorded in phytohemagglutinin-P (PHA-P). To this end, on day 57, three birds were randomly selected from each group. 100 μl PHA-P (1mgml−1) dissolved in PBS had been injected into the third interdigital space of the right leg and 100 μl PBS (vehicle control) into the left leg. The increase in footweb thickness (mm) was measured at 0, 6, 12, 24, 48 and 72 h of post-application with a vernier caliper and foot web index was calculated. Foot web index = (Tt−T0) R− (Tt−T0) L Where Tt=thickness at t, T0= thickness at 0 h, R = right side, L = left side and t = time
2.9.2 Anti-NDV antibody assay
Cockerel humoral immunity was determined by assessing IgG antibody levels specific to Newcastle Disease Virus (NDV) in serum samples using ND Ab Synbiotic ELISA kit (Hester Pharmaceuticals).
2.10 Lymphocyte mitogenesis assay
2.10.1 Separation of peripheral blood lymphocytes
The peripheral blood lymphocytes were isolated according to previously re-ported standard protocols [18]. Briefly, 5 ml of the heparinized fresh blood from each cockerel was layered over 3 ml of histopaque-1077 in 15-ml polypropylene centrifuge tube slowly through the wall and centrifuged at 1400 rpm for 40minutes. Mononuclear blood lymphocytes circumscribed at the plasma and histopaque interface were collected in a separate centrifuge tube. The lymphocytes, after washing thrice with sterile PBS (pH 7.2), were suspended in1–2 ml of red-free phenol RPMI-1640 medium supplemented with 10 % bovine foetal serum, 25 mM HEPES, 24 mM NaHCO3, 2 mM l-glutamine, 100 IU penicillin ml−1 and 100 g of streptomycin ml−1.
2.10.2 Separation of lymphocytes from spleen
The spleen was excised gently after the cockerels were sacrificed at the end of experiment on day 61, and splenocytes were isolated by following previously reported standard protocols [19, 20]. The excised spleen was washed thrice in sterile ice-cold phosphate buffer saline (PBS). The spleen capsule was removed and the organ was sliced into sections with the forceps and the scissors in the PBS. With a 10 ml glass syringe, the fragments were gently pushed through the mesh into a Petri dish containing a chilled PBS. Cell suspension was collected in 15-ml centrifuge tubes and allowed to stand on the ice for 5 min to settle heavy tissue parts. The uppermost 12 ml of the cell suspension was collected and centrifuged for 10 min at 1400 rpm. Cell pellets were then re-suspended in PBS and layered over histopaque-1077 at a ratio of 1:1. The tubes were centrifuged for 40 minutes at 1400 rpm. Further processing of the collected splenic lymphocytes was done as stated earlier to differentiate peripheral blood lymphocytes.
2.10.3 Cell viability count
The viable splenocytes was counted by using 0.1 % trypan blue dye, and hemocytometer [21]. The percentages of T and B lymphocytes in the peripheral blood and experimental bird spleen were determined using Annexin-V FITC Apoptosis Kit (Sigma Aldrich). The samples were analyzed by flow cytometry (BD FACS Aria, CA)
2.10.4 Lymphoproliferative response
In vitro the mitogen stimulation assay was performed as defined in the literature with minor modifications to evaluate lymphocyte proliferation [22].The active splenocytes reduced blue coloured 3-(-4,5-dimethylthiazol-2-yl)-2,5-diphenyltetrazolium bromide (MTT) chemical dye to its purple colour insoluble formazan which was read at 492 nm by using 650 nm as a reference wavelength in ELISA reader (Multiskan EX, Thermo Lab Systems, Australia). The mitogen stimulation Index (SI) was determined as Stimulation Index (SI) = (ODs−ODus)/ODus Where, ODs and ODus indicate optical densities of stimulated cells and unstimulated cells, respectively.
2.11 Assessment of mononuclear cell functional activity
2.11.1 Nitrite production by mononuclear cells
The functional activity of mononuclear cells stimulated by antigen Newcastle disease virus ‘F’ Strain (RD-F) or Lipopolysaccharides (LPS) was evaluated by assessing the concentration of nitrite produced by cultured cockerel splenocytes from control and treatment groups by following an established method [23]. The Nitrite level was assessed by measuring the absorbance at550nmwithin 30 minutes in the spectrophotometer micro plate reader (Multiskan EX, Thermo Lab systems, Australia). The concentration of nitrite produced by splenocytes was determined by comparison to the nitrite standard reference curve drawn with known sodium nitrite concentrations within cell-free medium and exhibited as μmol nitrite /3×106 cells. Nitrite (μM) = (∆A550nm–intercept)/slope
2.11.2 Nitrate reduction by mononuclear cells (Phagocytic activity test)
The nitroblue tetrazolium (NBT) dye reduction test was performed to mea-sure the phagocytic activity of splenic mononuclear cells following an established method [24]. The Nitrate level was assessed by measuring the absorbance at 710 nm immediately extraction of formazan using spectrophotometer (DU 640B, Beckman, USA). The concentration of nitrate reduction(formazan yield) by splenocytes was calculated as 1 nmol ml−1 formazan corresponds to an optical density 0.054+0.003 in both untreated control and acephate treated splenocyte.
2.12 Cytokinesis block Micronucleus assay in Cockerel splenic lymphocytes
The “in vivo biomonitoring” micronucleus (MN) test was performed to deter-mine the level of exposure and health risk, according to Krahn [25]. Briefly, cultured lymphocytes were taken and Colchicine (2×10⁻⁷ final) was added to each culture for the last 2 or 3 h of incubation. Metaphase cells were collected by “mitotic shake-off”, sedimented by centrifugation, resuspended in 0.075 MKCl, and incubated at 37ºC for 5 min. The cells were sedimented and resuspended (three times) in methanol: acetic acid fixative (3:1, v/v). Following a final centrifugation and resuspension in a small volume of fixative, the cells were dropped onto microscope slides. Slides were stained in 5 % Giemsa for 24 h, air dried, and mounted using permount. Air-dried and coded slides were analyzed using a light microscope. One thousand lymphocytes of each chick had been scored under oil immersion. Non-refractile particles, which in all respects resembled a nucleus, were considered to be micronucleus.
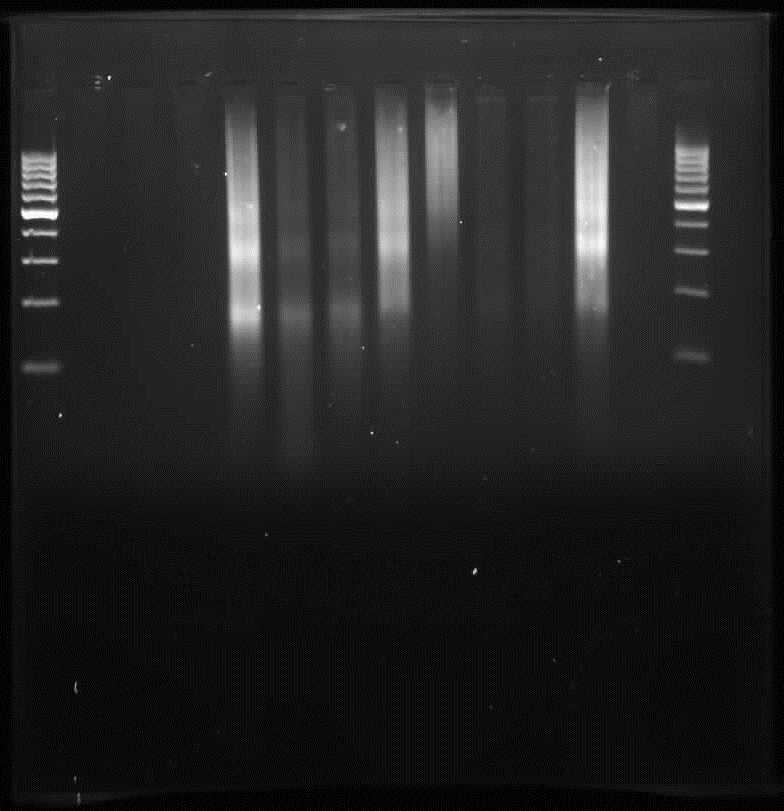
2.13 Internucleosomal DNA cleavage assay
In order to further evaluate the effect of acephate on apoptosis induction in splenic immune cells, an assay for internucleosomal DNA cleavage (a hall-mark of apoptosis) was carried out as previously reported [26]. Briefly, the fragmented DNA was extracted from splenocytes using a standard phenol: chloroform: isopropyl alcohol extraction (25:24:1), quantified by spectrophotometry, analyzed on a 0.8 % agarose gel, and photographed (digitized) (Gene Genius Bio Imaging System of SynGene, UK) and the electrophoretic pattern was utilized to determine total genomic DNA damage.
2.14 Histopathology
Bursa of Fabricius, spleen and thymus were fixed in 10 % formalin – saline solution from each cockerel. After processing, paraffin-embedded sections of each tissue were cut at a thickness of 4-6μmand stained for histopathological examination using a microscope with hematoxylin and eosin (H and E) [27].In splenic tissues, the degree of lymphoid depletion was assessed by the extent to which white pulp was reduced in size and distribution, and lymphoid follicles were measured using a microscope (200x fields) at 20 different fields per portion. The histomorphological lesions were blindly evaluated by a veterinary pathologist and these assigned to numerical scores 0 to 4, where a higher value corresponds to increasing severity.
Lymphoid necrosis score
0: No necrosis; 1+ :<5 % necrosis (mini); 2+ : 5–25 necrosis (mild); 3+ :25–50 necrosis (moderate); 4+ :>50 % necrosis (severe).
Red pulp expansion score
0: No widening; 1+ : Minimal widening; 2+ : Mild widening; 3+ : Moderate widening; 4+ : Severe widening.
The number or size of lymphoid tissue follicles or their germ centers was scored between 1 and 4 in bursal tissues. 1: 0–10 % depletion of lymphoids; 2: 10–30 %depletion of lymphoids (mild variation of cortical lymphoid tissue); 3: 30–70% depletion of lymphoids (moderate variation of cortical tissue and follicle medular regions and increased stroma between follicles); 4:>70 % depletion of lymphoids (severe depletion of follicles with little to no cortex, increased stroma between follicles and decreased follicular size).
2.15 Statistical analysis
Data were analyzed one-way analysis of variance (ANOVA) using SPSS 17.0software with Tukey’s HSD post-hoc tests to determine whether there were any statistically significant differences among experimental groups. The results are given as mean ± standard error mean (X±SEM). The p≤0.5 was deemed significant differences. All methods are reported in accordance with ARRIVE guidelines as dose treatments were given.