Subjective cognitive decline (SCD) is characterized by self-experienced deficits in cognitive capacity with normal performance in objective cognitive tests. While, the previous structural co-variance researches showed particularly insights into understanding the structural alterations of brain in neurodegenerative diseases. However, the age-related variations in coordinated topological patterns of morphological networks in individuals with SCD remain poorly understood. In this study, 77 individual morphological networks were constructed including 42 normal controls (NC) and 35 SCD individuals from structural Magnetic Resonance Imaging (sMRI). A stepwise linear regression model was constructed to evaluate the differences of age-related alternation patterns of the network properties in individuals with SCD compared with NC. Compared with NC, the properties of integration and segregation in individuals with SCD were lower, and the aberrant metrics were negatively correlated with age in SCD, while not in NC. The connections of rich-club were persevered but the connections of paralimbic system were disrupted in SCD compared with NC. In addition, age-related differences of nodal global efficiency mainly distributed in prefrontal cortex regions. In conclusion, the age-related disruption of topological patterns in SCD provide evidence that SCD population are at high risk to cognitive decline further.
Research Article
Aberrant Topological Organization and Age-Related Differences of Human Connectome in Subjective Cognitive Decline by Using Regional Morphology from Magnetic Resonance Imaging
https://doi.org/10.21203/rs.3.rs-555740/v1
This work is licensed under a CC BY 4.0 License
You are reading this latest preprint version
Individuals with Subjective Cognitive Decline (SCD) are accompanied by self-reported persistent decline in cognitive capacity and normal performance on neuropsychologic tests used to classify mild cognitive impairment (MCI)(Jessen et al. 2014; Jessen et al. 2020). Compared with individuals who are unimpaired in cognitive capacity and without subjective cognitive decline, individuals with SCD at a greater risk to cognitive decline in the future(Jessen et al. 2020; Gallassi et al. 2010; Rönnlund et al. 2015; Amariglio et al. 2018). Although age is a crucial risk factor for AD(Ferreira et al. 2020; Fjell et al. 2014; Jagust 2013; Riedel et al. 2016), whether AD-related neurodegeneration owes to aging still need to be explored(Sivera et al. 2019; Pichet Binette et al. 2020). Several studies based on neuroimaging revealed that grey matter (GM) atrophy(Chételat et al. 2005; Driscoll et al. 2009; Jack et al. 2008) and ventricular expansion(Jack et al. 2008; Driscoll et al. 2009) with aging accelerated in MCI patients compared with normal controls (NC).
GM atrophy in MRI characteristic of AD is one of essential biomarkers in A\T\N system(Besson et al. 2015; Jack et al. 2016; Jack et al. 2018). However, the foci of GM loss in individuals with SCD mainly distributed in medial temporal lobe, such as hippocampus, entorhinal cortex, CA1 and subiculum subfields(Rabin et al. 2017; Zhao et al. 2019). Moreover, the volume reduction in subregion of the cholinergic forebrain has been reported in SCD(Scheef et al. 2019). In particular, GM atrophy pattern in SCD individuals was similar with AD compared with control subjects(Peter et al. 2014). Compared with the connectivity determined using functional MRI, the GM/morphometric networks were more similar to networks of synchronized anatomical change(Alexander-Bloch et al. 2013), and it potential to reveal the AD-related GM alterations at the network level. The aberrant degeneration of GM in individuals with SCD aroused our curiosity for whether the organization of morphological network has altered, which intended to explore the underlying neuropathological mechanism of SCD from the perspective of human connectome.
The whole brain GM individual network can be constructed by structural Magnetic Resonance Imaging (sMRI) and communities of regional morphology between brain structures, and the graph theoretical approach can be applied to summarize complex organizations into meaningful topological properties further(He et al. 2007; Tijms et al. 2012; Alexander-Bloch et al. 2013). Furthermore, the topological properties in healthy population such as small-worldness(He et al. 2007), modularization(Chen et al. 2011) and rich-club organization(Lo et al. 2011) were reported in morphometric network analysis. In particular, the age-related alterations of topological organization in healthy people were exhibited in GM network studies(Chen et al. 2011; Wu et al. 2012). Moreover, previous studies for AD and MCI patients revealed that neurodegeneration may disrupt topological organization of morphometric networks(He et al. 2008; Yao et al. 2010; Li et al. 2016). In addition, aMCI patients showed age-related alterations of the topological properties in white matter (WM) structural network analysis(Zhao et al. 2017). With regard to SCD, previous studies mainly focus on the alterations in WM structural networks(Yan et al. 2018; Shu et al. 2018) and functional networks(Viviano and Damoiseaux 2020; López-Sanz et al. 2017a; López-Sanz et al. 2017b), but the alterations of the topological organization of morphometric networks in individuals with SCD remains largely unknown.
Here, we used sMRI and probability density of GM to construct individual morphometric networks. Graph theoretical analysis was used to survey the disruptions of topological properties of GM networks in individuals with SCD at six aspects: (1) the global and local network properties at global network level, such as global efficiency, local efficiency, shortest path length, clustering coefficient; (2) the global and local efficiency at nodal level; (3) the rich-club organization and their connections; (4) the small-world properties; (5) the connectivity in functional hierarchical organizations; and (6) the connections classified by anatomical distance. In addition, the age-related differences of topological properties at six aspects in NC and SCD were investigated. We hypothesized that individuals with SCD would show aberrant topological organization compared with NC, and the SCD subjects would show more rapid decline of network properties with aging at different aspects. We expected that the abnormalities of morphometric networks in individuals with SCD may give us a better understanding of the underlying neuropathological mechanisms of SCD.
2.1. Participants
In this project, 425 right-handed participants with Chinese Han nationality were recruited from May 2011 to June 2016. With regard to memory concerns, 116 patients with AD, 124 patients with MCI, 62 individuals with SCD and 39 patients with other types of dementia. These patients were recruited from memory clinic of the Neurology Department of XuanWu Hospital, Capital Medical University, China. Then, 84 normal controls were enrolled from local communities in Beijing, China. This study was performed in accordance with the rule of ethics of the Medical Research Ethics Committee in Xuanwu Hospital, and every subject gave their written informed consent to participate. The content of the assessment mainly includes the medical history investigation, neurologic examination and a neuropsychological test battery. Furthermore, the volunteers received a neuropsychological evaluation from two neurologists (worked independent and made consensus decisions), each with more than 2 years of clinical experience in neurology. The cognitive tests including Montreal Cognitive Assessment (MoCA, Beijing version)(Lu et al. 2011), Auditory Verbal Learning Test (AVLT) (include three memory tests: AVLT-immediate recall(AVLT-I), AVLT-delayed recall(AVLT-D), and AVLT-recognition(AVLT-R)), Clinical Dementia Rating (CDR)(Morris 1993), Hamilton Depression Rating Scale(HAMD), Activities of Daily Living (ADL) scale, Hachinski ischemic scale and the Center for Epidemiologic Studies depression scale(Dozeman et al. 2011). Tests above were in Chinese version.
Individuals with SCD were recognized with the conceptual framework proposed by the Subjective Cognitive Decline Initiative (SCD-I)(Jessen et al. 2014) and described in our previous studies(Yan et al. 2018; Shu et al. 2018; Fu et al. 2021), included (1) self-experienced memory decline, rather than other domains of cognition and last within five years; (2) feeling of worse performance than others of the same age group; (3) the MoCA score was in the normal range; (4) only one of the two memory tests(AVLT-D and AVLT-R) was abnormal(decline one Standard Deviation(SD) compared with NC); and (5) the CDR score was 0; (6) patients diagnosed with aMCI, AD, or other types of dementia were excluded. The inclusion criteria for NC were as follows: (1) NC had no reported memory decline; (2) the MoCA, AVLT and CDR scores were in the normal range; (3) without a history of diabetes. In addition, the normal range of neuropsychological tests were adjusted for age and education year. The exclusion criteria for all participants in this study were: (1) HAMD scores higher than 24, and the score of Center for Epidemiologic Studies depression scale higher than 21; (2) Hachinski ischemic scale in the abnormal range (higher than 4); (3) not right-handedness; (4) the executional, visual or auditory functions impaired; (5) cognitive function decline due to no-AD neurological diseases(e.g. brain tumor, brain injury, Parkinson disease, encephalitis, normal pressure hydrocephalus, multiple sclerosis or epilepsy); (6) individuals with a history of stroke; (7) subjects with a history of alcohol or drug abuse/addiction within two years(DSM-IV(Diagnostic and Statistical Manual of Mental Disorders)); (8)large-vessel disease (e.g. cortical and/or subcortical infarcts and watershed infarcts); (9) patients with any other systemic diseases or uncertainty prevents the completion of the project; (10) subjects with frequent head motion which may influence the quality of MRI. Combined with the conceptual framework of SCD and the exclusion criteria in this study, and considering the completeness MRI data, 35 individuals with SCD and 42 demographically matched NC were included in this study. Three neurologists in XuanWu hospital with 8 to 28 years of experience completed this diagnostic procedure. The main demographical and neuropsychological characteristics of all subjects are summarized in Table 1.
|
Characteristic |
NC(n = 42) |
SCD(n = 35) |
Statistical value |
P value |
|---|---|---|---|---|
|
Age(y) |
64.24 ± 6.16 (55–78) |
64.54 ± 7.29(51–80) |
0.04 |
0.843a |
|
Sex(M/F) |
15/27 |
15/20 |
-0.636 |
0.525b |
|
Education(y) |
11.17 ± 5.61(0–22) |
11.83 ± 3.67(2–18) |
0.358 |
0.551a |
|
eTIV (103 cm3) |
1.41 ± 0.12(1.14–1.70) |
1.43 ± 0.14(1.15–1.65) |
1.696 |
0.197a |
|
MoCA |
26.02 ± 2.95(18–30) |
25.26 ± 2.27(19–30) |
1.583 |
0.212a |
|
AVLT: immediate recall |
9.32 ± 1.94(6-14.7) |
8.54 ± 1.82(5.3–13.3) |
3.219 |
0.077a |
|
AVLT: delayed recall |
10.43 ± 2.31(6–15) |
8.86 ± 2.78(4–15) |
7.357 |
0.008a |
|
AVLT: recognition |
12.07 ± 2.13(8–15) |
11.37 ± 2.20(6–15) |
1.999 |
0.162a |
| Key: NC, normal controls; SCD, subjective cognitive decline; eTIV, estimated Total Intracranial Volume; MoCA, Montreal Cognitive Assessment; AVLT, Auditory Verbal Learning Test; n, number of subjects. | ||||
| aThe statistical values were computed by ANOVA (F values) except for sex. | ||||
| bThe statistical values for sex were computed by Mann-Whitney U test (Z score). | ||||
2.2. Image acquisition
Images were acquired from a 3.0 T Siemens system (Magnetom Trio Tim; Erlangen, Germany) by a sagittal magnetization-prepared rapid gradient echo (MP-RAGE) 3D sequence at the Department of Radiology, Xuanwu Hospital, Capital Medical University, Beijing, China. Anatomical T1 MRI were obtained with the following parameters: TR/TE/TI = 1900/2.2/900 ms ; flip angle = 9°; field of view = 22.4 × 25.6 cm2; matrix size = 448 × 512; number of slices = 176; and slice thickness = 1 mm. All images were examined, the leukoencephalopathy and vascular comorbidity were evaluated by an experienced neuroradiologist.
2.3. Image preprocessing procedure
First, non-uniformity intensity (N3) correction in FreeSurfer (version 6.0) (Fischl 2012) were performed on the sMRI data. Second, after N3 correction, the images were processed by CAT12(Gaser and Dahnke 2016) package embedded in Statistical Parametric Mapping software(SPM12). Through the segmentation pipeline in CAT12, T1 images were normalized to a template space and segmented into GM, WM and cerebrospinal fluid (CSF), where the Local Adaptive Segmentation (LAS) and Diffeomorphic Anatomical Registration using Exponentiated Lie algebra (DARTEL) registration(Ashburner 2007) were used. Then, the GM images were normalized to standard Montreal Neurological Institute (MNI) space. Thereafter, the voxel intensities of GM images were modulated to preserve regional volume information by Jacobian determinants derived from the normalization. Finally, the modulated GM images were isotropic smoothed with 8-mm full-width at half-maximum (FWHM) Gaussian kernel for further analyses.
2.4. Construction of morphometric networks
In order to construct the connection matrix, the two fundamental elements of network nodes and edges must be determined first. In general, the nodes are defined by different anatomical and/or functional atlases and the edges are defined by the relationships between each pair of nodes.
2.4.1 Node definition
In the study, the nodes represented by neuroanatomical structures. The automated anatomic labeling(AAL) atlas(Tzourio-Mazoyer et al. 2002) was used to parcel the brain into 90 cortical and subcortical structures defined as nodes. Besides, the AAL atlas has been widely used in previous brain network analysis.
2.4.1 Edge definition
sMRI can accurately show the anatomical structure of the brain, and the intensity of voxels within brain regions in modulated GM images can mediately represents the content of brain tissue, the distribution and density of neuronal cells. Therefore, the distribution of intensity values of voxel within a specified brain structure from MRI images can represent the morphological features of the brain structure(Kong et al. 2015; Kong et al. 2014; Tijms et al. 2012). Moreover, the Kullback-Leibler (KL) divergence was widely used to estimate the similarity of two distributions, the lower value of KL divergence the higher similarity of two distributions. In this study, for each pair of regions P and Q, we defined the edges (referred to morphological connections) between different regions as the converted symmetric KL divergence of their morphological distributions from GM images. The KL divergence can be computed by equation:

Where P(x) and Q(x) are two intensity distributions from different brain regions.
Then, the KL divergence was converted as a similarity measure using the following formula:

The KLS was normalized from 0 to 1, where 0 represents the two completely different distributions, in contrast is 1. Then, the morphological distributions from GM images were defined as estimated probability density functions (PDFs) for each region through kernel density estimation (KDE)(Botev et al. 2010), which included all voxels in each region. In particular, the Gaussian kernel is assumed and the bandwidth is chosen automatically. In order to obtain unbiased PDFs, the number of the voxel in each region were used to correct the effect of volume. Besides, the PDFs were truncated distributions, which were restricted by the range of the intensity of each region. Finally, we calculated the KLS of all each pair of the brain regions and a 90 × 90 matrix was used to quantify the morphometric connection (Fig. 1).
Figure 1A flowchart of this study. (1) The T1 images were segmented into GM, WM and cerebrospinal fluid (CSF) and normalized to standard Montreal Neurological Institute (MNI) space. (2) GM images were isotropic smoothed with 8-mm full-width at half-maximum (FWHM) Gaussian kernel. (3) The morphological distributions from GM images were defined as estimated probability density functions (PDFs) for each region through kernel density estimation (KDE), the regions were defined by AAL atlas. (4) The individual GM networks were constructed by computing the symmetric Kullback-Leibler (KL) divergence of their morphological distributions from GM images and converting the KL to similarity measure KLS. (5) The network metrics were calculated by GRETNA toolbox and the between-group differences were computed. (6) The age-related differences of network metrics in the two groups and the relationships between cognitive test and network metrics were computed.
2.5. Network analysis
2.5.1 Threshold selection
Because of the continuous weights contain more information between nodes (Barrat et al. 2004) and the structural alterations in individuals with SCD were subtle, the weighted networks were used in this study to quantify the alterations of topological organization in individuals with SCD. Sparsity was defined as the ratio of the number of existing edges divided by the maximum possible number of edges in a network(Kong et al. 2015). The sparsity approach can ensure there are same number of nodes and edges in all individual networks. Sparsity of 15% meant that only the 15% strongest edges were remained and 85% weaker edges were removed.Because there is no definitive way to select a single sparsity value(He et al. 2008; He et al. 2007), a sparsity approach with the sparsity range from 15–45% and an interval of 1%, was used to reserve meaningful connections and remove redundant invalid connections. All sparsity threshold of differences of global topological properties between the two groups were compared. To preserve more than 90% nodes in all networks and ensure all individual networks exhibited small-world properties(He et al. 2007), the sparsity threshold was set as 30% (referred to median value of the sparsity range ) in further analyses, including the topological properties at nodal level, the rich-club organization, the hierarchical organization, the connections divided by anatomical distance and the age-related alterations of topological properties.
2.5.2 Graph Theoretical Characterization
The metric of integration in a network represents the capacity of the brain to integrate the information from different brain structures, such as the global efficiency (Eglob) and Characteristic Path Length (Lp)(Latora and Marchiori 2001; Ferreira et al. 2019). The local efficiency (Eloc), the Clustering coefficient (Cp) and the modularity are measures of segregation, which represents the biologically meaningful feature of the brain to enable highly specialized processing through densely interconnected communities of regions(Ferreira et al. 2019; Watts and Strogatz 1998; Sporns 2013). In addition, the measures of centrality degree centrality (DC) and betweenness centrality (BC) were combined to identify the hub regions.
Eglob, Lp, Eloc, Cp and small-worldness properities (sigma and gamma) were used to characterize the global topological organization of the morphometric networks (Rubinov and Sporns 2010). The Clustering coefficient of a node is the ratio of if the node’s direct neighbors are neighboring with each other(Watts and Strogatz 1998). Cp for network is the average Cp for all nodes in the network. The Characteristic Path Length (Lp) is defined as the shortest path length between two nodes. Furthermore, Lp of a network is calculated by averaging the Lp for all nodes(Watts and Strogatz 1998). The global efficiency is defined as the average of reciprocal of Lp, which has a correlation with Lp. However, if the network is not fully connected, the value of Lp will be infinite, the global efficiency can avoid this phenomenon(Rubinov and Sporns 2010; Latora and Marchiori 2001). The local efficiency is defined as the average efficiency of the local subgraphs, and reveals how much the system is fault tolerant, thus it shows how efficient the communication is between the first neighbors of node i when node i is removed(Latora and Marchiori 2001). The nodal efficiency was described as the global efficiency and local efficiency at nodal level. The small-world index sigma (Humphries et al. 2006), is defined as comparing the real properties of the network with respect to corresponding random networks(Lin et al. 2018), and the number of random networks in this study was 100. The schematic representation and calculation formula of network metrics were showed in Fig. 2.
2.5.3 Rich-club organization
We used a multivariate approach to identify the hub regions of the individual morphometric networks. First, we normalized the values of DC and BC of the networks ranges from 0 to 1, and averaging them across all participants; Then, the average of normalized DC and the average of normalized DC were added; Finally, the hub regions were defined as the combine values at least 1 standard deviation higher than the mean. As the nodes were divided into hub regions and peripheral regions, the connections were classified into rich-club connections (the hub nodes link with each other), feeder connections (linking the hub nodes and peripheral nodes) and local connections (linking between peripheral nodes)(van den Heuvel and Sporns 2011; Yan et al. 2018; Shu et al. 2018).
2.5.4 Functional organization and Anatomical distance
The structural co-variance and fMRI functional connectivity showed a significant statistical relationship(Alexander-Bloch et al. 2013). To prove that the individual GM networks we built are biological meaningful, we have investigated the connectivity strength of the networks at functional organization level. To further characterize alterations in the global and local functional organization of brain networks in SCD individuals, a parcellation scheme including five key functional modules (primary sensory, subcortical, limbic, paralimbic, and association areas.) was applied in this study(Supekar et al. 2009). In previous study, MCI targeted more middle- and long-distance functional connections, which the connections were defined by the anatomical distance(Wang et al. 2013). In this study, the anatomical distance (defined as Euclidean distance between stereotaxic coordinates of the centroids for two regions) of brain structures parceled by AAL atlas were computed, and the connections were classified into short-range (lower than 45mm), middle-range (higher than 45mm and lower than 80 mm) and long-range (higher than 80 mm)(Wang et al. 2013), to investigate whether the GM networks are influenced by the anatomical distance. Then, the inter- and intra- connections of the five modules and the connections in each distance range were calculated.
All network analyses were performed on the GRETNA toolbox(Wang et al. 2015) and the results were visualized by BrainNet Viewer toolbox(Xia et al. 2013).
2.6. Statistical analysis
2.6.1 Between-group differences
Group differences of age, years of education, estimated Total Intracranial Volume (eTIV) and neuropsychological test scores (Moca and AVLT) were evaluated by analyses of variance (ANOVA) (p < 0.05). Then, the Mann-Whitney U test was used to assess the differences of sex distribution (p < 0.05). A general linear model was used to determine between-group differences of global network properties as well as the differences of connections classified by function organization, anatomical distance and hub regions, where the group factor was used as fixed effect and the factors of age, sex and years of education were covariates (p < 0.05). Moreover, the between-group differences of nodal network properties were using bonferroni corrections for multiple comparisons, which means p < 0.05/90. Finally, network-based statistic (NBS) approach based on the principles underpinning traditional cluster-based thresholding of statistical parametric maps(Zalesky et al. 2010) was used to identify a dysconnected subnetwork in the SCD group compared with NC (the effects of age, sex, and years of education were removed), with the p values of edge and component were 0.01 and 0.001, and the times of nonparametric permutation was 1000. For a detailed description of NBS, see Zalesky et al(Zalesky et al. 2010).
2.6.2 Age-related differences
To determine the interactive effect of age and group, a stepwise regression model (p < 0.05) and partial correlation analysis (p < 0.05) were adopted in this study(Zhao et al. 2017; Brown et al. 2011). A stepwise regression procedure began with age, group, age × group interaction, sex, years of education, and returned the subset of terms producing the most accurate model was selected. Thereafter, interpretability of the selected model was confirmed by performing a partial correlation analysis between network measures with significant interaction effect and age, separately for NC and SCD, with removement of the effects of sex and years of education. No multiple comparisons adjustment was performed on partial correlation analysis here, because the nodes were selected by the prior stepwise regression model and we consider this is an exploratory study.
2.6.3 Associations between network metrics and cognitive scores
We used partial Pearson’s correlations controlled for age, sex and years of education to evaluate how clinical performance related to the altered network measures in individuals with SCD. The significance threshold was set at p < 0.05. All the statistical analyses were performed on MATLAB and SPSS.
2.7. Reproducibility analysis
Herein, we have computed the global network measures with a wide range of sparsity (15%-45%), and the between-group differences were assessed in all sparsity thresholds. In addition, we employed different parcellation schemes to define network nodes. The AAL atlas contain 12 subcortical structures, and we removed the subcortical structures to construct a 78 × 78 matrix to quantify the cortical network connections. Then, we repeated the same network analyses.
3.1. Background characteristics of the participants
The differences were not significant in age, sex, years of education, eTIV, MoCA scores, ALVT-immediate recall and AVLT-recognition scores between the NC and SCD group. In particular, the SCD group performed worse than the NC group in delayed recall of the AVLT (p < 0.05). The results of this section were summarized in Table 1.
3.2 Between-group differences of network metrics
3.2.1 Global network properties
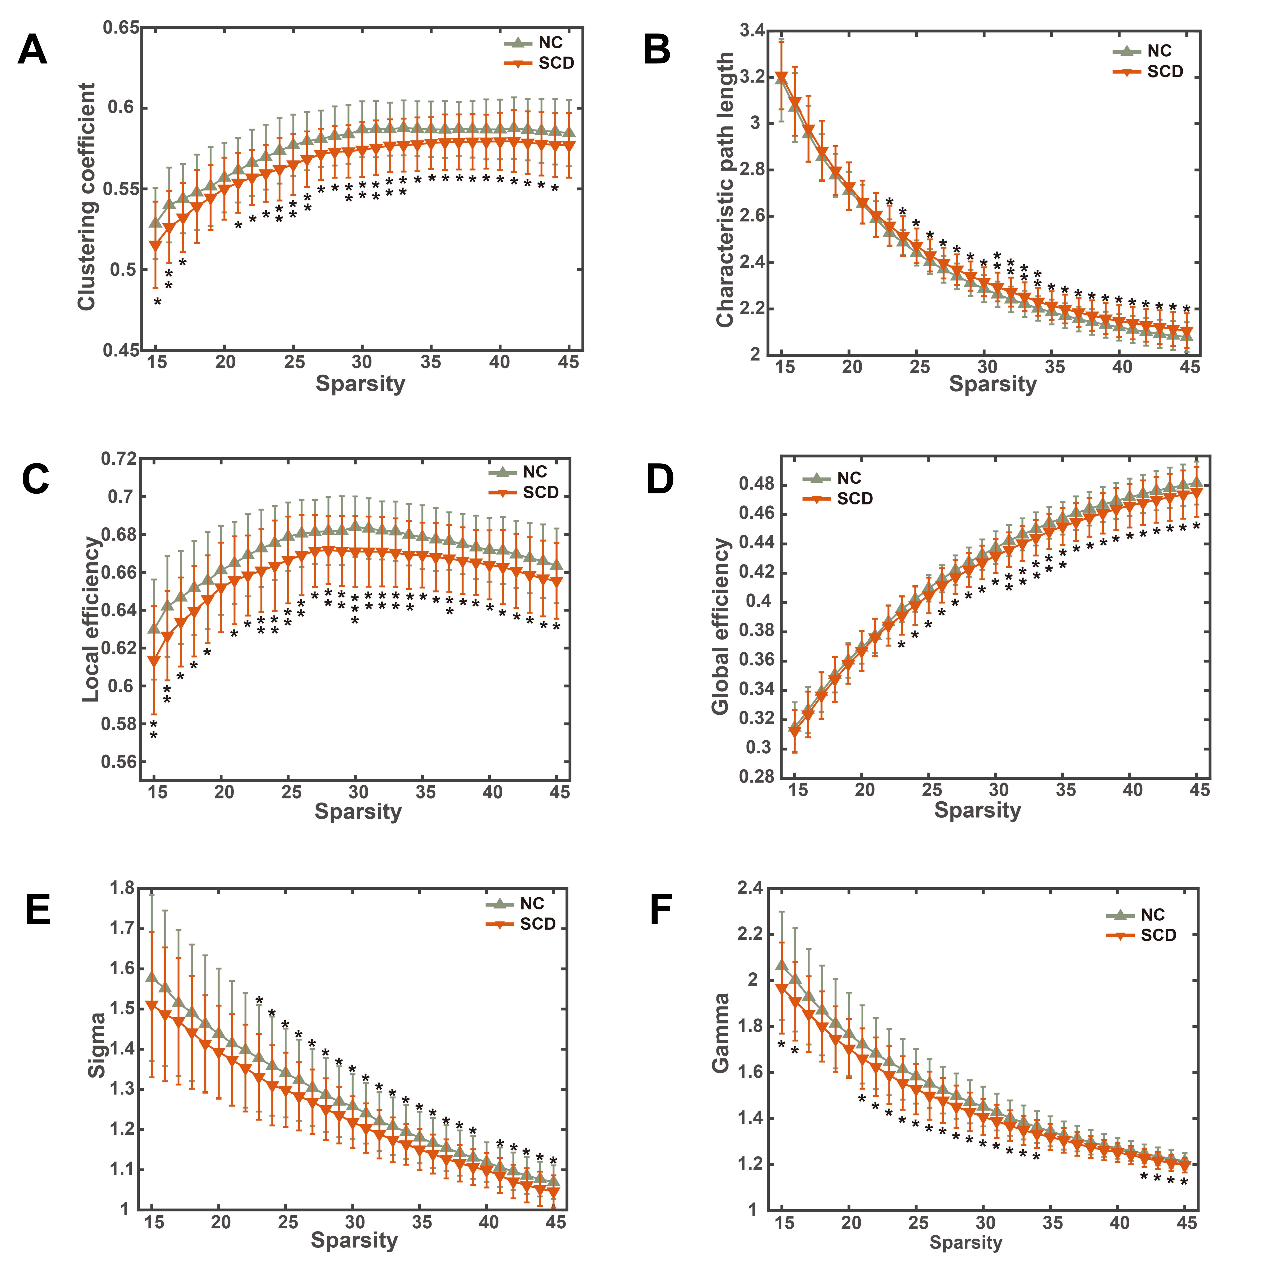
The small-world networks characterized with higher clustering coefficients and similar characteristic path length compared with random networks. In this study, all individual morphometric networks exhibited small-world properties, where the Lp were similar with the matched random networks (lambda ≈ 1) and the Cp were higher than the matched random networks (gamma > 1) in all sparsity thresholds. In addition, that the sigma higher than 1 in all networks demonstrates a small-world organization in each network. Compared with NC group, the sigma was slightly lower in SCD group(p < 0.05), which the sparsity located in 17–33%. Besides, another small world parameter gamma (at the sparsity of 15–32% with exception of 16%) was lower in individuals with SCD than NC (p < 0.05). Compared with NC group, the changes of Eglob (lower in SCD) and Lp (higher in SCD) were significant in SCD group at the sparsity from 22–45%. Significant decreases of Cp (except the sparsity of 17% and 37%) and Eloc (except the sparsity of 21%) had been detected in SCD compared with NC group (Fig. 2). In addition, all the network properties at the sparsity of 30% in individuals with SCD were deterioration compared with NC.
Figure 2 Between-group differences in global network metrics as a function of sparsity. (1) The middle column is the schematic representation and calculation formula of network metrics. In the order from top to bottom, they are clustering coefficient, shortest path length or characteristic path length, local efficiency, global efficiency and the schematic representation of small-world network and random network. (2) The left and right column are the between-group differences of the network metrics. The arrows point from the representation of the network parameters to the results of the between-group differences. One asterisk means p < 0.05, two asterisk means p < 0.01, three asterisk means p < 0.001.
3.2.2 Nodal network properties and Rich-club organization
Compared with NC group, the nodal local and global efficiency were significant decreased only in left paracentral lobule (p < 0.05, Bonferroni corrected). Based on the combined measure, similar hub distributions were observed in the two group, mainly located in left thalamus, Pre-frontal lobe, occipital lobe and parietal lobe, which 17 regions in NC and 16 regions in SCD (Fig. 3A and Table S2). In addition, 13 hub regions in the two groups were overlapped. For different categories of connections classified by hub regions (Fig. 3B), the feeder connections showed lower strength in SCD subjects compared with NC (F = 11.515, p = 0.001), which consistent with the previous WM network studies(Shu et al. 2018; Yan et al. 2018). All comparisons in this section were performed at the sparsity of 30%.
3.2.4 Functional organization and Anatomical distance
For intra-connections within the five functional organizations, the lower connectivity strength of paralimbic system was observed in individuals with SCD (F = 5.216, p = 0.025) (Fig. 3E). The inter-module connections between paralimbic and association area (F = 4.375, p = 0.04) as well as the inter-connections between paralimbic and subcortical (F = 4.291, p = 0.042) were significantly lower in SCD subjects compared with NC. In addition, the strength of long connectivity (anatomical distance larger than 80mm) was significantly decreased in individuals with SCD compared with NC (F = 4.22, p = 0.044) (Fig. 3B).
Analysis of the network-based statistic resulted with one subnetwork with 24 nodes and 24 connections (edge-p < 0.01 and component-p = 0.002) (Fig. 3C). The NBS connectivity strength was the total strength within the disconnected network. The receiver operating characteristic curve (ROC) analysis revealed the connectivity strength of the subnetwork identified by NBS, showing high area under curve (AUC) value of 0.959 for classifying the two groups (Fig. 3D). In addition, the network connectivity strength in SCD group was lower than in NC group (F = 4.538, p = 0.037) (Fig. 3B). The results in this section were based on the networks with sparsity of 30%.
Figure 3 Between-group differences of rich-club organization and network connections as well as age-related differences in SCD and NC. (A) The hub distributions of the GM networks in the NC group and SCD group. An illustration of the connections divided by hub regions. (B) The between-group differences of the strength of network, feeder connectivity and long connectivity. (C) The disrupted subnetwork in individuals with SCD calculated by network-based statistic (NBS) approach. (D) The receiver operating characteristic (ROC) curve of the NBS connection strength. (E) Between-group differences of the intra-connectivity of the five functional organizations. The intra-connectivity strength of the five modules in NC group (bule line) were normalized to 0 and the relative difference differences of intra-connectivity strength of the five modules in SCD group were showed by the orange line. (F) The group-specific age-related differences of NBS connection strength in individuals with SCD and normal controls.
3.3 Age-related effects on topological properties of network
All the network metrics which showed significant relationships with age\(\times\)group interaction in the stepwise regression model and the partial correlation analyses for the selected network metrics were summarized in this section.
For the global network metrics, the age\(\times\)group interaction effects exhibited significance in characteristic path length (t = 3.063, p = 0.003, beta = 0.333) (Fig. 4A), global efficiency (t=-3.069, p = 0.003, beta=-0.334) (Fig. 4A), clustering coefficient (t=-3.603, p = 0.001, beta=-0.384) (Fig. 5A) and local efficiency (t=-3.991, p < 0.001, beta=-0.419) (Fig. 5A) (Table 2). The followed partial correlation analyses showed that significant relationships between characteristic path length (r = 0.416, p = 0.008), global efficiency (r=-0.421, p = 0.007), clustering coefficient (r=-0.291, p = 0.0499), local efficiency (r=-0.402, p = 0.01) and age within SCD group, while those network metrics exhibited nonsignificant correlation within NC group.
|
Network metrics |
P value (T value) of interaction |
Partial correlation within each group |
|
|---|---|---|---|
|
NC |
SCD |
||
|
Lp |
0.003(3.063) |
r = 0.162; p = 0.159 |
r = 0.416; p = 0.008 |
|
Cp |
0.001(-3.603) |
r=-0.01; p = 0.477 |
r=-0.291; p = 0.0499 |
|
Eglob |
0.003(-3.069) |
r=-0.172; p = 0.144 |
r=-0.421; p = 0.007 |
|
Eloc |
< 0.001(-3.991) |
r = 0.026; p = 0.437 |
r=-0.402; p = 0.010 |
|
Regions for nodal Eglob |
|||
|
Left superior frontal dorsolateral gyrus |
0.049(-2.002) |
r = 0.029; p = 0.430 |
r=-0.068; p = 0.354 |
|
Left inferior frontal opercular gyrus |
0.024(-2.300) |
r=-0.057; p = 0.364 |
r=-0.331; p = 0.030 |
|
Right inferior frontal opercular gyrus |
0.024(-2.305) |
r=-0.177; p = 0.138 |
r=-0.289; p = 0.052 |
|
Right superior frontal medial orbital gyrus |
0.017(-2.438) |
r=-0.087; p = 0.298 |
r=-0.396; p = 0.011 |
|
Left anterior cingulate |
0.039(-2.100) |
r=-0.187; p = 0.124 |
r=-0.300; p = 0.045 |
|
Right parahippocampal gyrus |
0.031(-2.198) |
r=-0.347; p = 0.014 |
r=-0.174; p = 0.166 |
|
Left temporal pole: middle temporal gyrus |
0.008(-2.705) |
r=-0.146; p = 0.184 |
r=-0.232; p = 0.097 |
|
Regions for nodal Eloc |
|||
|
Right middle frontal orbital gyrus |
0.018(t=-2.416) |
r=-0.062; p = 0.353 |
r=-0.068; p = 0.354 |
|
Right superior frontal medial orbital gyrus |
0.007(t=-2.774) |
r = 0.157; p = 0.167 |
r=-0.331; p = 0.030 |
|
Right gyrus rectus |
0.021(t=-2.363) |
r=-0.185; p = 0.126 |
r=-0.289; p = 0.052 |
|
Right insula |
0.014(t=-2.505) |
r = 0.02; p = 0.452 |
r=-0.396; p = 0.011 |
|
Right inferior occipital gyrus |
0.006(t=-2.808) |
r=-0.041; p = 0.400 |
r=-0.300; p = 0.045 |
|
Right paracentral lobule |
< 0.001(t=-4.199) |
r = -0.302; p = 0.029 |
r=-0.174; p = 0.166 |
|
Left putamen |
0.008(t=-2.747) |
r= -0.081; p = 0.310 |
r=-0.232; p = 0.097 |
| Key: NC, normal controls; SCD, subjective cognitive decline; Eglob, global efficiency; Eloc, local efficiency; Lp, Characteristic Path Length; Cp, Clustering coefficient | |||
Figure 4 Age-related differences of global efficiency and characteristic path length (A) and the distribution of regions with significant age-related differences of nodal global efficiency(B). The anatomical structures were visualized by BrainNet Viewer toolbox.
For nodal global efficiency, the regression model revealed significant age\(\times\)group interaction effects in 7 regions (Table 2) (all p < 0.05), including left superior frontal dorsolateral gyrus, bilateral inferior frontal opercular gyrus, right superior frontal medial orbital gyrus, left anterior cingulate and paracingulate gyri, right parahippocampal gyrus and temporal pole of middle temporal gyrus (Fig. 4B). Partial correlation analyses demonstrated that nodal global efficiency of bilateral inferior frontal opercular gyrus (left: r=-0.331, p = 0.03; right: r=-0.289, p = 0.05), right superior frontal medial orbital gyrus(r=-0.396, p = 0.011), left anterior cingulate and paracingulate gyri(r=-0.300, p = 0.045) showed significant negative correlations with age with in SCD group, while nonsignificant correlations were found in NC group (Fig. 4B). In addition, the nodal global efficiency of right parahippocampal gyrus (r=-0.347, p = 0.014) showed significant negative correlation with age in NC group, otherwise in SCD group (Fig. 4B). For nodal local efficiency, 7 regions demonstrated significant age\(\times\)group interaction effects in the stepwise regression model (Table 2) (all p < 0.05), including right middle frontal orbital gyrus, right superior frontal medial orbital gyrus, right insula, right inferior occipital gyrus, right paracentral lobule and left putamen (Fig. 5B). Partial correlation analyses revealed that nodal local efficiency of right insula (r=-0.486, p = 0.002), right inferior occipital gyrus (r=-0.292, p = 0.05) and left putamen (r=-0.379, p = 0.014) showed significant negative age-related within SCD group, while nonsignificant correlations were found in NC group (Fig. 5B). Besides, the right paracentral lobule (r=-0.302, p = 0.029) showed significant decrease with age in nodal local efficiency in NC group, but not within SCD group (Fig. 5B).
Figure 5 Age-related differences in local efficiency and clustering coefficient (A) and the distribution of regions with significant age-related differences of nodal local efficiency(B). The anatomical structures were visualized by BrainNet Viewer toolbox.
For the connectivity at divisional level (association area, limbic, paralimbic, primary sensory, and subcortical), the stepwise regression model revealed that intra-connectivity of paralimbic system, inter-connectivity between association area and paralimbic system, as well as inter-connectivity between paralimbic system and subcortical showed significant age\(\times\)group interaction effects across all participants(p < 0.05). For partial correlation analyses, the inter-connectivity between association area and paralimbic system (r=-0.321, p = 0.034) showed significant correlation with age within SCD group, while nonsignificant correlation was found in NC group. Additionally, the intra-connectivity of paralimbic system in NC group showed significant correlation with age but not in SCD group. The connectivity strength of the subnetwork calculated by NBS exhibited significant age\(\times\)group interaction effects in the regression model (t=-11.514, p < 0.001, beta=-0.799), and the followed partial correlation analyses revealed significant correlation between age and the calculated connectivity strength within SCD group (r=-0.412, p = 0.009), while nonsignificant correlation was found in NC group (Fig. 3F). All comparisons in this section were performed at the sparsity of 30%.
3.4 Associations between altered network metrics and clinical performance
For small-world properties, the sigma in SCD group showed significant correlation with delayed recall score of AVLT (r=-0.329, p = 0.033) and recognition score of AVLT (r=-0.297, p = 0.049). Besides, the gamma showed significant correlation with recognition score of AVLT (r=-0.308 p = 0.043) in individuals with SCD. Within SCD group, the nodal global efficiency of left superior frontal dorsolateral gyrus (r = 0.473, p = 0.003) and right inferior frontal opercular gyrus (r=-0.305, p = 0.045) showed significant correlation with delayed recall score of AVLT. Then, lower nodal efficiency of bilateral inferior frontal opercular gyrus (left: r=-0.331, p = 0.032; right: r=-0.362, p = 0.021) were correlated with higher recognition scores of AVLT in SCD group. The nodal local efficiency of right insula exhibited significant correlation with delayed recall score of AVLT (r = 0.321, p = 0.036). In addition, the nodal local efficiency in right superior frontal medial orbital gyrus (r = 0.321, p = 0.037) showed significant correlation with MoCA scores. For connectivity strength, the strength of feeder (-0.302, p = 0.046) connectivity showed significant correlation with MoCA scores.
3.5 Reproducibility findings
The effects of the sparsity threshold for global network metrics were validated, and the results were summarized above. All 12 subcortical regions were excluded from the AAL atlas and the cortical network were constructed by using the same method. All cortical networks we have constructed were characterized with small world properties, which the Lp were similar with the matched random networks (lambda ≈ 1) and the Cp were higher than the matched random networks (gamma > 1) in all sparsity thresholds (sigma > 1) (Fig. S1). The clustering coefficients in individuals with SCD showed higher significance compared with NC group, at sparsity range of 15%-44%, except 19%-20% (all p < 0.05). Then, the local efficiency exhibited decrease in SCD group compared with NC at all sparsity thresholds excepted 21% (all p < 0.05). Thereafter, the characterized path length was longer in SCD group compared with NC at the sparsity of 23%-45% (all p < 0.05). In addition, the global efficiency was higher in NC group compared with SCD at the sparsity of 23%-45% (all p < 0.05). For the small world properties, sigma (at the sparsity of 23%-39% and 41%-45%) and gamma (at the sparsity of 15%-16%, 21%-34% and 43%-45%) were higher in NC group compared with SCD group (all p < 0.05). The global network metrics in this section were consistent with the findings before (Fig. S1). For rich-club organization, 15 hub regions were found in each group (Table S2) and the strength of feeder connections were lower in SCD group compared with NC. Also, the subnetwork based on NBS can divide the two groups accurately (edge-p < 0.01 and component-p = 0.005).
For age-related difference, the local/global efficiency (Eloc: t=-3.737, p < 0.001, beta=-0.396; Eglob: t=-2.916, p = 0.005, beta=-0.319), clustering coefficients (t=-3.381, p = 0.001, beta=-0.364), shortest path length (t = 2.907, p = 0.005, beta = 0.318) and sigma (t=-2.456, p = 0.016, beta=-0.273) showed significant age\(\times\)group interaction effects in the regression model. Partial correlation analyses revealed the global efficiency (r=-0.462, p = 0.003) and shortest path length (r=-0.460 p = 0.004) showed significant correlation with age within SCD group but not in NC (Table S3). For regional global efficiency, similar distributions of region were found significantly correlated with age, which mainly located in bilateral inferior frontal opercular gyrus, right superior frontal medial orbital gyrus left anterior cingulate and paracingulate gyri and right parahippocampal gyrus (Table S3). In general, the findings showed slight effects of subcortical structures for global metrics, but changed local network properties.
DISSCUSSION
In this study, we used individual morphometric networks and graph theory analysis to assess the altered topological properties in individuals with SCD and age-related differences compared with NC. Main findings were as follows: (1) the global network metrics such as global/local efficiency, clustering coefficients and small world properties decreased in SCD compared with NC; (2) the altered nodal network metrics in SCD mainly located in prefrontal lobe, parietal lobe and subcortical system; (3) compared with NC, significant decreases of global/local efficiency with increasing age were found in SCD subjects; (4) the significant age-related differences of nodal network metrics between two groups mainly located in prefrontal lobe; (5) disrupted strength of paralimbic system and feeder connectivity were found in SCD group. Finally, the robustness of the results was validated by using different sparsity thresholds as well as the effects of subcortical structures.
4.1 Aberrant topological organization in individuals with SCD
Compared with NC, we have observed lower global/local efficiency, clustering coefficients, sigma and gamma, as well as higher shortest path length in SCD group. The results of global/local efficiency, clustering coefficients, shortest path length and gamma were consistent with previous WM structural network studies of SCD(Shu et al. 2018; Yan et al. 2018). In addition, the strength of network connectivity in SCD group was lower than in NC group. Several previous morphometric networks analyses of MCI and AD have revealed that significant increased shortest path length and decreased global efficiency were exhibited in AD-related patients(Li et al. 2018; He et al. 2008; Yao et al. 2010; Li et al. 2016). In contrast with our results, the clustering coefficients in AD-related patients based on GM networks exhibited significant increase(He et al. 2008; Li et al. 2016; Yao et al. 2010). In our opinion, the main factor is that those studies were based on group networks, while our study was based on individual networks. Specifically, the group network means “one group, one network”, while the individual network means the network are constructed for all participants separately. Thus, the group network may reduce individual differences and need large number of participants. With the studies based on functional MRI, decreased strength of functional connectivity in individuals with SCD, AD and MCI patients were found(Wang et al. 2013; Bai et al. 2011; Li et al. 2019; Viviano et al. 2019). With regard to the WM structural network studies based on diffusion MRI, increased shortest path length and decreased efficiency exhibited in AD and MCI patients(Shu et al. 2012; Zhao et al. 2017; Lo et al. 2010; Daianu et al. 2015; Cao et al. 2020). In addition, the direction of the topological organization alterations in individuals with SCD were similar with the AD-related patients, which indicate higher risk to cognitive decline in the future.
The functional network based on fMRI coordinated brain activity correlations of the fluctuate magnetic properties of oxygenated blood between regions, which can reflect the synchronized activity between brain regions(Alexander-Bloch et al. 2013). Disrupted topological organization of functional network in AD-related patients meant that functional integration and segregation of the brain activity was deterioration. While, WM fiber bundles across the entire brain traced in diffusion MRI was labelled ‘WM anatomical network’, which can reflect the WM fiber connections between brain regions. Altered topological organization of WM structure network in AD-related patients meant that the WM fiber connections were impaired. Then, the GM network coordinated the morphological features between GM regions of brain, which can reflect the synchronized anatomical changes of GM in brain(Alexander-Bloch et al. 2013). Altered topological organization of GM network in AD-related patients may be suggestive of GM loss in correlated regions or localized degeneration in one region. The similarities in results across imaging modalities meant that the synchronized anatomical change indeed results from brain connectivity of some kind, such as synchronized brain activity change and/or WM fiber connections.
Our results partial consistent with previous studies across imaging modalities above, which meant that the individuals GM networks can accurately explore the structural alterations of brain at network level in individuals with SCD independently.
For rich-club organization, the distributions of hub regions were similar in two groups, and the decreased strength of feeder connectivity was showed in SCD group, which our results are consistent with previous network SCD studies based on diffusion MRI(Shu et al. 2018; Yan et al. 2018). Previous studies demonstrated that in AD and MCI patients the rich-club organization was persevered, and the connections including peripheral regions were attacked(Cao et al. 2020; Daianu et al. 2015). Although the hub regions characterized with high activity and metabolism may accelerate pathology of AD(Buckner et al. 2009), whether the attacks beginning within hub regions or nonhub regions remains unclear. Our results showed that the connections including peripheral regions were vulnerability in individuals with SCD compared with NC.
For functional organization, the intra- and inter-connections including paralimbic system decreased in SCD group compared with NC in this study. The paralimbic system is one of the transmodal areas with highest synaptic levels of sensory-fugal processing(Mesulam 1998), which plays a causal role in activating attentional and memory systems within association areas to facilitate controlled processing of stimuli during cognitively demanding tasks(Supekar et al. 2009; Sridharan et al. 2008). In our results, the decreased integration of paralimbic system and association areas in individuals with SCD may induce the decline of the cognitive ability. In addition, the altered intra-connections in paralimbic system and inter-connections between paralimbic system and subcortical in SCD group may enhance that individuals with SCD are at higher risk to cognitive decline in the future compared with NC.
The GM degeneration in individuals with SCD has been detected in previous studies(Zhao et al. 2019; Rabin et al. 2017). However, the underlying neuropathological mechanism of GM degeneration in SCD still remains barely unknown. We have revealed the GM degeneration at a large system level, and studies combined with multimodal imaging techniques should be considerate by researchers in the future.
4.2 Age-related differences of network metrics
For global network metrics, the global efficiency and local efficiency in SCD showed significant age\(\times\)group interaction effects, which was consistent with previous results from MCI studies(Zhao et al. 2017). Then, the partial correlation analyses revealed that global efficiency and local efficiency were significant correlated with age in individuals with SCD, while nonsignificant correlations were found in NC subjects. Moreover, similar with global/local efficiency, the shortest path length and clustering coefficients showed significant age\(\times\)group interaction effects, and there were significant relationships between those properties and age in individuals with SCD. Age is the main risk factor of AD, and accelerated decrease of global network metrics with age in SCD indicates that SCD subjects with the future risk of cognitive decline.
For nodal efficiency metrics, some brain regions showed decrease with age in individuals with SCD, including bilateral inferior frontal opercular gyrus, right superior frontal medial orbital gyrus, left anterior cingulate and paracingulate gyri, right insula, right inferior occipital gyrus and left putamen. These regions mainly located in prefrontal lobe and subcortical system. While, the lateral prefrontal cortex plays a critical role in working memory-executive function network(Mesulam 1998), and the anterior medial prefrontal cortex belong to midline core of default mode network (DMN)(Montembeault et al. 2016). In addition, the prefrontal regions and DMN are vulnerable to AD pathology(Zhou et al. 2015; McKenna et al. 2016; Simic et al. 2014).
Moreover, the nodal efficiency of parahippocampal gyrus showed significant correlation with age in NC group, while not in SCD group. The parahippocampal gyrus is an important region for memory function, which has been shown to preferentially targeted in AD and MCI patients(Yin et al. 2015). To the best of our knowledge, majority of individuals with SCD will not show progressive cognitive decline(Jessen et al. 2020) and it is a stage independent with AD and MCI, indicating that the parahippocampal gyrus connections in individuals with SCD may be similar to NC compared with AD-related patients. A longitudinal study revealed that MCI patients showed accelerated GM decrease compared with normal controls in whole brain volume, temporal gray matter, and orbitofrontal and temporal association cortices, including the hippocampus(Driscoll et al. 2009). Our study revealed that individuals with SCD showed accelerated GM degeneration with age at a macroscopic scale. However, the underlying mechanism of the age-related changes, AD-related pathology changes and their co-pathologies were still need to explore.
4.3 Correlation between network metrics and clinical scores
Clinical neuropsychological testing is a conventional method for memory examinations and disease-assisted diagnoses. Then, two test scores were used for correlation analysis, including AVLT and MoCA. We have observed that the delayed recall score of AVLT exhibited significant correlation with sigma and gamma in individuals with SCD. Moreover, significant correlation between sigma and recognition score of AVLT was found in individuals with SCD but not in NC subjects. Sigma and gamma were classical small world indices, and if the indices were higher, the property of small world was stronger. In the sense, stronger the small world organization, the higher and more efficient information segregation and integration. A longitudinal study based on morphometric networks for individuals with SCD revealed that lower gamma and lambda values were significantly associated with steeper decline in global cognition including memory decline(Verfaillie et al. 2018). However, previous WM structural network analyses(Shu et al. 2018; Zhao et al. 2017) revealed that the connectivity of rich-club, feeder and local were correlated with the delayed recall score of AVLT, but not showed in our study. In this study, the strength of feeder connectivity showed significant correlation with MoCA scores. In our opinion, the difference between our study and previous studies is mainly due to the different neurobiological mechanisms behind GM networks and WM networks. The correlative variation in GM network means the changing of regional morphology, and the correlations in WM network represents the strength of WM fiber connectivity between two regions. The GM network and WM network characterize the network in human brain in two ways. In addition, majority of correlations between the network measures and cognitive test scores were negative, a more randomly organized GM network would be a reason(Verfaillie et al. 2018). In the end, the coordination of GM network, WM network and functional network to investigate the alterations in individuals with SCD should be considered in future studies.
4.4 Limitations
Methodological issues in our research should be addressed. First, the sample size is small. Although we have constructed the individual network in this study, a large sample size will be better. Second, cross-sectional samples were used in this study, so a longitudinal MRI data will be collected for future study. Third, only distribution of GM density was used to construct the networks, and thus more morphological indices will be used to define the network connections. Fourth, very limited neuropsychological battery adopted was always a limitation. As the modified research framework for SCD was published(Jessen et al. 2020), more comprehensive neuropsychological tests should be addressed.
In summary, this study revealed that aberrant topological organization was showed in individuals with SCD, including the decreased local/global efficiency, clustering coefficients, sigma, gamma and the increased shortest path length. Compared with NC group, the rich-club connections in individuals with SCD were persevered but the feeder connections decreased. Moreover, the connectivity of paralimbic system was disrupted in individuals with SCD compared with NC subjects. In addition, the age-related decreases in nodal global efficiency in individuals with SCD mainly distributed in prefrontal lobe. The findings in this study may enhance the understanding of the underlying pathological mechanisms in individuals with SCD.
Acknowledgements: This work was supported by the National Natural Science Foundation of China (Grant No. 81972160, 61633018, 82020108013, 82001773 and 81622025).
Author contributions: Conceptualization: ZRF, SYL and YH; Methodology: ZRF, MYZ, XTW; Formal analysis and investigation: ZRF; Writing—original draft preparation: ZRF; Writing—review and editing: ZRF, YRH, SYL, YH, XL and GXK; Resources: SYL and YH; Supervision: SYL and YH. All authors read and approved the final manuscript
Compliance with ethical standards
Ethical standard: This study was approved by the Medical Research Ethics Committee in Xuanwu Hospital, China, and all individuals gave written informed consent to participate.
Disclosure: All authors declare that they have no competing interests.
Availability of data, material and code: The data, material and code that support the findings of this study are available from the corresponding author upon reasonable request.
- Alexander-Bloch A, Giedd JN, Bullmore E (2013) Imaging structural co-variance between human brain regions. Nature reviews Neuroscience 14(5):322–336. doi:10.1038/nrn3465
- Amariglio RE, Buckley RF, Mormino EC, Marshall GA, Johnson KA, Rentz DM, Sperling RA (2018) Amyloid-associated increases in longitudinal report of subjective cognitive complaints. Alzheimer's & dementia (New York, N Y) 4:444–449. doi:10.1016/j.trci.2018.08.005
- Ashburner J (2007) A fast diffeomorphic image registration algorithm. NeuroImage 38(1):95–113. doi:10.1016/j.neuroimage.2007.07.007
- Bai F, Watson DR, Shi Y, Wang Y, Yue C, YuhuanTeng, Wu D, Yuan Y, Zhang Z (2011) Specifically progressive deficits of brain functional marker in amnestic type mild cognitive impairment. PloS one 6(9):e24271. doi:10.1371/journal.pone.0024271
- Barrat A, Barthélemy M, Pastor-Satorras R, Vespignani A (2004) The architecture of complex weighted networks. Proc Natl Acad Sci USA 101(11):3747–3752. doi:10.1073/pnas.0400087101
- Besson FL, La Joie R, Doeuvre L, Gaubert M, Mézenge F, Egret S, Landeau B, Barré L, Abbas A, Ibazizene M, de La Sayette V, Desgranges B, Eustache F, Chételat G (2015) Cognitive and Brain Profiles Associated with Current Neuroimaging Biomarkers of Preclinical Alzheimer's Disease. The Journal of neuroscience: the official journal of the Society for Neuroscience 35(29):10402–10411. doi:10.1523/jneurosci.0150-15.2015
- Botev ZI, Grotowski JF, Kroese DP (2010) Kernel density estimation via diffusion. Ann Statist 38(5):2916–2957
- Brown JA, Terashima KH, Burggren AC, Ercoli LM, Miller KJ, Small GW, Bookheimer SY (2011) Brain network local interconnectivity loss in aging APOE-4 allele carriers. Proc Natl Acad Sci USA 108(51):20760–20765. doi:10.1073/pnas.1109038108
- Buckner RL, Sepulcre J, Talukdar T, Krienen FM, Liu H, Hedden T, Andrews-Hanna JR, Sperling RA, Johnson KA (2009) Cortical hubs revealed by intrinsic functional connectivity: mapping, assessment of stability, and relation to Alzheimer's disease. The Journal of neuroscience: the official journal of the Society for Neuroscience 29(6):1860–1873. doi:10.1523/jneurosci.5062-08.2009
- Cao R, Wang X, Gao Y, Li T, Zhang H, Hussain W, Xie Y, Wang J, Wang B, Xiang J (2020) Abnormal Anatomical Rich-Club Organization and Structural-Functional Coupling in Mild Cognitive Impairment and Alzheimer's Disease. Front Neurol 11:53. doi:10.3389/fneur.2020.00053
- Chen ZJ, He Y, Rosa-Neto P, Gong G, Evans AC (2011) Age-related alterations in the modular organization of structural cortical network by using cortical thickness from MRI. NeuroImage 56(1):235–245. doi:10.1016/j.neuroimage.2011.01.010
- Chételat G, Landeau B, Eustache F, Mézenge F, Viader F, de la Sayette V, Desgranges B, Baron JC (2005) Using voxel-based morphometry to map the structural changes associated with rapid conversion in MCI: a longitudinal MRI study. NeuroImage 27(4):934–946. doi:10.1016/j.neuroimage.2005.05.015
- Daianu M, Jahanshad N, Nir TM, Jack CR Jr, Weiner MW, Bernstein MA, Thompson PM (2015) Rich club analysis in the Alzheimer's disease connectome reveals a relatively undisturbed structural core network. Hum Brain Mapp 36(8):3087–3103. doi:10.1002/hbm.22830
- Dozeman E, van Schaik DJ, van Marwijk HW, Stek ML, van der Horst HE, Beekman AT (2011) The center for epidemiological studies depression scale (CES-D) is an adequate screening instrument for depressive and anxiety disorders in a very old population living in residential homes. Int J Geriatr Psychiatry 26(3):239–246. doi:10.1002/gps.2519
- Driscoll I, Davatzikos C, An Y, Wu X, Shen D, Kraut M, Resnick SM (2009) Longitudinal pattern of regional brain volume change differentiates normal aging from MCI. Neurology 72(22):1906–1913. doi:10.1212/WNL.0b013e3181a82634
- Ferreira D, Nordberg A, Westman E (2020) Biological subtypes of Alzheimer disease: A systematic review and meta-analysis. Neurology 94(10):436–448. doi:10.1212/wnl.0000000000009058
- Ferreira D, Pereira JB, Volpe G, Westman E (2019) Subtypes of Alzheimer's Disease Display Distinct Network Abnormalities Extending Beyond Their Pattern of Brain Atrophy. Front Neurol 10:524. doi:10.3389/fneur.2019.00524
- Fischl B (2012) FreeSurfer NeuroImage 62(2):774–781. doi:10.1016/j.neuroimage.2012.01.021
- Fjell AM, McEvoy L, Holland D, Dale AM, Walhovd KB (2014) What is normal in normal aging? Effects of aging, amyloid and Alzheimer's disease on the cerebral cortex and the hippocampus. Progress in neurobiology 117:20–40. doi:10.1016/j.pneurobio.2014.02.004
- Fu Z, Zhao M, Wang X, He Y, Tian Y, Yang Y, Han Y, Li S (2021) Altered Neuroanatomical Asymmetries of Subcortical Structures in Subjective Cognitive Decline, Amnestic Mild Cognitive Impairment, and Alzheimer's Disease. Journal of Alzheimer's disease: JAD 79(3):1121–1132. doi:10.3233/jad-201116
- Gallassi R, Oppi F, Poda R, Scortichini S, Stanzani Maserati M, Marano G, Sambati L (2010) Are subjective cognitive complaints a risk factor for dementia? Neurological sciences: official journal of the Italian Neurological Society and of the Italian Society of Clinical Neurophysiology 31 (3):327–336. doi:10.1007/s10072-010-0224-6
- Gaser C, Dahnke R (2016) CAT-A Computational Anatomy Toolbox for the Analysis of Structural MRI Data. Paper presented at the HBM
- He Y, Chen Z, Evans A (2008) Structural insights into aberrant topological patterns of large-scale cortical networks in Alzheimer's disease. The Journal of neuroscience: the official journal of the Society for Neuroscience 28(18):4756–4766. doi:10.1523/jneurosci.0141-08.2008
- He Y, Chen ZJ, Evans AC (2007) Small-world anatomical networks in the human brain revealed by cortical thickness from MRI. Cerebral cortex (New York, NY: 1991) 17 (10):2407–2419. doi:10.1093/cercor/bhl149
- Humphries MD, Gurney K, Prescott TJ (2006) The brainstem reticular formation is a small-world, not scale-free, network. Proceedings Biological sciences 273 (1585):503–511. doi:10.1098/rspb.2005.3354
- Jack CR Jr, Bennett DA, Blennow K, Carrillo MC, Dunn B, Haeberlein SB, Holtzman DM, Jagust W, Jessen F, Karlawish J, Liu E, Molinuevo JL, Montine T, Phelps C, Rankin KP, Rowe CC, Scheltens P, Siemers E, Snyder HM, Sperling R (2018) NIA-AA Research Framework: Toward a biological definition of Alzheimer's disease. Alzheimer's dementia: the journal of the Alzheimer's Association 14(4):535–562. doi:10.1016/j.jalz.2018.02.018
- Jack CR Jr, Bennett DA, Blennow K, Carrillo MC, Feldman HH, Frisoni GB, Hampel H, Jagust WJ, Johnson KA, Knopman DS, Petersen RC, Scheltens P, Sperling RA, Dubois B (2016) A/T/N: An unbiased descriptive classification scheme for Alzheimer disease biomarkers. Neurology 87(5):539–547. doi:10.1212/wnl.0000000000002923
- Jack CR Jr, Weigand SD, Shiung MM, Przybelski SA, O'Brien PC, Gunter JL, Knopman DS, Boeve BF, Smith GE, Petersen RC (2008) Atrophy rates accelerate in amnestic mild cognitive impairment. Neurology 70(19 Pt 2):1740–1752. doi:10.1212/01.wnl.0000281688.77598.35
- Jagust W (2013) Vulnerable neural systems and the borderland of brain aging and neurodegeneration. Neuron 77(2):219–234. doi:10.1016/j.neuron.2013.01.002
- Jessen F, Amariglio RE, Buckley RF, van der Flier WM, Han Y, Molinuevo JL, Rabin L, Rentz DM, Rodriguez-Gomez O, Saykin AJ, Sikkes SAM, Smart CM, Wolfsgruber S, Wagner M (2020) The characterisation of subjective cognitive decline. Lancet Neurol 19(3):271–278. doi:10.1016/s1474-4422(19)30368-0
- Jessen F, Amariglio RE, van Boxtel M, Breteler M, Ceccaldi M, Chételat G, Dubois B, Dufouil C, Ellis KA, van der Flier WM, Glodzik L, van Harten AC, de Leon MJ, McHugh P, Mielke MM, Molinuevo JL, Mosconi L, Osorio RS, Perrotin A, Petersen RC, Rabin LA, Rami L, Reisberg B, Rentz DM, Sachdev PS, de la Sayette V, Saykin AJ, Scheltens P, Shulman MB, Slavin MJ, Sperling RA, Stewart R, Uspenskaya O, Vellas B, Visser PJ, Wagner M (2014) A conceptual framework for research on subjective cognitive decline in preclinical Alzheimer's disease. Alzheimer's dementia: the journal of the Alzheimer's Association 10(6):844–852. doi:10.1016/j.jalz.2014.01.001
- Kong XZ, Liu Z, Huang L, Wang X, Yang Z, Zhou G, Zhen Z, Liu J (2015) Mapping Individual Brain Networks Using Statistical Similarity in Regional Morphology from MRI. PloS one 10(11):e0141840. doi:10.1371/journal.pone.0141840
- Kong XZ, Wang X, Huang L, Pu Y, Yang Z, Dang X, Zhen Z, Liu J (2014) Measuring individual morphological relationship of cortical regions. J Neurosci Methods 237:103–107. doi:10.1016/j.jneumeth.2014.09.003
- Latora V, Marchiori M (2001) Efficient behavior of small-world networks. Physical review letters 87(19):198701. doi:10.1103/PhysRevLett.87.198701
- Li C, Li Y, Zheng L, Zhu X, Shao B, Fan G, Liu T, Wang J (2019) Abnormal Brain Network Connectivity in a Triple-Network Model of Alzheimer's Disease. Journal of Alzheimer's disease: JAD 69(1):237–252. doi:10.3233/jad-181097
- Li Q, Li X, Wang X, Li Y, Li K, Yu Y, Yin C, Li S, Han Y (2016) Topological Properties of Large-Scale Cortical Networks Based on Multiple Morphological Features in Amnestic Mild Cognitive Impairment. Neural plasticity 2016:3462309. doi:10.1155/2016/3462309
- Li W, Yang C, Wu S, Nie Y, Zhang X, Lu M, Chu T, Shi F (2018) Alterations of Graphic Properties and Related Cognitive Functioning Changes in Mild Alzheimer's Disease Revealed by Individual Morphological Brain Network. Front NeuroSci 12:927. doi:10.3389/fnins.2018.00927
- Lin L, Fu Z, Jin C, Tian M, Wu S (2018) Small-world indices via network efficiency for brain networks from diffusion MRI. Exp Brain Res 236(10):2677–2689. doi:10.1007/s00221-018-5326-z
- Lo CY, He Y, Lin CP (2011) Graph theoretical analysis of human brain structural networks. Rev Neurosci 22(5):551–563. doi:10.1515/rns.2011.039
- Lo CY, Wang PN, Chou KH, Wang J, He Y, Lin CP (2010) Diffusion tensor tractography reveals abnormal topological organization in structural cortical networks in Alzheimer's disease. The Journal of neuroscience: the official journal of the Society for Neuroscience 30(50):16876–16885. doi:10.1523/jneurosci.4136-10.2010
- López-Sanz D, Bruña R, Garcés P, Martín-Buro MC, Walter S, Delgado ML, Montenegro M, López Higes R, Marcos A, Maestú F (2017a) Functional Connectivity Disruption in Subjective Cognitive Decline and Mild Cognitive Impairment: A Common Pattern of Alterations. Front Aging Neurosci 9:109. doi:10.3389/fnagi.2017.00109
- López-Sanz D, Garcés P, Álvarez B, Delgado-Losada ML, López-Higes R, Maestú F (2017b) Network Disruption in the Preclinical Stages of Alzheimer's Disease: From Subjective Cognitive Decline to Mild Cognitive Impairment. Int J Neural Syst 27(8):1750041. doi:10.1142/s0129065717500411
- Lu J, Li D, Li F, Zhou A, Wang F, Zuo X, Jia XF, Song H, Jia J (2011) Montreal cognitive assessment in detecting cognitive impairment in Chinese elderly individuals: a population-based study. J Geriatr Psychiatr Neurol 24(4):184–190. doi:10.1177/0891988711422528
- McKenna F, Koo BB, Killiany R (2016) Comparison of ApoE-related brain connectivity differences in early MCI and normal aging populations: an fMRI study. Brain imaging behavior 10(4):970–983. doi:10.1007/s11682-015-9451-z
- Mesulam MM (1998) From sensation to cognition. Brain: a journal of neurology 121 (Pt 6):1013–1052. doi:10.1093/brain/121.6.1013
- Montembeault M, Rouleau I, Provost JS, Brambati SM (2016) Altered Gray Matter Structural Covariance Networks in Early Stages of Alzheimer's Disease. Cerebral cortex (New York, NY: 1991) 26 (6):2650–2662. doi:10.1093/cercor/bhv105
- Morris JC (1993) The Clinical Dementia Rating (CDR): current version and scoring rules. Neurology 43(11):2412–2414. doi:10.1212/wnl.43.11.2412-a
- Peter J, Scheef L, Abdulkadir A, Boecker H, Heneka M, Wagner M, Koppara A, Klöppel S, Jessen F (2014) Gray matter atrophy pattern in elderly with subjective memory impairment. Alzheimer's dementia: the journal of the Alzheimer's Association 10(1):99–108. doi:10.1016/j.jalz.2013.05.1764
- Pichet Binette A, Gonneaud J, Vogel JW, La Joie R, Rosa-Neto P, Collins DL, Poirier J, Breitner JCS, Villeneuve S, Vachon-Presseau E (2020) Morphometric network differences in ageing versus Alzheimer's disease dementia. Brain 143(2):635–649. doi:10.1093/brain/awz414
- Rabin LA, Smart CM, Amariglio RE (2017) Subjective Cognitive Decline in Preclinical Alzheimer's Disease. Ann Rev Clin Psychol 13:369–396. doi:10.1146/annurev-clinpsy-032816-045136
- Riedel BC, Thompson PM, Brinton RD (2016) Age, APOE and sex: Triad of risk of Alzheimer's disease. J Steroid Biochem Mol Biol 160:134–147. doi:10.1016/j.jsbmb.2016.03.012
- Rönnlund M, Sundström A, Adolfsson R, Nilsson LG (2015) Subjective memory impairment in older adults predicts future dementia independent of baseline memory performance: Evidence from the Betula prospective cohort study. Alzheimer's dementia: the journal of the Alzheimer's Association 11(11):1385–1392. doi:10.1016/j.jalz.2014.11.006
- Rubinov M, Sporns O (2010) Complex network measures of brain connectivity: uses and interpretations. NeuroImage 52(3):1059–1069. doi:10.1016/j.neuroimage.2009.10.003
- Scheef L, Grothe MJ, Koppara A, Daamen M, Boecker H, Biersack H, Schild HH, Wagner M, Teipel S, Jessen F (2019) Subregional volume reduction of the cholinergic forebrain in subjective cognitive decline (SCD). NeuroImage Clinical 21:101612. doi:10.1016/j.nicl.2018.101612
- Shu N, Liang Y, Li H, Zhang J, Li X, Wang L, He Y, Wang Y, Zhang Z (2012) Disrupted topological organization in white matter structural networks in amnestic mild cognitive impairment: relationship to subtype. Radiology 265(2):518–527. doi:10.1148/radiol.12112361
- Shu N, Wang X, Bi Q, Zhao T, Han Y (2018) Disrupted Topologic Efficiency of White Matter Structural Connectome in Individuals with Subjective Cognitive Decline. Radiology 286(1):229–238. doi:10.1148/radiol.2017162696
- Simic G, Babic M, Borovecki F, Hof PR (2014) Early failure of the default-mode network and the pathogenesis of Alzheimer's disease. CNS Neurosci Ther 20(7):692–698. doi:10.1111/cns.12260
- Sivera R, Delingette H, Lorenzi M, Pennec X, Ayache N (2019) A model of brain morphological changes related to aging and Alzheimer's disease from cross-sectional assessments. NeuroImage 198:255–270. doi:10.1016/j.neuroimage.2019.05.040
- Sporns O (2013) Structure and function of complex brain networks. Dialog Clin Neurosci 15(3):247–262. doi:10.31887/DCNS.2013.15.3/osporns
- Sridharan D, Levitin DJ, Menon V (2008) A critical role for the right fronto-insular cortex in switching between central-executive and default-mode networks. Proc Natl Acad Sci USA 105(34):12569–12574. doi:10.1073/pnas.0800005105
- Supekar K, Musen M, Menon V (2009) Development of large-scale functional brain networks in children. PLoS Biol 7(7):e1000157. doi:10.1371/journal.pbio.1000157
- Tijms BM, Seriès P, Willshaw DJ, Lawrie SM (2012) Similarity-based extraction of individual networks from gray matter MRI scans. Cerebral cortex (New York, NY: 1991) 22 (7):1530–1541. doi:10.1093/cercor/bhr221
- Tzourio-Mazoyer N, Landeau B, Papathanassiou D, Crivello F, Etard O, Delcroix N, Mazoyer B, Joliot M (2002) Automated anatomical labeling of activations in SPM using a macroscopic anatomical parcellation of the MNI MRI single-subject brain. NeuroImage 15(1):273–289. doi:10.1006/nimg.2001.0978
- van den Heuvel MP, Sporns O (2011) Rich-club organization of the human connectome. The Journal of neuroscience: the official journal of the Society for Neuroscience 31(44):15775–15786. doi:10.1523/jneurosci.3539-11.2011
- Verfaillie SCJ, Slot RER, Dicks E, Prins ND, Overbeek JM, Teunissen CE, Scheltens P, Barkhof F, van der Flier WM, Tijms BM (2018) A more randomly organized grey matter network is associated with deteriorating language and global cognition in individuals with subjective cognitive decline. Hum Brain Mapp 39(8):3143–3151. doi:10.1002/hbm.24065
- Viviano RP, Damoiseaux JS (2020) Functional neuroimaging in subjective cognitive decline: current status and a research path forward. Alzheimer's research therapy 12(1):23. doi:10.1186/s13195-020-00591-9
- Viviano RP, Hayes JM, Pruitt PJ, Fernandez ZJ, van Rooden S, van der Grond J, Rombouts S, Damoiseaux JS (2019) Aberrant memory system connectivity and working memory performance in subjective cognitive decline. NeuroImage 185:556–564. doi:10.1016/j.neuroimage.2018.10.015
- Wang J, Wang X, Xia M, Liao X, Evans A, He Y (2015) GRETNA: a graph theoretical network analysis toolbox for imaging connectomics. Front Hum Neurosci 9:386. doi:10.3389/fnhum.2015.00386
- Wang J, Zuo X, Dai Z, Xia M, Zhao Z, Zhao X, Jia J, Han Y, He Y (2013) Disrupted functional brain connectome in individuals at risk for Alzheimer's disease. Biol Psychiatry 73(5):472–481. doi:10.1016/j.biopsych.2012.03.026
- Watts DJ, Strogatz SH (1998) Collective dynamics of 'small-world' networks. Nature 393(6684):440–442. doi:10.1038/30918
- Wu K, Taki Y, Sato K, Kinomura S, Goto R, Okada K, Kawashima R, He Y, Evans AC, Fukuda H (2012) Age-related changes in topological organization of structural brain networks in healthy individuals. Hum Brain Mapp 33(3):552–568. doi:10.1002/hbm.21232
- Xia M, Wang J, He Y (2013) BrainNet Viewer: a network visualization tool for human brain connectomics. PloS one 8(7):e68910. doi:10.1371/journal.pone.0068910
- Yan T, Wang W, Yang L, Chen K, Chen R, Han Y (2018) Rich club disturbances of the human connectome from subjective cognitive decline to Alzheimer's disease. Theranostics 8(12):3237–3255. doi:10.7150/thno.23772
- Yao Z, Zhang Y, Lin L, Zhou Y, Xu C, Jiang T (2010) Abnormal cortical networks in mild cognitive impairment and Alzheimer's disease. PLoS Comput Biol 6(11):e1001006. doi:10.1371/journal.pcbi.1001006
- Yin RH, Tan L, Liu Y, Wang WY, Wang HF, Jiang T, Radua J, Zhang Y, Gao J, Canu E, Migliaccio R, Filippi M, Gorno-Tempini ML, Yu JT (2015) Multimodal Voxel-Based Meta-Analysis of White Matter Abnormalities in Alzheimer's Disease. Journal of Alzheimer's disease: JAD 47(2):495–507. doi:10.3233/jad-150139
- Zalesky A, Fornito A, Bullmore ET (2010) Network-based statistic: identifying differences in brain networks. NeuroImage 53(4):1197–1207. doi:10.1016/j.neuroimage.2010.06.041
- Zhao T, Sheng C, Bi Q, Niu W, Shu N, Han Y (2017) Age-related differences in the topological efficiency of the brain structural connectome in amnestic mild cognitive impairment. Neurobiol Aging 59:144–155. doi:10.1016/j.neurobiolaging.2017.08.005
- Zhao W, Wang X, Yin C, He M, Li S, Han Y (2019) Trajectories of the Hippocampal Subfields Atrophy in the Alzheimer's Disease: A Structural Imaging Study. Frontiers in neuroinformatics 13:13. doi:10.3389/fninf.2019.00013
- Zhou Y, Yu F, Duong TQ (2015) White matter lesion load is associated with resting state functional MRI activity and amyloid PET but not FDG in mild cognitive impairment and early Alzheimer's disease patients. Journal of magnetic resonance imaging: JMRI 41(1):102–109. doi:10.1002/jmri.24550
- S1.png
Fig.S1 Between-group differences in global network metrics as a function of sparsity for the cortical networks. The arrows point from the representation of the network parameters to the results of the between-group differences. One asterisk means p<0.05, two asterisk means p<0.01, three asterisk means p<0.001.