Source of microorganisms
F. solani and C. aquatica were used as a source for nanoparticles synthesis. Both organisms were previously isolated and identified by Qurbani and Hamzah (16). For the antibacterial experiment, E. faecalis was selected as a model. E. faecalis is a clinical bacterium isolated from a urine sample in Sulaymaniyah Teaching Hospital. E. faecalis was identified via VITEK2 (BioMerieux, USA) instrument using a Gram-positive VITEK2 ID card.
Preparation and optimization of bio-AgNPs
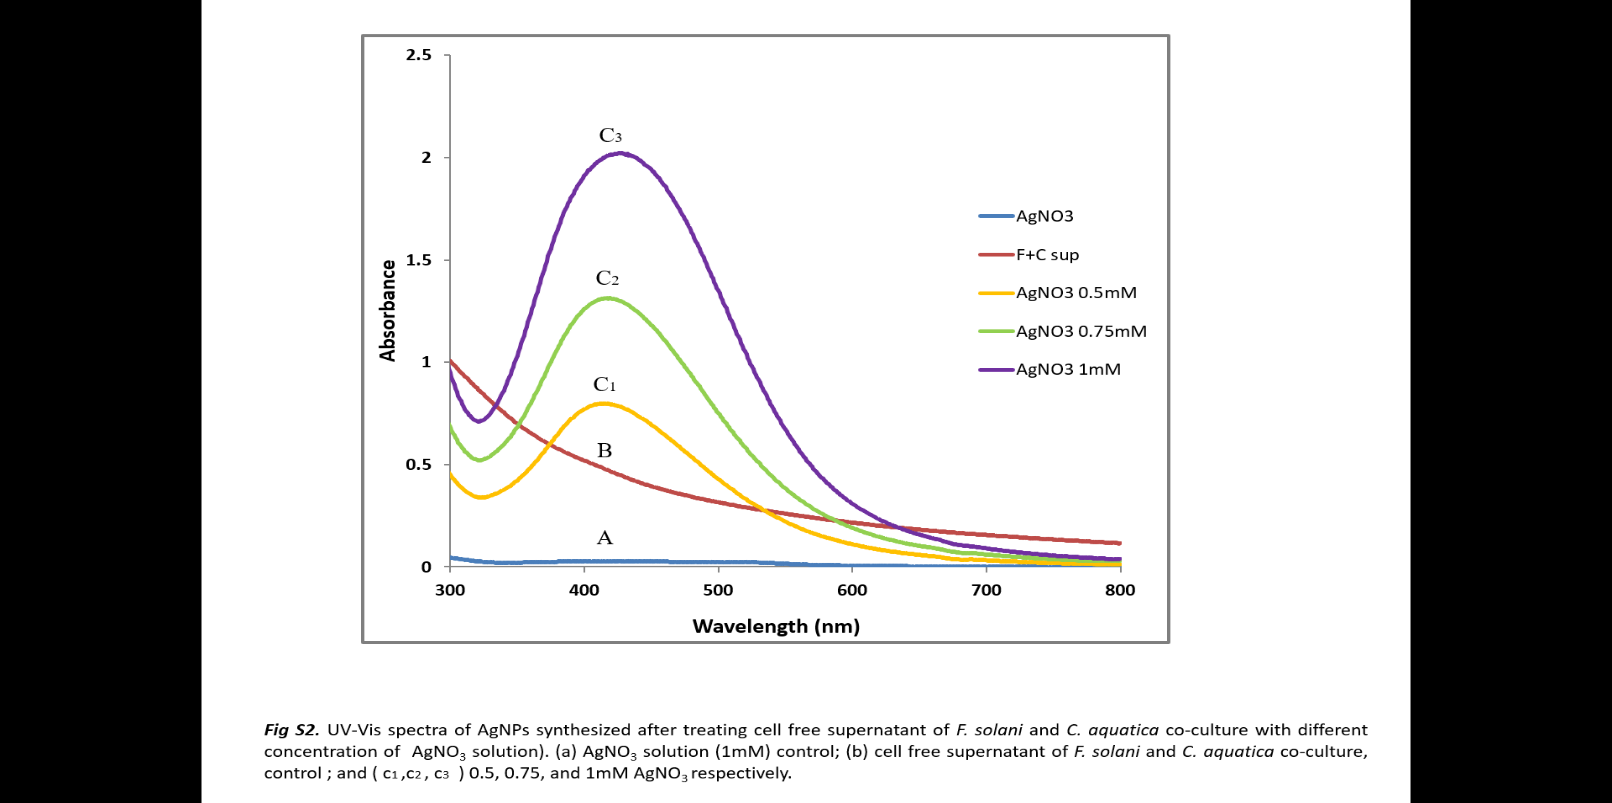
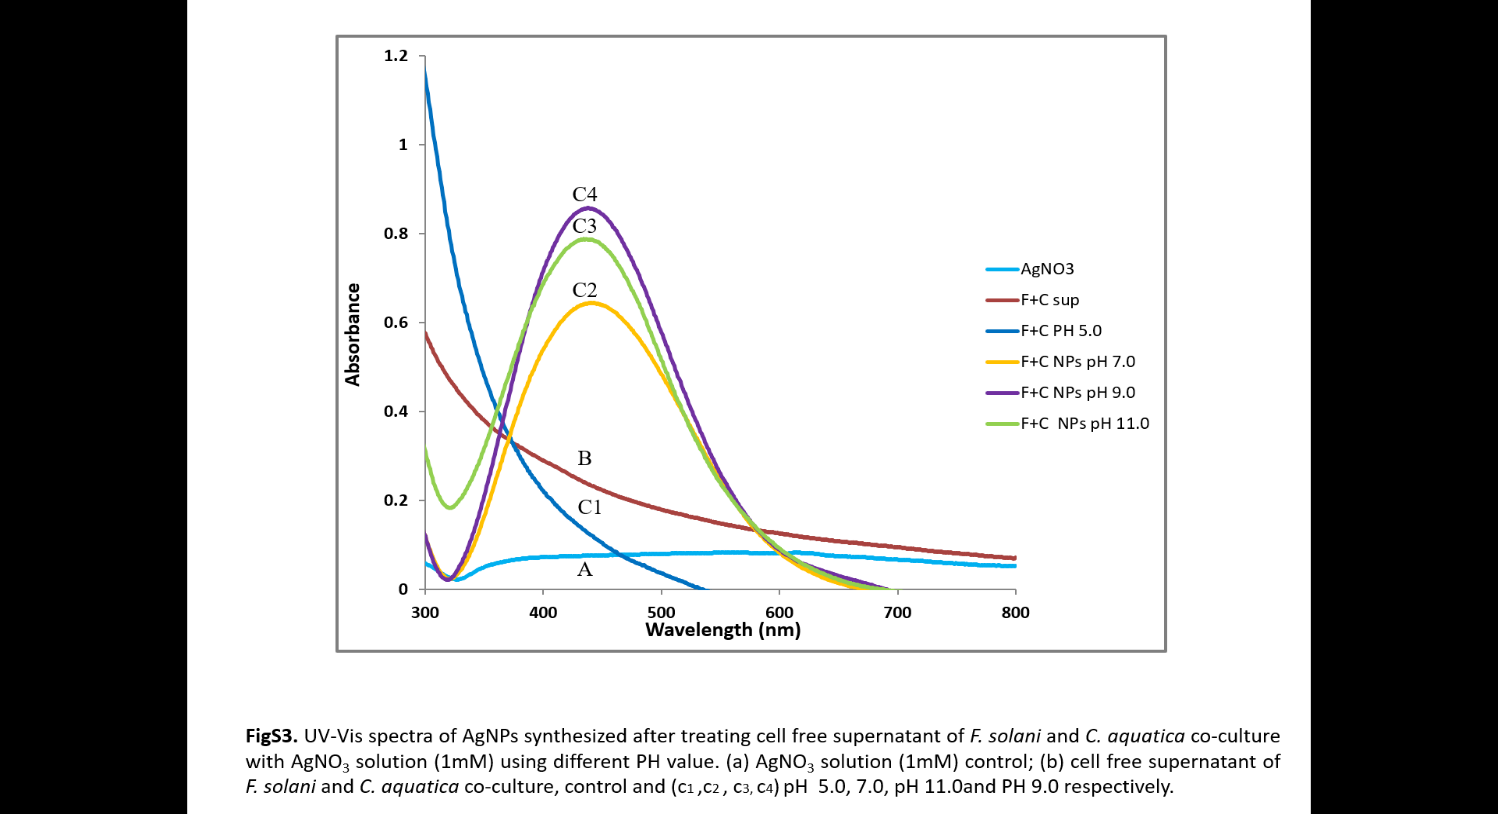
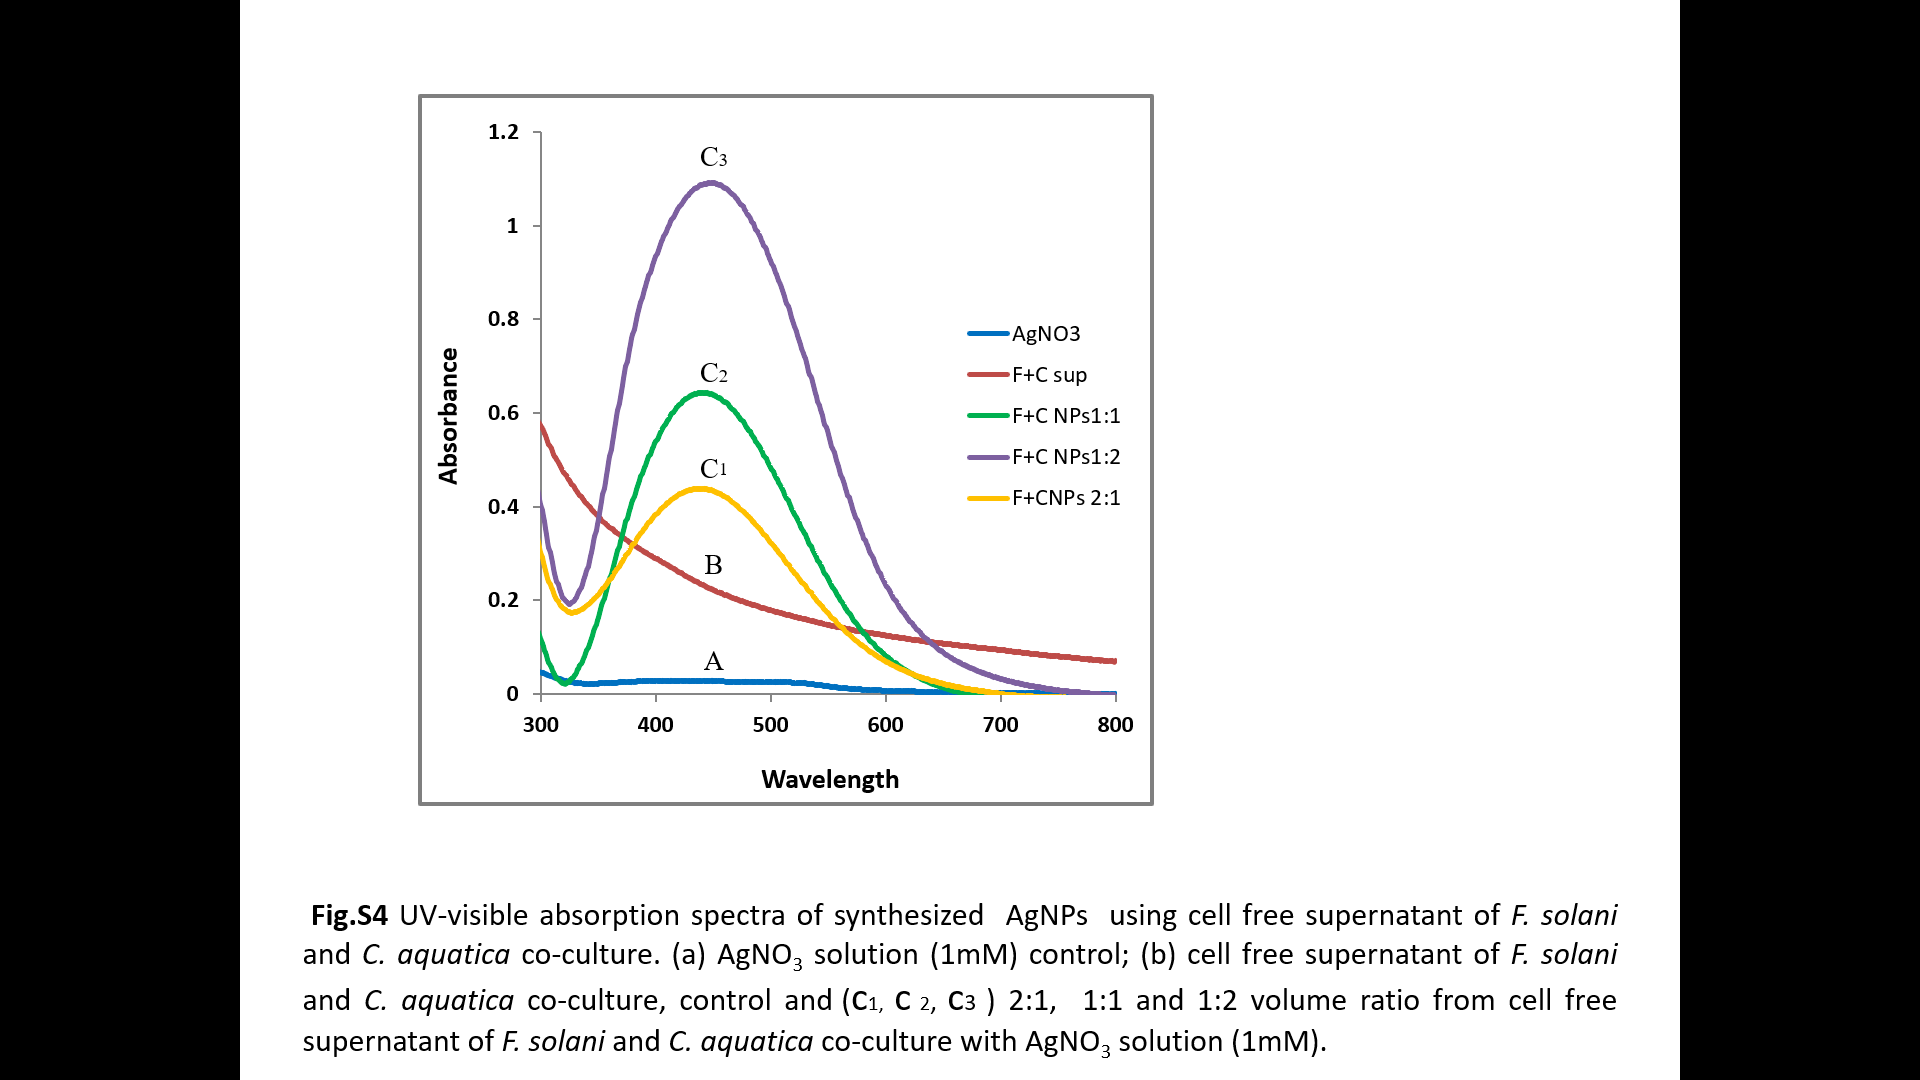
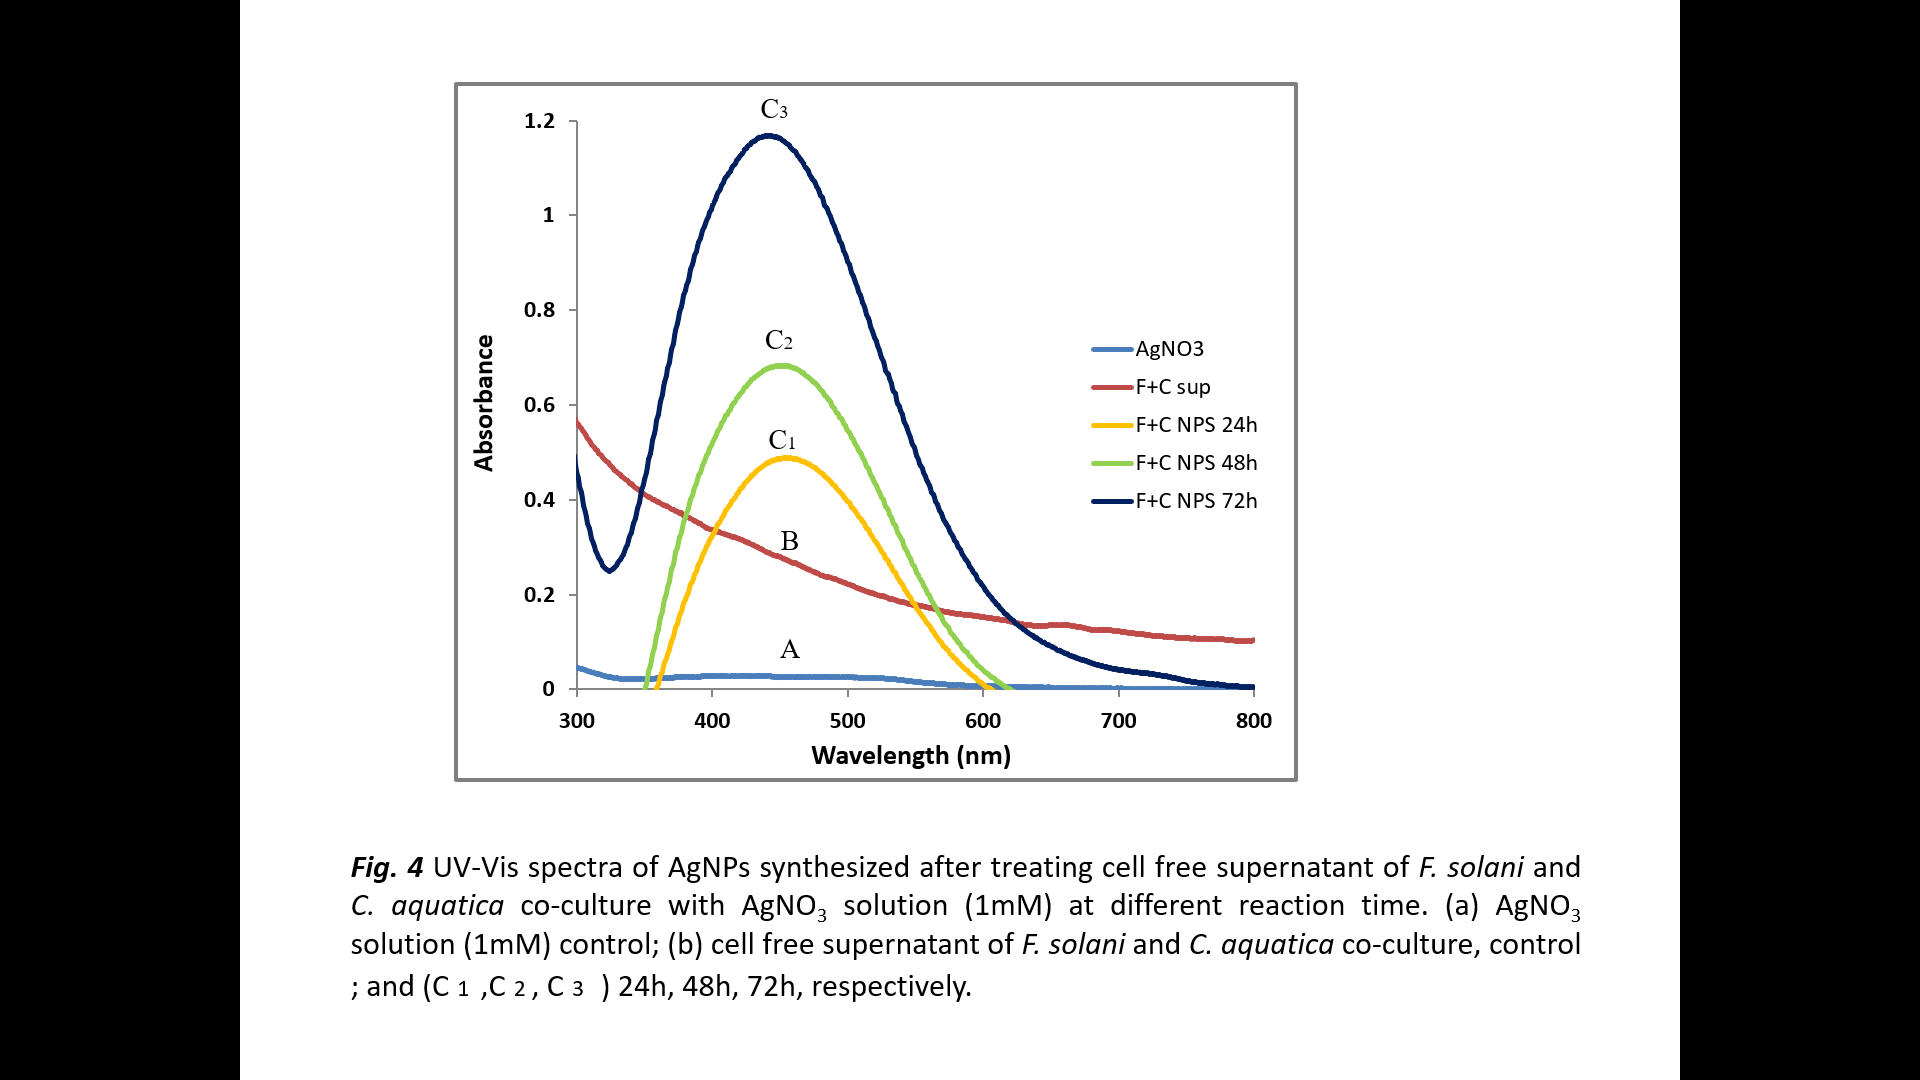
Fresh cultures of F. solani and C. aquatica were grown separately in 250 ml Erlenmeyer flasks containing 100 ml of nutrient broth. The flasks were incubated at 30 °C for 48 (for the bacterium) and 72 h (for the fungus). C-FS from the culture flasks were collected by centrifugation (Biofuge Stratos, Germany) at 5,000 × g for 20 min at 4 °C. For AgNPs fabrication, an equal amount of C-FS of both organisms were mixed with 1 mM of filter-sterilized AgNO3 solution (Sigma, USA, purity 99.9%) as a final concentration. The flask was kept for 72 h at room temperature under static conditions. AgNPs were collected at 14,000 × g for 20 min at 4 °C (Mikro 200R, UK) and were washed three times with sterile distilled water. The obtained precipitate was kept in a Petri dish and left in the oven for drying at 40 °C for 24 h (WT`C Binder, Germany). The dried AgNPs were scraped out and obtained in powder form for further study (17). The effects of four variables on the product yield of AgNPs were optimized by varying one parameter at a time, including AgNO3 concentration (0.5, 0.75 and 1.0 mM), pH values (5.0, 7.0, 9.0, and 11.0), reduction time (24, 48, and 72 h) and volume ratio (1:1, 1:2, 2:1 v/v C-FS:AgNO3). All experiments were carried out in triplicates.
Characterization of bio-AgNPs
The bio-reduction of Ag+ ions was monitored with UV-vis spectrum and was recorded with UV-vis spectrophotometer (Kary60, USA) at a resolution of 2 nm within a range of A300 to A800 nm. FTIR analysis was carried out in the range of 400–4,000 cm−1 at a resolution of 4 cm−1 (PerkinElmer 1600, USA). Crystal structure and size of the AgNPs were investigated by X-ray diffraction using an X 'Pert Pro diffractometer (Pan Analytical, Netherlands) equipped with Cu-K-α radiation (1.5406 Å), at the fixed operating voltage and current of 45 kV and 40 mA, respectively. The shape and size of the AgNPs were further determined by TEM (PHILIPS model CM120, Netherlands).
Antibacterial activity of bio-AgNPs
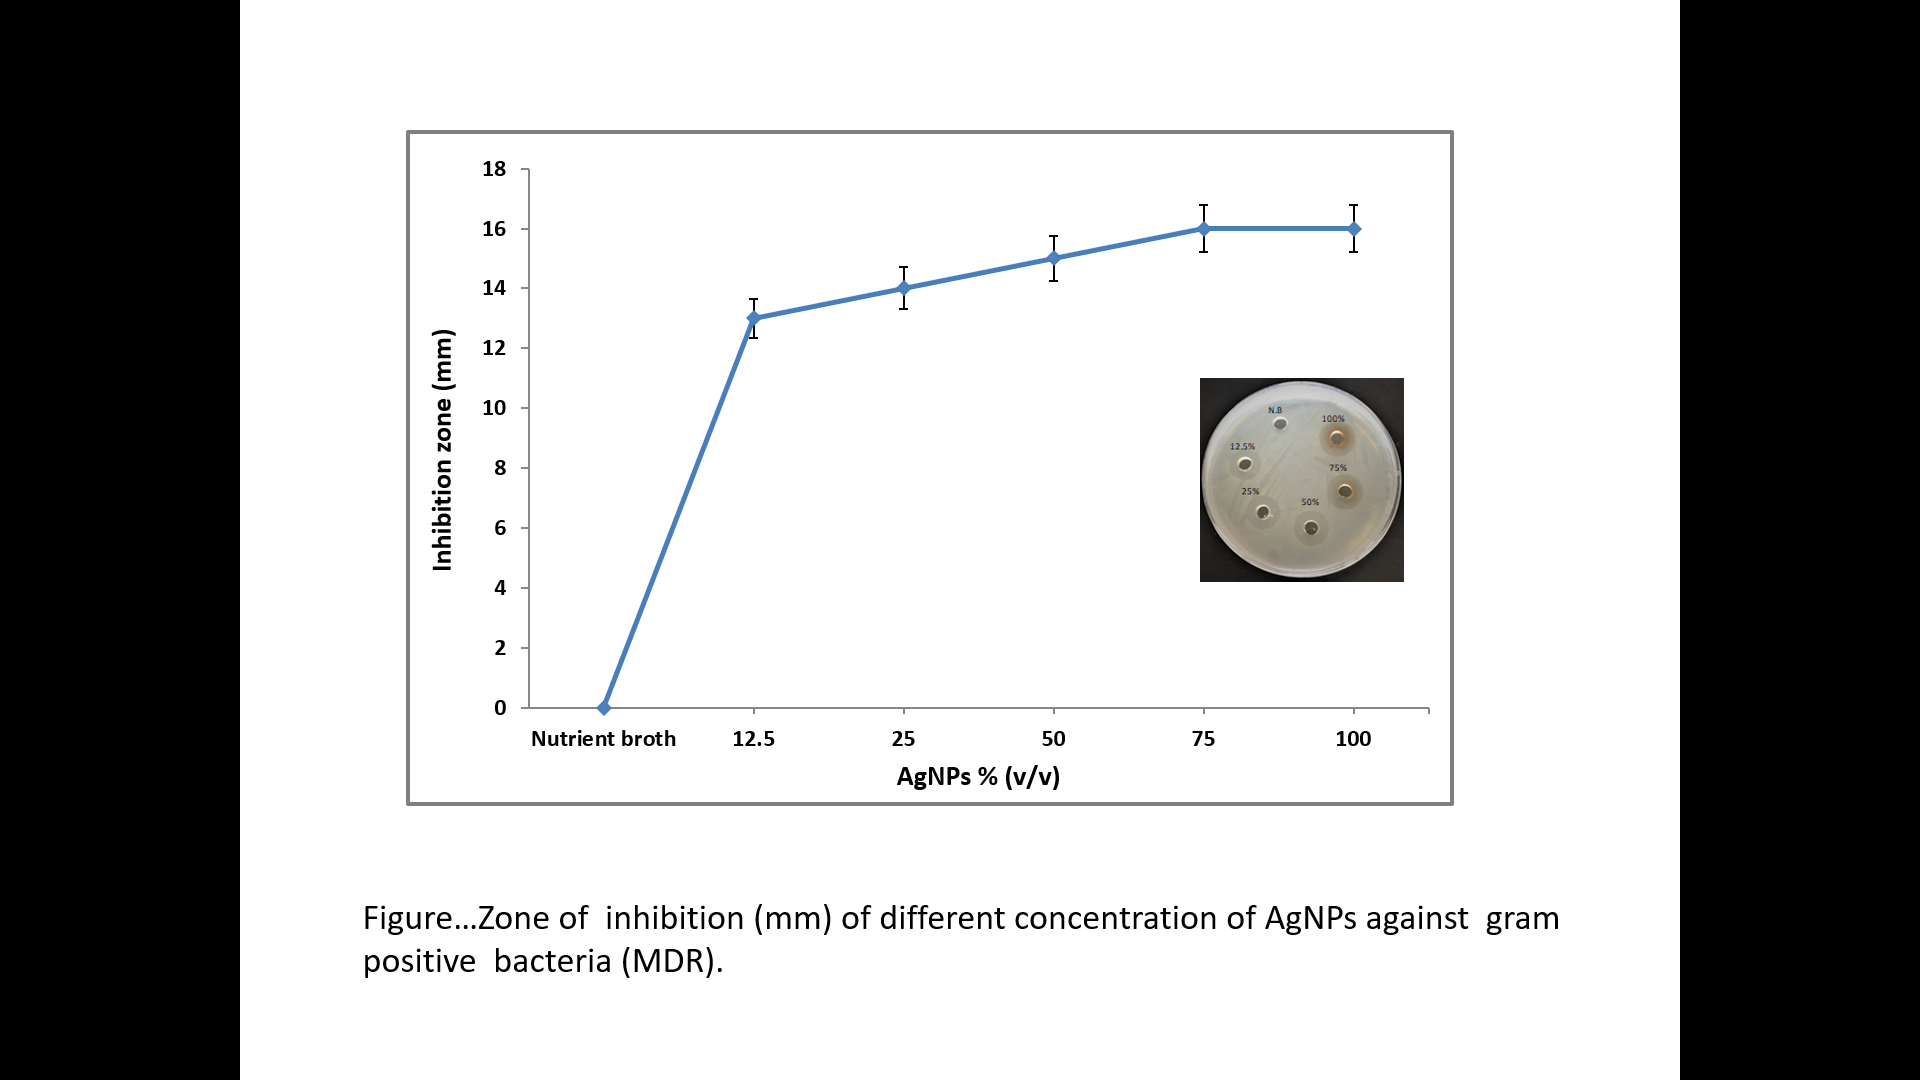
For the agar well diffusion assay, E. faecalis was grown overnight in Luria-Bertani broth (LB) at 37 °C (18). CFU/ml was adjusted to be 108. Then, 100 µl culture broth was spread evenly on Müeller-Hinton agar plates. Wells were made using gel puncture, and 100 µl of different concentrations of AgNPs (12.5, 25, 50, 75, and 100 µg/ml) were loaded into certain wells. Afterward, the plates were incubated at 37 °C for 24 h, then the zone of inhibition was measured (mm).
Minimum inhibitory concentration (MIC) and antibiofilm activities of AgNPs were conducted according to (19) with a few modifications. Briefly, 120 µl of bacterial culture (108 CFU/ml) were placed in a 96-well microtiter plate. Then, 80 µl of different concentrations of AgNPs (3, 6, 9, 12.5, 25, 50, 75, and 100 µg/ml) was added. LB broth (200 µl) was used as a negative control. The plate was then incubated for 24 h at 37 °C under gentle shaking in microplate incubator-shaker PST60 HL Plus (BOECO, Germany). The absorbance of each well was measured at 600 nm using a microtiter ELISA reader (Biotech μQuant, USA). Growth percentage was calculated based on the average and standard deviation of triplicate results. Besides, 5 µl was taken from each well and spotted onto LB agar plates. Simultaneously, 5 µl was also spotted on Congo Red Agar (CRA) plates (for the biofilm experiment). The plates were then incubated at 37 °C for 18 h.
Regarding the antibiofilm activity of AgNPs, the contents in the microtiter plate wells were discarded and washed three times with 200 µl phosphate buffer saline (PBS, pH 7.2). After drying, the remained well-attached cells were stained with crystal violet (0.1%) for 30 min. The wells were then washed 3 times with distilled water after removing the excess stain. The plate was then allowed to dry at room temperature after which 200 µl ethanol (95%) was added to the wells to solubilize the stain. Then, the wells were read at 595 nm using a microplate reader (Biotech µQuant, USA). Optical density (OD) readings were then converted to percent of inhibition (%). This experiment was performed 3 times to compare and analyze the average of each result.
Protein leakage and detection of blaTEM and blaCTX-M genes in E. faecalis
Protein leakage from E. faecalis cells was determined by the A280 assay (20) using NanoDrop 2000 (ThermoFisher, USA). Briefly, bacterial suspension with an OD of about 0.2 at 600 nm (~108 CFU/ml) was prepared in LB and treated with 9 µg/ml AgNPs. After overnight at 37 °C, samples were centrifuged at 14,000 × g for 5 min at 4 °C using Mikro 200R centrifuge (Hettich, UK). Afterward, the collected supernatants were subjected to protein quantification. On the other hand, total genomic DNA from untreated and treated cells was extracted using Presto™ Mini gDNA Bacteria Kit (Geneaid, Italy) following the manufacture’s guidelines. PCR was performed via ThermoCycler T100TM (Bio-Rad, Singapore). The sequences of the selected primers are shown in Table 1 (20); the primers were designed to amplify partial sequences of blaTEM and blaCTX-M genes in Gram-negative Klebsiella pneumoniae. PCR reaction mixture setup contained 10 µl master mix, 1 µl of forward and reverse primers each, 1 µl of DNA, and 7 µl of distilled water giving a total of 20 µl. The PCR protocol for 30 cycles was as follows: initial denaturation at 94 °C for 2 min, then 94 °C for 30 s, 55 °C for 30 s, 68 °C for another 30 s, followed by a final extension at 68 °C for 7 min. The PCR products were analyzed by electrophoresis using 1% agarose gel in TAE buffer at 90 V for about 40 min, stained with ethidium bromide, and the image was captured via MultiDoc-It™ Imaging System (UVP, USA).
Table 1. Primer sequences for detection of blaCTX-M and blaTEM
*In the following primers, F denotes forward and R denotes reverse.
Statistical Analysis
P-values were obtained (Unpaired t-test) by using GraphPad Prism 8.0.1 software Inc, CA, USA. Statistical significance was defined when the P-value was less than 0.05.