In current decade, curcumin and its analogues have been broadly used in biological field. However, there are relatively fewer studies regarding their fluorescence based applications for chromium ion sensing in water samples. This article, hereby, reports the synthesis, FTIR and 1H-NMR spectroscopic analyses and optical description of 2,6-bis(E)-4-methylbenzylidine)-cyclohexan-1-one (sensor C), as a fluorescence-on sensor for trace level sensing of chromium. The sensor C exhibited an ultra-selective response to chromium among the tested heavy metal ions. Different parameters were optimized like pH, effect of concentration of sensor C, metal ion and contact time. The binding stoichiometry of C :Cr3+ was calculated to be 2:1 (Job’s plot) with a significantly low detection limit of 2.3×10− 9 M. Sensor C were practically employed for detection of chromium in spiked water samples.
Research Article
2,6-Bis(E)-4-Methylbenzylidine)-Cyclohexan-1-One As A Fluorescent-On Sensor For Ultra-Selective Detection Of Chromium Ion In Aqueous Media
https://doi.org/10.21203/rs.3.rs-560875/v1
This work is licensed under a CC BY 4.0 License
Version 1
posted
You are reading this latest preprint version
Chromium is considered one of the major toxicant due to its high solubility and mobility in water. Most of the pollutants in environment are degraded gradually by living organisms into simpler harmless substances; but some pollutants including heavy metal ions like chromium are non-degradable [1, 2]. Chromium is mainly added to water bodies either from natural sources; like volcanic eruption, rock weathering or man-made activities; including mining operations, metal extraction, production of alloys, steel industries, and pigment producing factories, improper waste disposal, electroplating, synthetic fertilizers and other fields. In environment chromium readily gets dissolved in water and is persistent for longer period of time within the bodies of organisms [3, 4], causing a number of disorders in organisms like tumors, gastrointestinal infections, ulceration, dermal irritation, lung cancer and anemia.
Several analytical methods such as absorption spectrometry [5], plasma mass spectroscopy [6], chemical reduction [7], adsorption [8], electrocoagulation [9], chemical precipitation [10], flotation [11], ion exchange [12], electrochemical [13] and amperometric analysis [14] have been applied for detection of chromium ions, but due to their time-consuming nature, complex operation, expensive instrumentations, sludge production, requirement of large amount of chemicals, and consequent risk of secondary pollutants, these techniques are not preferred for the trace detection of chromium. In the last few years, the development of optical sensors capable of sensing heavy metal ions is greatly demanded.
Among the metal ion sensors, fluorescence sensors have gained attention, since they contribute high sensitivity, lower cost, able to respond quickly, easily availability, excellent photo-physical properties, wide use, subsequent impact on the environment and nature, the easy operability, possibility of real time monitoring [15] and technological simplicity. The process of fluorescence based sensing is that upon light emission by fluorophore as soon as excited [16].
A number of fluorescent sensors have already been reported and were efficient employed for selective metal ion recognition and studies of these fluorescent probes yielded promising results in terms of specificity [17, 18].
The design and synthesis of fluorescence based receptors for their applications for chromium ion detection in environmental samples is still demanding research topic, as the determination of chromium by spectrofluorimetry is rarely studied [19].
Curcumin has very exciting photo physical and fluorescence properties. Apart from their application in biological field, the chemically synthesized pi-extended derivatives of curcumin analogues, possessing variety of chemical sites can be used as a potential sensor for metal ion determination. In current study, we report the development of curcumin derivative as a potential fluorochrome possessing efficient optical properties and binding capability. Due to the presence of electron donor atoms in the chemical structure of curcumin, it can easily form stable complex with cations [20].
Required Materials
All the chemicals and reagents used in the current study were used as received. Cyclohexanone (Merck) 4-methylbenzaldehyde (Sigma Aldrich), sodium hydroxide (Alfa Aesar), methanol (Sigma Aldrich), Acetonitrile (Merck). Quartz cuvette was used for fluorometric chromium ion determination. All salts, in the form of sulphate, hydroxide and chloride form including Cd(SO4)2·4H2O, Ca(OH3)2·4H2O, Co(OH3)·6H2O, Zn(SO4)2·6H2O, Cu(SO4)2·3H2O), Mn(OH3)2·4H2O, and Ni(SO4)3·6H2O, CrCl3.6H2O were purchased from BDH chemical England.
Instrumentation
Fluorescence analyses were performed with spectrofluorophotometermeter RF-5301PC (Shimadzu, Japan). Ultraviolet-Visible spectroscopic analysis was accomplished with double-beam UV-Visible spectrophotometer (Shimadzu, Japan) model 1601. For 1H-NMR and IR spectra characterization Bruker Advance 400 MHz spectrometer and FTIR spectrophotometer Pretige 21 (Shimadzu, Japan) was used respectively.
Solutions preparation for Spectroscopic measurements
Stock solution of sensor C in acetonitrile, and metal ions solutions using respective salts of nickel, cadmium, lead, cerium, copper, mercury, zinc, and manganese and chromium were prepared in distilled water. Working solutions were prepared from stock solution by appropriate dilution.
Sensor C synthesis and characterization
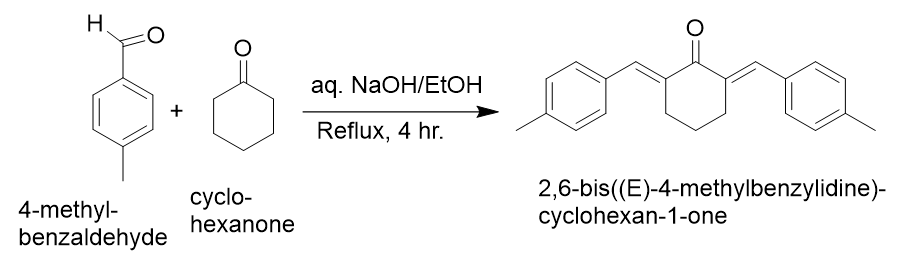
The sensor C [2,6-bis(E)-4-methylbenzylidine)-cyclohexan-1-one] was synthesized with slight modification of already existing method in literature [21] by reacting aldehyde and ketone in specific ration i.e. 2: 1. To a 12 mmol4-methyl benzaldehyde (0.26 g in 12 mL ethanol) was added 6 mmol of cyclohexanone with continuous addition of sodium hydroxide (40 %). The resulted mixture was refluxed for 4 hours and the progress of reaction was observed using TLC. The product formed was processed in ice to get the final products. Yellow colored pure crystals formed having melting point of 159°C(yield 78 %) and is given in (scheme 1). 1H NMR: δ 7.78 (s, 2H,=CH), 7.46 (d, 4H, ArH), 6.94 (d, 4H, ArH ), 3.86 (s, 6H, 2CH3), 2.92 (dd, 4H,J = 14.6, 2.7 Hz), 1.82 (m, 2H, CH2) (Fig. S1) [22]. The IR (KBr) spectrum (ν cm− 1): 1626–1642 (C = C Ar), 3000 − 2930 (C-H asymmetric), 1710 (C = O) 3030, (C-H Ar) (Fig. S2) [23].
Spectroscopic studies
For exploring optical properties and sensing capability of sensor C for chromium detection UV-Vis and fluorescence spectrometry were used. The fluorescence and absorption spectra were taken in acetonitrile due to its freely solubility in it. In all of the spectroscopic experiments distilled water was used for metal solution and their spectra were recorded accordingly. For Uv/vis analysis, test solutions containing a fixed amount (8 µM) of sensor C while chromium (2–12 µM) concentration range were mixed and recorded. The fluorescence response of sensor C was monitored before and after mixing with different metal ions in distilled water. The mixtures were equilibrated at room temperature before measuring the fluorescence response. In addition, the practical applicability of sensor C for chromium ion determination in the vicinity of co-existing of similar metal cations in aqueous media was also investigated.
Quantum yield calculation
Rhodamine 6G dye was used as a standard possessing quantum yield (φ) 95 % for enumerating quantum yield of the sensor C. For doing the experiment, Rhodamine 6G solution was prepared and its spectroscopic analysis (UV-Visible absorption and fluorescence) were performed. The quantum yield was determined with the help of the given formula

Where “C” and “R” represent sensor C and dye respectively. “I” represent the integrated fluorescence intensity, “η” correspond to refractive index of solvent and “A” correspond to absorbance.
Analytical sensitivity
Stern Volmer plot analysis were performed for detection limit (𝛿) and quantification limit (β) determination using Eqs. 2 and 3 respectively


Where represent the standard deviation, and S being the slope of fluorescence response versus concentration curve. The respective experiment was performed seven times to examine the replicability of the system.
Computation of binding constant
To calculate approximately the binding constant of sensor C (Benesi-Hilderbrand plot) was drawn between fluorescence intensity and reciprocal of chromium concentration. The binding constant was attained using the given Eq. 4.

Spiking of natural water samples
Fluorescence spectroscopy was used for detecting the ability of the sensor C towards the ion of interest, Chromium, in real water samples. Therefore, the selected water samples (river water, Tap water) were used for spiking of different concentration of chromium (2–12) µM in the presence of (8µM) sensor C and the fluorescence response was measured at specific wavelengths of excitation and emission. For verification of the test results, all analysis were four times repeated.
Ultraviolet-Visible study
For the evaluation of the photophysical properties of sensor C and its chromium complex UV-Visible analysis was initially used. For considerable solubility and prospective applicability of sensor C, acetonitrile was selected as a solvent for sensor C in the current study. Ultraviolet-Visible spectrum of sensor C was taken in the presence and absence of different concentration of chromium ions. The Uv/vis spectrum for sensor C showed characteristic main absorption band (λmax) at360 nm .Upon addition of chromium solution bathochromic shift occurred and maximum absorption band appeared at 420nm,confirmingtheformation of chromium complex with sensor C (Fig. 1).Each time baseline was established by putting respective blanks in the reference slot.
Cation sensing studies using fluorescence spectroscopy
Fluorescence-on studies by Cr3+ ion
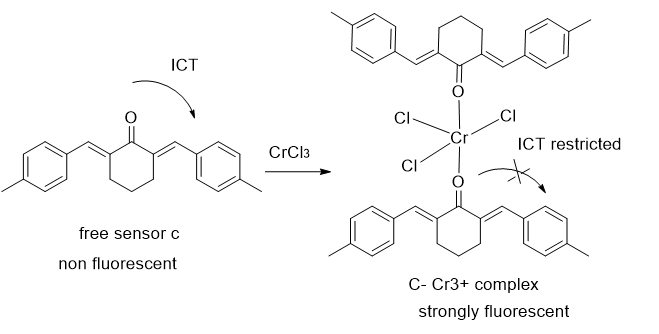
In our ongoing detection for a better understanding and a feasible intonation of the sensing ability of curcumin based fluorochrome, we have tagged curcumin based sensor with metal ion. In order to realize the photo physical properties of sensor C prior to metal ions recognition, the fluorescence response of free sensor C was taken. According to results obtained, sensor C displayed a very weak emission peak at 560 nm (λem). To investigate metal ion sensing by sensor C, different heavy metal ions Ni2+, Ce3+, Cu2+, Zn2+, Cd2+, Mn2+, Cr3+, Pb2+, Co2+(200 µM) were added to sensor C solution separately. The respective mixtures were allowed for 3 minutes to equilibrated, and were transferred into quartz cuvette separately by monitoring fluorescence intensity in the range of 400–700 nm. The spectra obtained for all the studied metal was compared with the spectrum of sensor C. Accidentally, in our case, a prominent enhancement in fluorescence emission intensity was observedatλem560 nm upon the addition of aqueous chromium ion (200 µM) to sensor C solution. While no apparent enhancement in intensity was spotted for the rest of metal ions (Fig. 2). So among the studied metal ions only chromium form complex with sensor C. This specific fluorescence-on response could be accredited to restriction of ICT phenomena. In the absence of chromium ions, due to ICT phenomena, a weak fluorescence was observed for sensor C. while in the presence of chromium ions ICT process is negligible and fluorescence intensity was extensively enhanced as the result of formation fa stable complex [24].
As discussed, we postulated that the apparent fluorescence enhancement of sensor C could be ascribed to a distinctive chemical resemblance for chromium ion. It is presented in already reported articles, fluorescent molecules like sensor C retain certain preference for chromium ion, thus allow a superficial prejudice from its close neighbor Fe3+ along with other similar co-existing ions through fluorescence enhancement [25].
pH study
In the interests of avoiding interference in chromium ion recognition by protons, we focused on pH analysis on the fluorescence retaliation. The pH value of the test system was set to acquired value by HCl and NaOH solution. The sensor C (8 µM) did not change its fluorescent intensity from pH = 1to 14, indicating its consistency. The weak fluorescent response of sensor C may be owing to intra-molecular photo-induced electron transfer. However, sensor C complex with (16µM) chromium showed strong fluorescence at pH 8, on account of its binding with Cr3+ leading to intra-molecular photo-induced electron transfer process inhibition. The chromium complex was unstable at lower pH thus displaying quenching in intensity as a result of protonation carbonyl oxygen that acts as binding site. By gradually increasing the pH, the fluorescence intensity strappingly enhanced (Fig. 3). At pH 8, high stability was displayed by the chromium complex and maximum enhancement in intensity was observed at λem 560 nm. While at pH > 8, a gradual decrease in intensity occurred due to formation of hydroxyl complexes that had poor solubility in water solution. From the results obtained, it can be assume that the synthesized sensor C can successfully be used for chromium ion determination at pH 8 in aqueous samples [26].
Sensor C concentration effect
The determination of concentration effect of sensor Con fluorescence response of the sensor C-Cr3+ complex is one of the important parameters in fluorimetric analyses. Working solution for analysis were prepared by keeping the chromium concentration constant (16µM), and varying the sensor C concentration in the range of 5–40 µM. The fluorescence emission intensity of each sample was monitored in 440–700 nm range (Fig. 4). With increasing concentration of sensor C, a linear enhancement in the emission intensity was observed. At higher concentration, the fluorescence intensity remains constant.
Quantitative study for Cr3+
For the confirmation of sensitivity of sensor C toward chromium ion, fluorescence titration experiments were carried out. During these titrations, the sensor C concentration was kept constant while changing the chromium ions concentration from 1–15 µM. A linear enhancement in the fluorescence intensity of chromium complex was noted at 560 nm (λem) upon increasing chromium concentration (Fig. 5). Thus showing that sensor C can be used for quantitative determination of Cr3+.
Binding mode study
The binding stoichiometry between sensor C and chromium was investigated using a Job’s plot, A Job’s plot between the different mole fraction of sensor C-Cr3+ complex versus respective emission intensities showed a maxima at 0.7 mole fraction indicating a 2:1 stoichiometric ration between sensor C and Cr3+ (Fig. 6).
This 2:1 binding ratio was further confirmed with the help of Benesi-Helderbrand plot. For this purpose, for determination of association constant the given equation was used

Where K (M− 2) represent association constant. Fo, Fmax and F denote the emission intensity of free sensor C, at [Cr3+] in excess concentration and at different [Cr3+] (λex = 425 nm and λem = 560 nm) respectively. The value of K was determined by plotting Fmax-Fº/F-Fº versus 1/[Cr3+]2, (Fig. 7). According to the Equation, data fitted linearly, showing good liner relationship with slope 6.515× 10− 11, and intercept 1.539. The association constant calculated from the slope is found to be 1.53 x 10¹⁰thus confirming the 2:1 binding ratio between sensor C and Cr3+.
The detecting mechanism of fluorescent sensor C forCr3+
The detecting mechanism of sensor C for Cr3+ionwas suggested using the fluorescence spectra. The fluorescent response of the sensor C towards Cr3+ionmay be allocated to intra molecular charge transfer (ICT). Before being coordinated with Cr3+ ions, sensor C displays a weak fluorescence emission spectrum due to lone electron pair of oxygen atom, which result in intra molecular charge transfer. Moreover, the lone electron pair of the oxygen atom give rise to a non-radiative process by the n-π* transition, as a result quenching in fluorescence intensity takes place. On the other hand, after sensor C was coordinated to Cr3+ion, radiation process was primarily viaπ-π*transitions and the coordination complex was more rigid thus the ICT process was restricted upon addition of Cr3+ionat the receptor site.
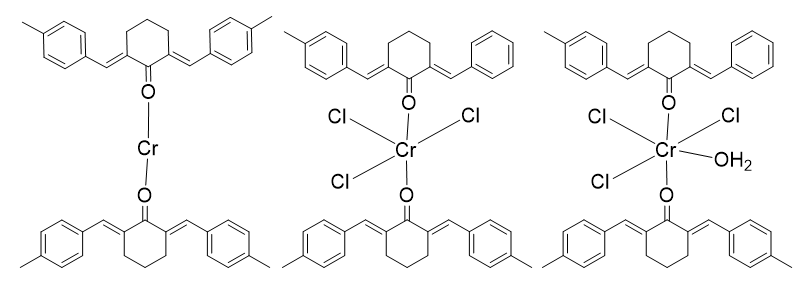
On the other hand, sensor C act as monodentate ligand as there is one potential coordination cite, the carbonyl oxygen. The coordination sphere of d-block elements like Cr is either 6 or 2 and complexes of chromium with both these coordination spheres have been reported [27–30]. Since the bulk of our sensor C is high so the bonding with chromium is expected to be strong and possible structures of sensor C-Cr3+ complex have been proposed in the (Scheme 2).
|
Parameter |
C:Cr3+ |
λem(nm) |
λex(nm) |
LOD (Cr3+) |
Quantum yield (%) |
|---|---|---|---|---|---|
|
Sensor C |
2: 1 |
560 |
425 |
2.3×10− 9 M |
72 |
Time study
Rapid response time is highly preferred in flurorimetric studies, therefore the time effect on emission response of sensor C and its complex with chromium was studied in time range of 0–7 min for different concentrations of chromium. During the assay, the fluorescence emission response of sensor C remained unaffected with increasing time, whereas the complex showed a linear response in fluorescence intensity with time and maximum fluorescence response was observed at 2 min and then remained constant (Fig. 8). These results indicate effectivity of sensor C for real time assay of chromium detection in environmental samples.
Effect of competitive metal cations
Competitive binding experiments were taken for evaluation of efficacy of the synthesized sensor C as a selective chromium ion sensor as sensor C should have the potential to detect chromium ions in the presence of co-existing metal cations. For this purpose, different commonly existing metal ions in water were selected like Cu2+,Hg2+,Zn2+,Cd2+,Pb2+,Mn2+,Co2+,Ni2+including the closely related ions likeCe3+. The concentration of each interfering metal ion was taken 8 folds (128µM) as compared to chromium metal ion (16 µM) while keeping the sensor C concentration constant (8 µM). The fluorescence emission profiling was completed between 440–700 nm with 425 nm λex.
No interference in fluorescence results in terms of intensity occurred even in the presence of high concentrations of interfering ions (Fig. 9). Thus, the obtained results may indisputably provide the reported sensor C is particularly valuable in efficiently selective chromium ion determination from its chemically similar cations like cerium and other commonly found interfering ions. Therefore, it can be realistically incidental that the synthesized sensor C exhibits an ultra-sensitive and highly selective fluorescence-on response toward chromium ion in aqueous samples.
Reversibility of sensor C
To determine whether the metal complex formation process is reversible or not, fluorescence emission titration experiment was performed using the sensor-Cr3+ complex with EDTA.
The reversibility of the designed fluorescence–based sensor is curricula for its economy and many times usage. In this regard, EDTA is added into sensor C combined with Cr3+ solution to confirm the effect of Cr3+ ions on the fluorescence response. When EDTA is added to the aqueous solution, the fluorescence spectrum is returned to its original state. The interaction between sensor C and Cr3+ ions is prevented by the formation of Cr3+–EDTA chelate. After the addition of EDTA, the fluorescence of sensor C is recovered. The fluorescence-on sensor C is proved to be reversible using turn off–on mechanism based on the fluorescence emission intensity measurement (Fig. 10). The experiments were repeated 4 times by getting the same results. Furthermore, since the fluorescence emission intensity was restored upon addition of EDTA, the sensing process was considered to be reversible rather than an ion-catalyzed reaction.
Quantitative detection of Cr ion in aqueous samples
To study in deep the suitability and on-field applicability of prepared sensor C for ultra-selective detection of chromium ion, the different water samples were spiked by adding chromium to have sample solutions in (1–10) µM conc. range. Accordingly, the results attained displayed a significant recovery of chromium ions from different environmental water samples (Fig. 11). Thus, we presented a cost efficient method for highly selective determination of Cr3+ ion in aqueous samples.
Significance of Current Work
As compared to other chromium ion detection methods (Table 2), the present methodology has the compensation in terms of linearity and ultra-low sensitivity. In addition, it display higher potential for chromium detection.
|
Sensors |
Limit of detection |
Fluores-cence response |
Analyte |
Optimal pH |
Testing media |
Ref |
|---|---|---|---|---|---|---|
|
5,5’-bipyridy- ldicar- boxaldehyde |
NA |
turn-on |
Cr3+ |
6 |
Aqueous |
[31] |
|
carbon quantum dots |
0.64 × 10− 6 M |
turn-off |
Cr3+ |
8 |
Aqueous |
[32] |
|
5−((2-cyano- [1,1- biphenyl]-4-yl)- methoxy)isophthalic acid |
1.4× 10− 6 M |
turn off |
Cr3+ |
8 |
Aqueous |
[33] |
|
rhodamine B lactams |
1× 10− 7 M |
turn on |
Cr3+ |
7 |
NA |
[34] |
|
asparagine derivatives |
1.6 × 10− 8 M |
turn on |
Cr3+ |
7 |
NA |
[35] |
|
curcumin derivative |
2.3×10− 9 M |
turn-on |
Cr3+ |
8 |
Aqueous |
Current work |
In summary, we have developed a sensor C for a possible Cr3+ ion-selective detection in aqueous samples. The sensor C exhibited remarkable sensing properties in terms of fluorescence response, sensitivity, selectivity and detection limit. Specially, sensor C showed a highly selective response for chromium among other interfering metal ions with limit of detection and limit of quantification 2.3×10− 9 M and 3.14 ×10− 8 M respectively. Considering the photo-physical properties and the chemosensing capability, the highly emissive curcumin-based sensor C, [2,6-bis(E)-4-methylbenzylidine)-cyclohexan-1-one] can be considered as one of the very promising candidate for chemosensing applications. Validity of the present method was effectively realized by real sample assay.
Declaration of interest
The authors declare no competing financial interest.
Acknowledgements
We thankDepartment of Chemistry, University of Malakand for providing chemicals and research lab facility for conduction of the present work. We also extend our appreciation to Prof. Dr. Yuta Nishina and Dr. Rizwan Khan (Research Core for Interdisciplinary Sciences, Okayama University, Japan) for their help in characterization of the synthesized compounds.
Supplementary data
FTIR and 1H-NMR spectra of sensor C, fluorescence emission profile as a function of Cr3+ ion, time course of the fluorescence response, titration curve from absorption analysis the response of sensor C towards Cr3+, titration curve of sensor S-Cr3+ complex, Jobs plot analysis, effect of Cr3+ ion concentration, Benesi-Hilderbrand plot, reversibility, pH study. Supplementary data to this article can be found online.
Author Declarations
Funding
There has been no significant financial support for conduction of current research work that could have influenced its outcomes.
Conflicts of interest
The authors declare that they have no conflicts of interest.
Ethics declarations
In the current study the procedure adopted is safe both for animals, humans and their environment.
Consent to participate
All the authors are consent to participated in the current research work. Consent for publication All the authors have given their consent of publishing this article in the said journal.
Authors' contributions
Jehangir Khan
Carried out the main experimental work.
Maria Sadia
Encouraged, supervised the findings of the work and took the lead in writing the manuscript.
Syed Wadood Ali Shah
Supervised the project, conceived and planned the experiments.
Robina Naz
Contributed to the interpretation of the results.
Faiz Ali
Contributed to the final version of the manuscript.
All authors provided critical feedback and helped shape the research, analysis and manuscript.
Data Availability
All the data associated with this research has been presented in this paper.
- Filice FP, Henderson JD, Li MS, Ding Z (2019) Correlating live cell viability with membrane permeability disruption induced by trivalent chromium. ACS omega 4(1):2142–2151
- Bieber VS, Ozcelik E, Cox HJ, Ottley CJ, Ratan JK, Karaman M, Badyal S (2020) Capture and release recyclable dimethylaminomethyl-calixarene functional cloths for point-of-use removal of highly toxic chromium water pollutants. ACS Appl Mater Interfaces 12(46):52136–52145
- Vellaichamy B, Periakaruppan P, Nagulan B (2017) Reduction of Cr6+ from wastewater using a novel in situ-synthesized PANI/MnO2/TiO2 nanocomposite: renewable, selective, stable, and synergistic catalysis ACS Sustain. Chem Eng 5(10):9313–9324
- Barbosa RF, Souza AG, Maltez HF, Rosa DS (2020) Chromium removal from contaminated wastewaters using biodegradable membranes containing cellulose nanostructures. Chem Eng J 395:125–135
- Suo L, Dong X, Gao X, Huang JX, Ye J, Zhao L (2019) Silica-coated magnetic graphene oxide nanocomposite based magnetic solid phase extraction of trace amounts of heavy metals in water samples prior to determination by inductively coupled plasma mass spectrometry. Microchem J 149:104–112
- Lei C, Wang C, Chen W, He M, Huang B (2020) Polyaniline magnetic chitosan nanomaterials for highly efficient simultaneous adsorption and in-situ chemical reduction of hexavalent chromium: removal efficacy and mechanisms. Sci Total Environ 733:139–146
- Ding J, Pu L, Wang Y, Wu B, Yu A, Zhang G, Gao X (2018) Adsorption and reduction of Cr (VI) together with Cr (III) sequestration by polyaniline confined in pores of polystyrene beads. Environ Sci Technol 52(21):12602–12611
- Khan SU, Islam DT, Farooqi IH, Ayub S, Basheer F (2019) Hexavalent chromium removal in an electrocoagulation column reactor: Process optimization using CCD, adsorption kinetics and pH modulated sludge formation. Process Saf Environ Prot 122:118–130
- Kim T, Kim TK, Zoh KD (2020) Removal mechanism of heavy metal (Cu, Ni, Zn, and Cr) in the presence of cyanide during electrocoagulation using Fe and Al electrodes. J Water Process Eng 33:101–109
- Mahdavi S, Jalali M, Afkhami A (2013) Heavy metals removal from aqueous solutions using TiO2, MgO, and Al2O3 nanoparticles. Chem Eng Commun 200(3):448–470
- Kołodyńska D, Bąk JK, Razna JK, Pietrzak R (2017) Uptake of heavy metal ions from aqueous solutions by sorbents obtained from the spent ion exchange resins. Microporous Mesoporous Mater 244:127–136
- Fu HR, Xu ZX, Zhang J (2015) water soluble metal-organic frameworks for fast and high dichromate trapping via sinsgle-crystal-single-crystal ion exchange. Chem Mat 27(1):205–210
- Ouyang R, Bragg SA, chambers JQ (2012) Xue ZL Flower like self assembly of gold nanopartcles for high sensitive electrochemical detection of chromium (IV). Anal Chim Acta 722:1–7
- Tumolo M, Ancona V, Paola DD, Losacco D, Campanale C, Massarelli C, Uricchio VF (2020) Chromium pollution in european water, sources, health risk, and remediation strategies: an overview. Int J Environ Res Public Health 17(15):54–68
- Hao J, Li XY, Zhang Y, Dong WK (2018) A reversible bis(salamo)-based fluorescence sensor for selective detection of Cd2+ in water-containing systems and food samples. Mater 11(4):523–530
- Acha ND, Elosua C, Corres JM, Arregui FJ (2019) Fluorescent sensors for the detection of heavy metal ions in aqueous media. Sens 19(3):599–604
- Chu ZY, Wang WN, Zhang CY, Ruan J, Chen BJ, Xu HM, Qian HS (2019) Monitoring and removal of trace heavy metal ions via fluorescence resonance energy transfer mechanism: In case of silver ions. Chem Eng J 375:121–127
- Chen S, Xue Z, Gao N, Yang X, Zang L (2020) Perylenediimide-based fluorescent and colorimetric sensors for environmental detection. Sens 20(3):917–923
- Li E, Zeng X, Fan Y (2009) Removal of chromium ion (III) from aqueous solution by manganese oxide and microemulsion modified diatomite. Desalination 238(1–3):158–165
- Prohl M, Schubert US, Weigand W, Gottschaldt M (2016) Metal complexes of curcumin and curcumin derivatives for molecular imaging and anticancer therapy. Coord Chem Rev 307:32–41
- Carmona-Vargas CC, Alves DC, Brocksom TJ, Oliveira KT (2017) Combining batch and continuous flow setups in the end-to-end synthesis of naturally occurring curcuminoids. React Chem Eng 2(3):366–374
- Badal MMR, Ashekul IHM, Maniruzzaman M, Abu Yousuf M (2020) Acidochromic behavior of dibenzylidene cyclohexanone-based bischalcone: experimental and theoretical study. ACS omega 5(36):22978–22983
- Tamang N, Ramamoorthy G, Joshi M, Choudury AR, Kumar S, Golakoti NR, Doble M (2020) Diarylidenecyclopentanone derivatives as potent anti-inflammatory and anticancer agents. Med Chem Res 29(9):1579–1589
- Zhang H, Liu Q, Wang T, Yun Z, Li G, Liu J, Jiang G (2013) Facile preparation of glutathione-stabilized gold nanoclusters for selective determination of chromium (III) and chromium (VI) in environmental water samples. Anal Chim Acta 770:140–146
- Dutta A, Mahapatra M, Deb M, Mitra M, Dutta S, Chattopadhyay PK, Singha NR (2020) Fluorescent terpolymers using two non-emissive monomers for Cr(III) sensors, removal, and bio-imaging. ACS Biomater Sci Eng 6(3):1397–1407
- Saini A, Bhasin AK, Singh N, Kaur N (2016) Development of a Cr(III) ion selective fluorescence probe using organic nanoparticles and its real time applicability. New J Chem 40(1):278–284
- Carney MJ, Robertson NJ, Halfen JA, Zakharov LN, Rheingold AL (2004) Octahedral chromium (III) complexes supported by bis (2-pyridylmethyl) amines: ligand influence on coordination geometry and ethylene polymerization activity. Organometallics 23(26):6184–6190
- Doistau B, Collet G, Bolomey EA, Sadat-Noorbakhsh V, Besnard C, Piguet C (2018) Heteroleptic ter–bidentate Cr (III) complexes as tunable optical sensitizers. Inorg Chem 57(22):14362–14373
- Al Thagfi J, Lavoie GG (2012) Synthesis, characterization, and ethylene polymerization studies of chromium, iron, and cobalt complexes containing 1, 3-Bis (imino)-N-heterocyclic carbene ligands. Organometallics 31(6):2463–2469
- Park JE, Kang SK, Woo JO, Son KS (2015) Highly active chromium (III) complexes based on tridentate pyrazolyl pyridyl ligands for ethylene polymerization and oligomerization. Dalton Trans 44(21):9964–9969
- Balamurugan G, Velmathi S (2018) Coplanarity driven fluorescence turn-on sensor for chromium (III) and its application for bio-imaging. Photochem Photobiol Sci 17(2):239–244
- Feng S, Gao Z, Liu H, Huang J, Li X, Yang Y (2019) Feasibility of detection valence speciation of Cr (III) and Cr (VI) in environmental samples by spectrofluorimetric method with fluorescent carbon quantum dots. Spectrochim Acta A Mol Biomol Spectrosc 212:286–292
- Sun Z, Yang M, Ma Y, Li L (2017) Multi-responsive luminescent sensors based on two-dimensional lanthanide–metal organic frameworks for highly selective and sensitive detection of Cr (III) and Cr (VI) ions and benzaldehyde. Cryst Growth Des 17(8):4326–4335
- Zheng X, Zhang W, Mu L, Zeng X, Xue S, Tao Z, Yamatob T (2010) A novel rhodamine-based thiacalix [4] arene fluorescent sensor for Fe3+ and Cr3+. J Incl Phenom Macrocycl Chem 68(1):139–146
- Esteves CI, Raposo MM, Costa SP (2011) Novel highly emissive non-proteinogenic amino acids: synthesis of 1, 3, 4-thiadiazolyl asparagines and evaluation as fluorimetric chemosensors for biologically relevant transition metal cations. Amino Acids 40(4):1065–1075
- GraphicalAbstract.png
- Scheme1.png
Scheme 1 Preparation of sensor C
- Scheme2.png
Scheme 2 proposed structures of the chromium complex with sensor C