This study was approved by the Ethics Committee of the First Hospital of China Medical University
Cell culture and plasmids
Lung cancer cell lines NCI-H460 and A549 were purchased from the cell bank of Chinese Academy of Science (Shanghai, China), cultured in HyClone (Logan, UT, USA) RPMI 1640 medium, containing 10% fetal bovine serum at 37°C with 5% CO2. The cells were cultured in 6-well plates for 24 hours before transfection or interference.
The plasmid of pEGFP-N1-HPV16 E6, pEGFP-N1-HPV16 E7, and pEGFP-N1 were kind gifts from Prof Xudong Tang (Institute of Biochemistry and Molecular Biology, Guangdong Medical College, China). Small-interfering RNA (siRNA) was performed to silence the expression of specific genes. HPV16 E6 siRNA and HPV16 E7 siRNA were purchased from RIBOBIO (Guangzhou, China). NDRG2 siRNA and β-catenin siRNA were purchased from Proteintech (Wuhan, China). Scrambled siRNA was used as a non-specific siRNA control.
Transfection
Cells were transiently transfected with plasmids using the Lipofectamine 3000 Transfection Kit (Invitrogen, Carlsbad, CA, USA) following the manufacture’s instruction. Transfection with empty vector and mock transfection were served as the controls. The cells were harvested 48 hours after transfection to measure the protein levels by western blotting and 24 hours to measure the mRNA levels by quantitative reverse transcriptase-polymerase chain reaction (RT-qPCR).
Western blotting
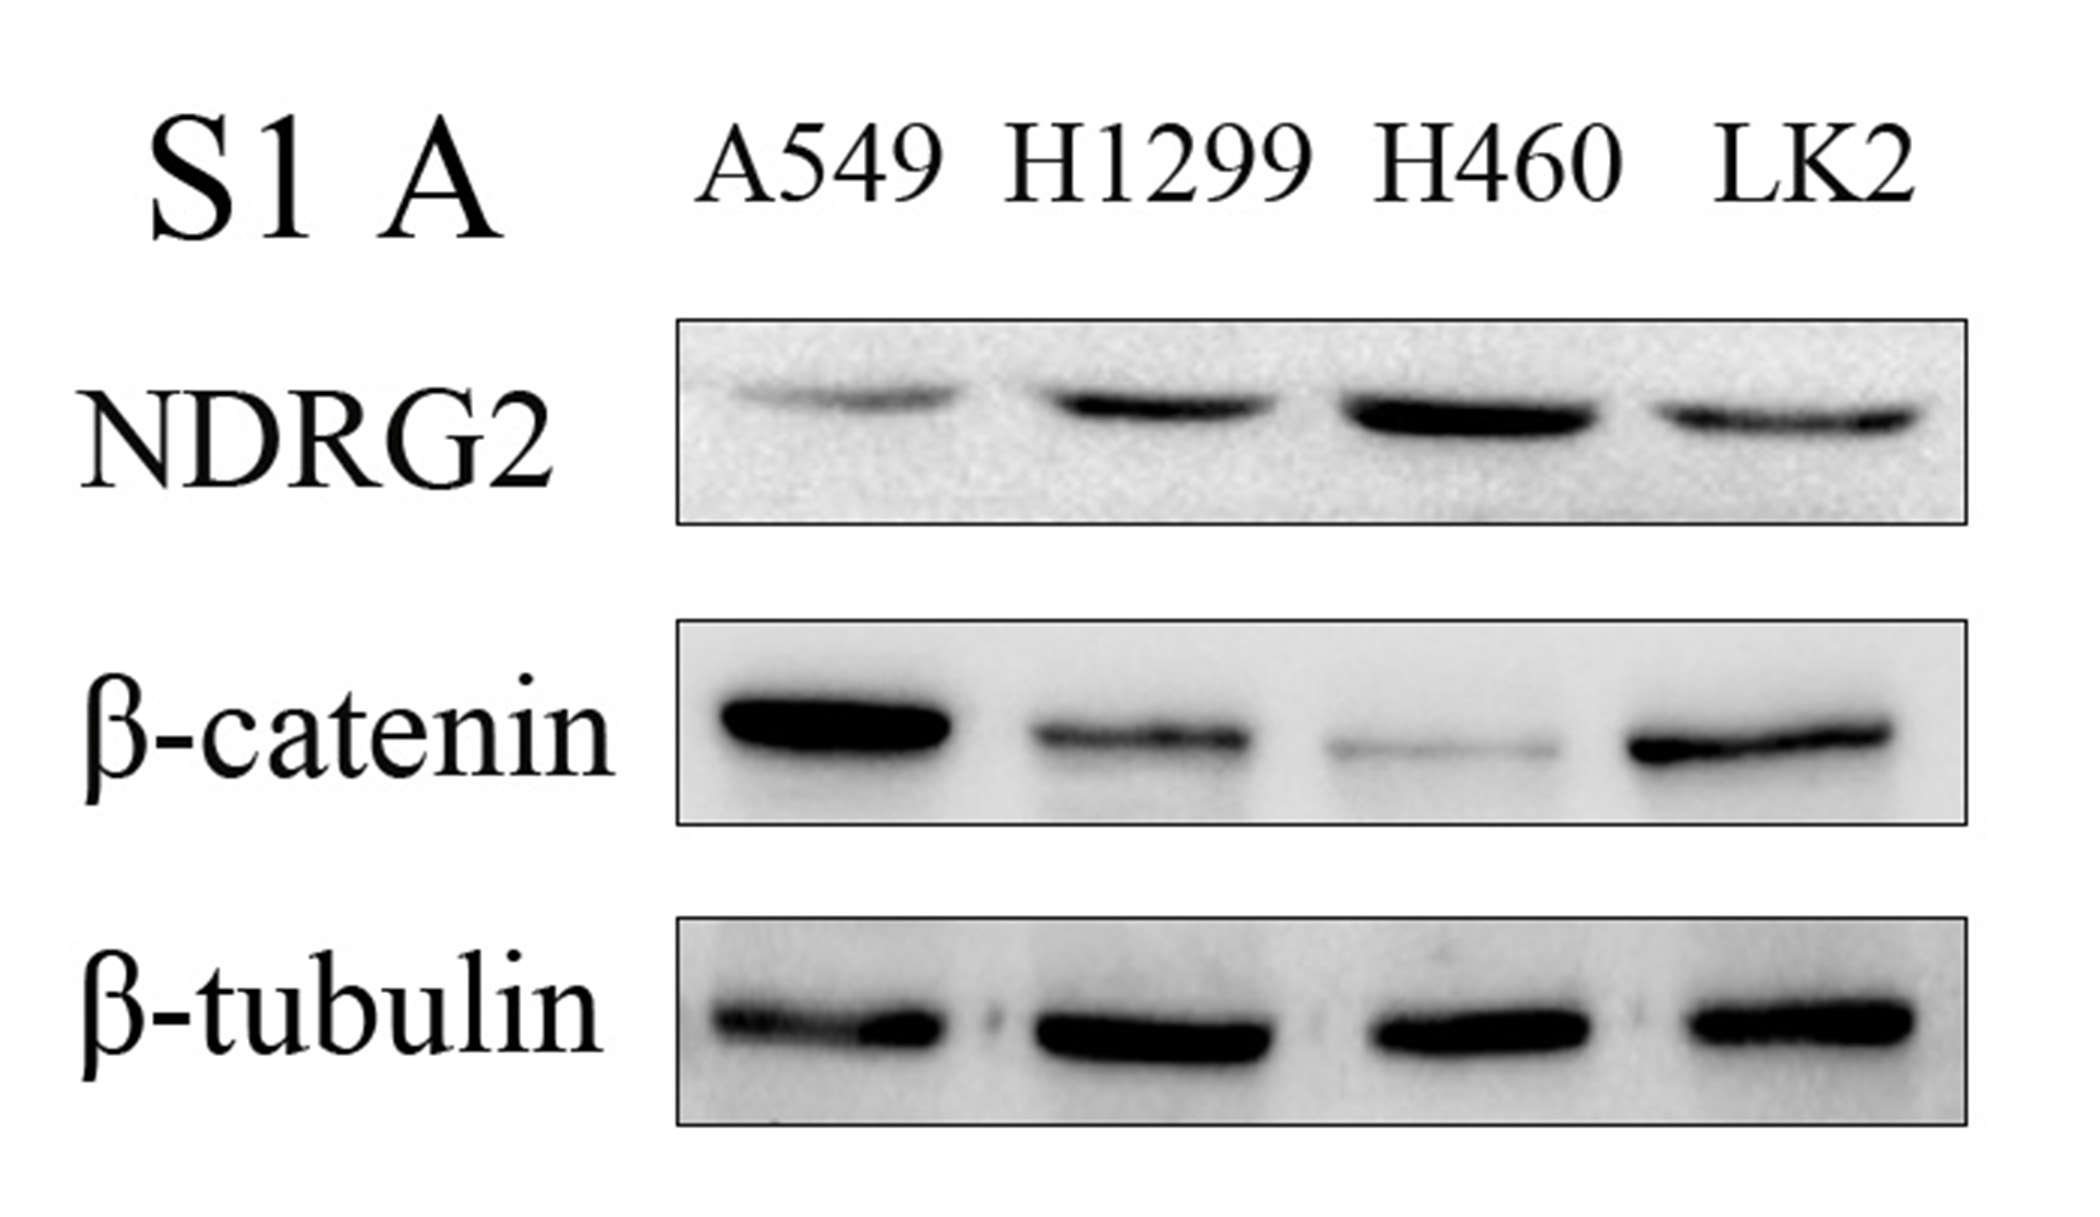
The Western-blot assay was described in reference with PMID 3183982533. Mouse anti-human HPV16 E6 monoclonal antibody (1:700; Abcam, Boston, MA, USA), rabbit anti-human HPV16 E7 polyclonal antibody (1:200; Bioss Biotechnology Co., Ltd, Beijing, China), NDRG2 antibody (1:2000; Proteintech Group, Wuhan, China), β-catenin antibody (1:500; Wanleibio, China), GLUT1 antibody (1:500; Wanleibio, China), β-tubulin antibody (1:1000; Sino Biological, Beijing, China). After incubation with appropriate secondary antibodies anti-mouse or anti-rabbit IgG (Cell Signaling Technology, Beverly, MA) at 37˚C for 2 hours, protein bands were visualized using ECL Western blot kit (advansta, USA) and detected using Bio Imaging System (UVP Inc., Upland, CA, USA). Protein bands were visualized using electrochemiluminescence substrate (Pierce) and detected by using BioImaging Systems (DNR, Jerusalem, Israel). β-tubulin protein levels were used as the control group to calculate relative protein levels.
Quantitative reverse transcription PCR
The Quantitative reverse transcription PCR assays described in reference with PMID 3183982533. Experiments were repeated in triplicate. The primers used are shown in Table 1. The amplified products of E6, E7, NDRG2, β-catenin, GLUT1, and GAPDH were confirmed by correct sizes on an agarose DNA gel. Products were extracted and purified from the gel, and sent for DNA sequencing, respectively. The sequencing results were 100% correct.
Table 1
Sequencesand features of primers used for qRT-PCR
| Gene | Forward/ Reverse | Sequence | Size(bp) | mRNA |
| E6 | 270 | GTATGGAACAACATTAGAACAGCAA | 81 | KX545363 |
| | 350 | AGTGGCTTTTGACAGTTAATACAC | | |
| E7 | 482 | GCATGGAGATACACCTACATTG | 273 | KX545363 |
| | 754 | TGGTTTCTGAGAACAGATGG | | |
| NDRG2 | 1786 | GAGAGGAGATCGGAAAGCCG | 339 | NC_000014.9 |
| | 2124 | AAGATGGTTACCGGGGCTTG | | |
| β-catenin | 26331 | CTGGTGGGCTGCAGAAAATG | 175 | NC_000003.12 |
| | 26505 | GGAATGACATGACACTGGAGGT | | |
| GLUT1 | 1071 | CTGGCATCAACGCTGTCTTC | 167 | NM_006516.3 |
| | 1237 | GCCTATGAGGTGCAGGGTC | | |
| GAPDH | 50 120 | TTCTTTTGCGTCGCCAGCCGAG CCAGGCGCCCAATACGACCAAA | 71 | XM_019023188.1 |
| mRNA: messenger RNA; qRT-PCR: quantitative reverse transcriptase-polymerase chain reaction |
Immunofluorescence
The immunofluorescence assays described in reference with PMID 3183982533. β-catenin antibody (1:50; Cell Signaling Technology, Danvers, MA, USA) was used in the assay. Images were obtained on a fluorescent microscopy (BX-51, Olympus Corporation, Tokyo, Japan).
Glucose uptake assay
The level of glucose absorption was measured using the glucose analog 2-NBDG (BioVision, CA, USA) as a fluorescent probe. Cells were seeded in 24-well tissue culture plates at a density of 2–5×10⁴ cells per well. After 10 hours, removed regular culture medium (10% FBS). Cells were transfected with E6, E7, siE6, siE7, siNDRG2, siβ-catenin or untransfected in 400 µl cell culture medium with 0.5% FBS. After incubated cells for 3 hours, 4ul 2-NBDG was added to each well and incubated for 30 minutes at 37°C with 5% CO2. To measure the level of 2-NBDG, the stained cells were observed under the fluorescent microscopy (BX-51, Olympus Corporation, Tokyo, Japan).
Statistical analysis
Statistical analyses were completed using SPSS 22.0 software (IBM) for Windows in this study. All data shown were mean ± standard deviation (SD) of at least three separate experiments. Independent Student t-test or one-way ANOVA were used to compare the continuous variables between the two groups or more than two groups. P < 0.05 was considered to be statistically significant.