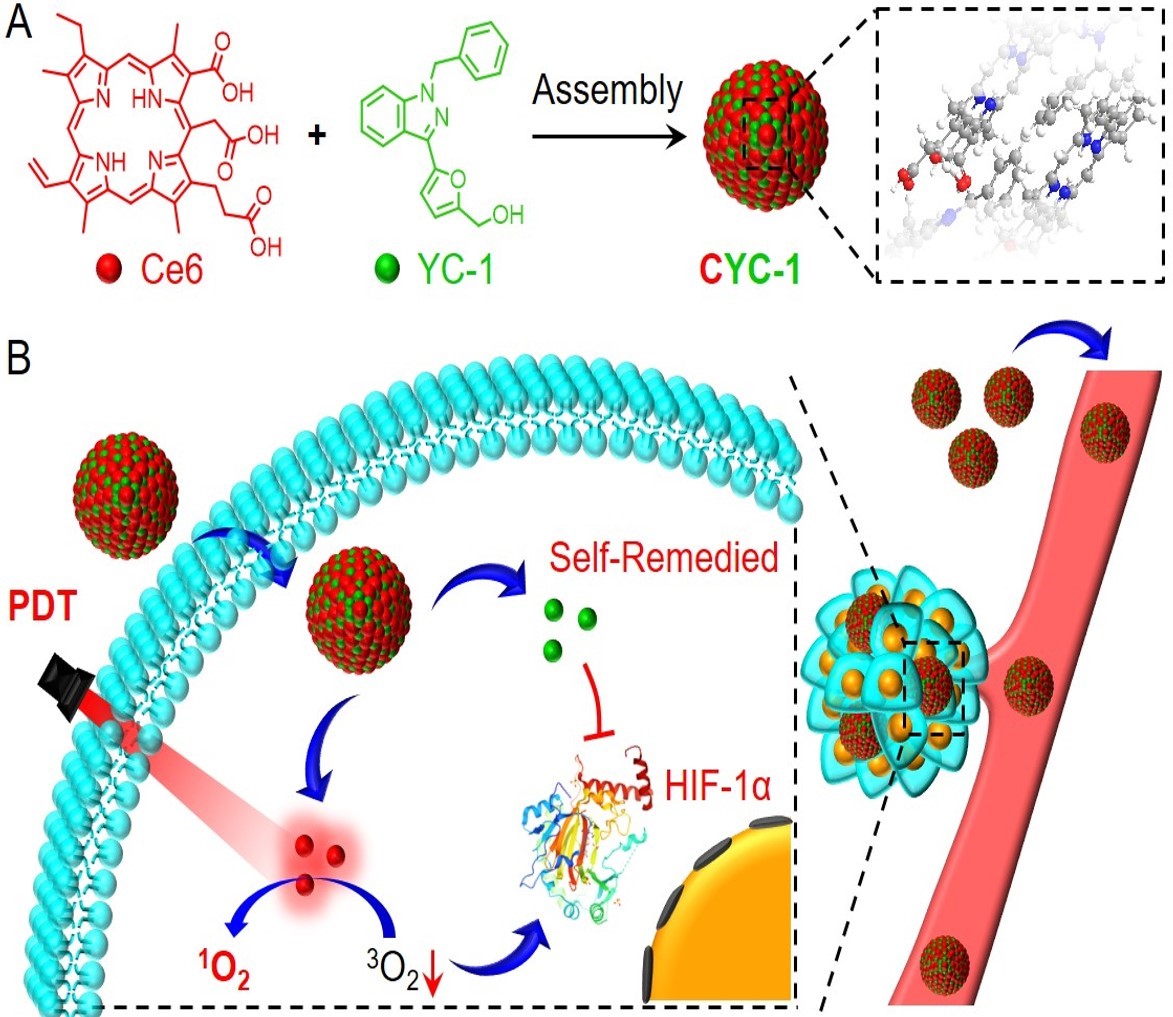
Preparation and characterization of CYC-1
CYC-1 was prepared by the self-assembly of Ce6 and YC-1 via an amended nanoprecipitation method. To obtain an ideal nanomedicine, the self-assembly process of Ce6 and YC-1 was studied at different feed ratios. As shown in Fig. 1A, TEM observations indicated that Ce6 and YC-1 at the feed ratio of 1:1 could fabricate into spherical nanoparticles with relatively uniform size and morphology. Furthermore, the particle size distribution was evaluated by DLS. As displayed in Fig. 1B, at the feed ratio of 1:1, the harvested nanomedicine had the minimum average size and its distribution was regular. Subsequently, the assembly mechanism was explored by using the UV-Vis spectrum. After treated with NaCl, no obvious changes were found on the shapes of the UV-vis spectra (Fig. 1C), which suggested an ignorable intermolecular electrostatic interaction in CYC-1. However, different spectra of CYC-1 were observed when dissolved in water and DMSO (Fig. 1D). Particularly, CYC-1 held a broader and red-shifted Soret band of Ce6 in aqueous phase, which indicated π-π stacking and hydrophobic interactions between Ce6 and YC-1. What’s more, the addition of hydrophobic SDS significantly impacted the spectrum of CYC-1 (Fig. 1E), demonstrating that SDS participated in the assembly of CYC-1. Based on these, it was speculated that the π-π stacking and hydrophobic interactions might be the main drivers of drug self-assembly. The drug loading rates of Ce6 and YC-1 were confirmed to be 84.3% and 15.7% by using UV-vis spectrum (Fig. S1) and high performance liquid chromatography (HPLC) (Fig. S2). Afterwards, the stability of CYC-1 was also evaluated. As shown in Fig. 1F, the particle size and PDI of CYC-1 were detected to have no obvious fluctuations in one week. The favorable stability of DSDS was the precondition for biomedical applications. Taken together, by virtue of π-π stacking and hydrophobic interactions, Ce6 and YC-1 at proper feed ratio could assemble into the nanomedicine with a uniform morphology and size distribution as well as favorable dispersity and stability (Fig. 1G).
Evaluation of cellular uptake and ROS generation
After successful preparation of CYC-1, its cellular uptake behavior was evaluated by CLSM and flow cytometry. As displayed in Fig. 2A, with the prolonged incubation time, 4T1 cells treated with either Ce6 or CYC-1 exhibited a gradually enhanced red fluorescence, which demonstrated an incubation time-dependent cellular uptake. However, compared with Ce6, CYC-1 could be internalized more effectively with a much stronger red fluorescence in 4T1 cells. Similar results were confirmed by the quantitative fluorescence analysis using flow cytometry (Fig. 2B). No matter incubation for 2, 4, 8 or 24 h, the fluorescence intensity of 4T1 cells treated with CYC-1 was more than 5 times as high as that of treated with Ce6. These results indicated that the self-assembled nanomedicine gained the superiority on cellular drug delivery over the hydrophobic photosensitizer.
Furthermore, the ROS production ability of CYC-1 was also detected to assess its potential for PDT. Above all, the ROS generated by Ce6 and CYC-1 was monitored by fluorescence spectrum using SOSG as the 1O2 probe. As shown in Fig. 2C, in the absence of light, both Ce6 and CYC-1 failed to produce 1O2. Once exposed to light, the SOSG fluorescence dramatically increased, indicating abundant production of 1O2. Subsequently, the cellular ROS level was measured by CLSM using DCFH-DA as the ROS sensor. As described in Fig. 2D, after treated with CYC-1 and light, 4T1 cells presented bright green fluorescence, which implied lots of ROS production. Of special note, although Ce6 in solution could generate abundant ROS, it was unable to elevate the ROS level of tumor cells under light irradiation. Consistent conclusion was obtained by the mean fluorescence intensity (MFI) analysis (Fig. 2E). Compared with the PBS group, only a little fluorescence enhancement was found in 4T1 cells treated with Ce6 and light, which should be ascribed to the limited cellular internalization of hydrophobic Ce6 (Fig. 2A). The main reason for it should be the limited cellular internalization of hydrophobic Ce6 (Fig. 2A). To sum up, this self-delivery strategy could significantly improve the cellular uptake of therapeutic agents and promote the ROS production in cells for effective photodynamic tumor therapy.
Cytotoxicity of CYC-1
Prior to detecting the antitumor performance, the cytotoxicity of CYC-1 was investigated against 4T1 cells via MTT assay. As indicated in Fig. 3A, in the absence of light irradiation, Ce6, YC-1 and CYC-1 had such a low toxicity that the cell viability was higher than 85%. However, after irradiated with light, Ce6 exhibited an obviously enhanced cytotoxicity due to the initiation of PDT. Such striking differences also illustrated the controllability of PDT in tumor therapy. More importantly, in comparison with the PDT of Ce6, CYC-1 with light showed a much more robust antitumor effect. One of the main reasons should be the improved cellular uptake of therapeutic agents after self-assembly. Another primary reason might be that the YC-1 mediated HIF-1α inhibition sensitized the tumor cells to PDT, leading to an increased cytotoxicity. Besides, it should be noted that CYC-1 could restrain the cell proliferation more effectively than the combined administration of Ce6 and YC-1 in the presence of light. This result highlighted again the advantage of the self-remedied nanomedicine in tumor therapy.
Subsequently, the anti-proliferation ability was further evaluated by detecting the cell apoptosis using flow cytometry. As shown in Fig. 3B, when without illumination, the percentages of viable cells were more than 96% in all groups. The limited PDT of Ce6 could only cause less than half the tumor cells apoptosis. However, with the assistance of YC-1, the PDT efficacy of Ce6 was amplified that over 60% of the cells were found in early or late apoptotic state. More interestingly, there were almost no living cells after treated with CYC-1 and light, which demonstrated the best antitumor effect owing to the HIF-1α inhibition and self-delivery strategy. In addition, the cells after different treatments were performed for live/dead staining analysis by CLSM (Fig. 3C). Particularly, 4T1 cells treated with CYC-1 and light showed bright red fluorescence and a dash of green fluorescence, verifying that the overwhelming majority of the cells had been dead after the YC-1-assistant PDT.
To validate the inhibitory effect of YC-1 on HIF-1α, 4T1 cells after various treatments were carried out for western blot analysis. Notably, previous investigations had confirmed that the self-delivery strategy of CYC-1 could significantly improve the cellular uptake and ROS production of Ce6 (Fig. 2). In this case, the cells treated with CYC-1 should consume more oxygen for PDT than those treated by Ce6 in the presence of light. However, the most expression of HIF-1α was actually observed on the cells treated by Ce6 and light (Fig. S3), which indicated the maximal oxygen consumption. Moreover, after simultaneously treated with YC-1, the PDT of Ce6 induced HIF-1α activation was found to be suppressed. Based on these, it could be deduced that YC-1 could really inhibit HIF-1α to surmount the Achilles' heel of PDT for enhanced antitumor efficiency.
Antitumor study in vivo
Antitumor study of CYC-1 was performed under light irradiation against the 4T1 tumor-bearing mice (Fig. 4A). After intravenous administration, the biodistribution of CYC-1 was investigated by fluorescence imaging using small animal imaging system. As illustrated in Fig. 4B, the injected CYC-1 initially distributed throughout the body with the blood flow. Subsequently, a preferential fluorescence aggregation was found on the tumor site, which implied an effective tumor accumulation of CYC-1 via EPR effect. 12 h after injection, the mouse was sacrificed to collect the tumor tissue and main organs for ex vivo imaging. Obviously, in addition to the main metabolic organ of liver, tumor exhibited the strongest fluorescence accumulation, which further demonstrated the EPR-mediated passive targeting ability of CYC-1.
Inspired by it, the antitumor efficacy of CYC-1 was then evaluated in vivo after intravenous injection. As shown in Fig. 4C, the tumor growth was monitored every other day. The mice in PBS group without any treatments were used as the control, whose tumors grew very fast. Besides, YC-1 and CYC-1 had a certain ability of tumor suppression while the latter exhibited a better effect. The possible reason should be that the nanosized CYC-1 could be accumulated into tumor tissues more effectively to inhibit the HIF-1α activity and impair tumor growth. More importantly, in the presence of light, CYC-1 had absolute superiority over Ce6 on the tumor inhibition, which should be attributed to the improved drug delivery efficiency after self-assembly as well as the enhanced PDT efficacy through HIF-1α inhibition. Besides, the body weights of the mice were increasing during the treatments (Fig. 4D), which indicated a low system toxicity of these therapeutic agents. At the end of treatments, the tumor tissues were obtained for photographing (Fig. 4E) and weighing (Fig. 4F), which further verified the best antitumor effect of CYC-1 under light irradiation. Moreover, the tumor tissues were also stained by H&E for histological examination. Compared with other groups, the tumors treated with CYC-1 and light held lots of damaged cells without nucleus (Fig. 4G), illustrating that the YC-1 assistant PDT could maximally destroy the tumor tissue to restrain its malignant proliferation.
In order to deeply explore the mechanism of YC-1, the tumor tissues were carried out for immunofluorescent staining after various treatments. As reflected in Fig. 4H, the immunofluorescence of HIF-1α in YC-1 and CYC-1 groups was weaker relative to that in PBS group, which confirmed the HIF-1α inhibition mediated by YC-1. Conversely, the tumor tissue after the PDT of Ce6 showed an obviously enhanced immunofluorescence, suggesting that the PDT aggravated the tumor hypoxia and caused the upregulation of HIF-1α. Even so, CYC-1 with light was found to not increase the expression of HIF-1α. This significant difference strongly demonstrated that YC-1 as a competent inhibitor of HIF-1α could effectively mitigate the tumor hypoxia to improve the therapeutic effect of PDT. The self-remedied strategy of CYC-1 was capable of surmounting the Achilles' heel of PDT, suggesting a great potential in hypoxic tumor therapy.
Biosafety analysis of CYC-1
Favorable biosafety is necessary for therapeutic agents in biomedical applications. Although nanomedicine could realize the targeted drug delivery through EPR effect, it is inevitable to have some aggregation on normal tissues. To assess the biosafety of CYC-1 in vivo, the main organs of the mice after treatments were sliced and stained by H&E. As shown in Fig. 5A, the histological morphologies of these organs were observed to have no obvious variations, which implicated a low side effect. The major reasons for it should be that the PDT of CYC-1 had a good regioselectivity under local irradiation and it was less toxic when without light exposure. Moreover, the serum biochemical indexes of blood urea nitrogen (BUN), alanine aminotransferase (ALT), aspartate transaminase (AST) and uric acid (UA) were detected to have no significant abnormality (Fig. 5B), which suggested little damage of therapeutic agents to liver and kidney. Additionally, blood routine analysis of the mice was also carried out (Fig. 5C). Relevant parameters were basically in normal scopes, confirming a favorable blood compatibility of CYC-1. Undoubtedly, CYC-1 held good antitumor performance with few adverse reactions.