3.1 A landscape of immune infiltration of patients with LUAD
Immune cell infiltration and TME are vital in tumor immunity. In recent studies, MCP-counter was widely used to quantify the relative abundance of immune cell subpopulations through the expression of multiple immune-infiltrating cell markers, yielding robust results. A total of 400 patients from TCGA-LUAD were screened as TCGA cohort because of having relatively complete demographic information, clinical information, and survival information. MCP-counter was used to visualize the relative abundance of multiple immune-infiltrating cell subpopulations with Z score (Fig. 1A). The significant difference in the relative abundance of immune cell subpopulations between different samples was clearly observed. Among these immune cell subpopulations, patients were divided into low expression of B lineage (100 patients) and high expression of B lineage (300 patients). The relative abundance of B lineage significantly positively correlated with OS (Fig. 1B). However, MCP-counter was used to quantify the relative abundance of B lineage based on 400 samples in the TCGA cohort. It is difficult for individuals to quantify the abundance of B lineage. Therefore, a B-lineage-associated risk signature was constructed to assess the OS of patients with LUAD and guide individualized diagnosis and treatment strategies. The study design is shown in Fig. 1C.
3.2 Construction of a B-lineage-associated risk signature
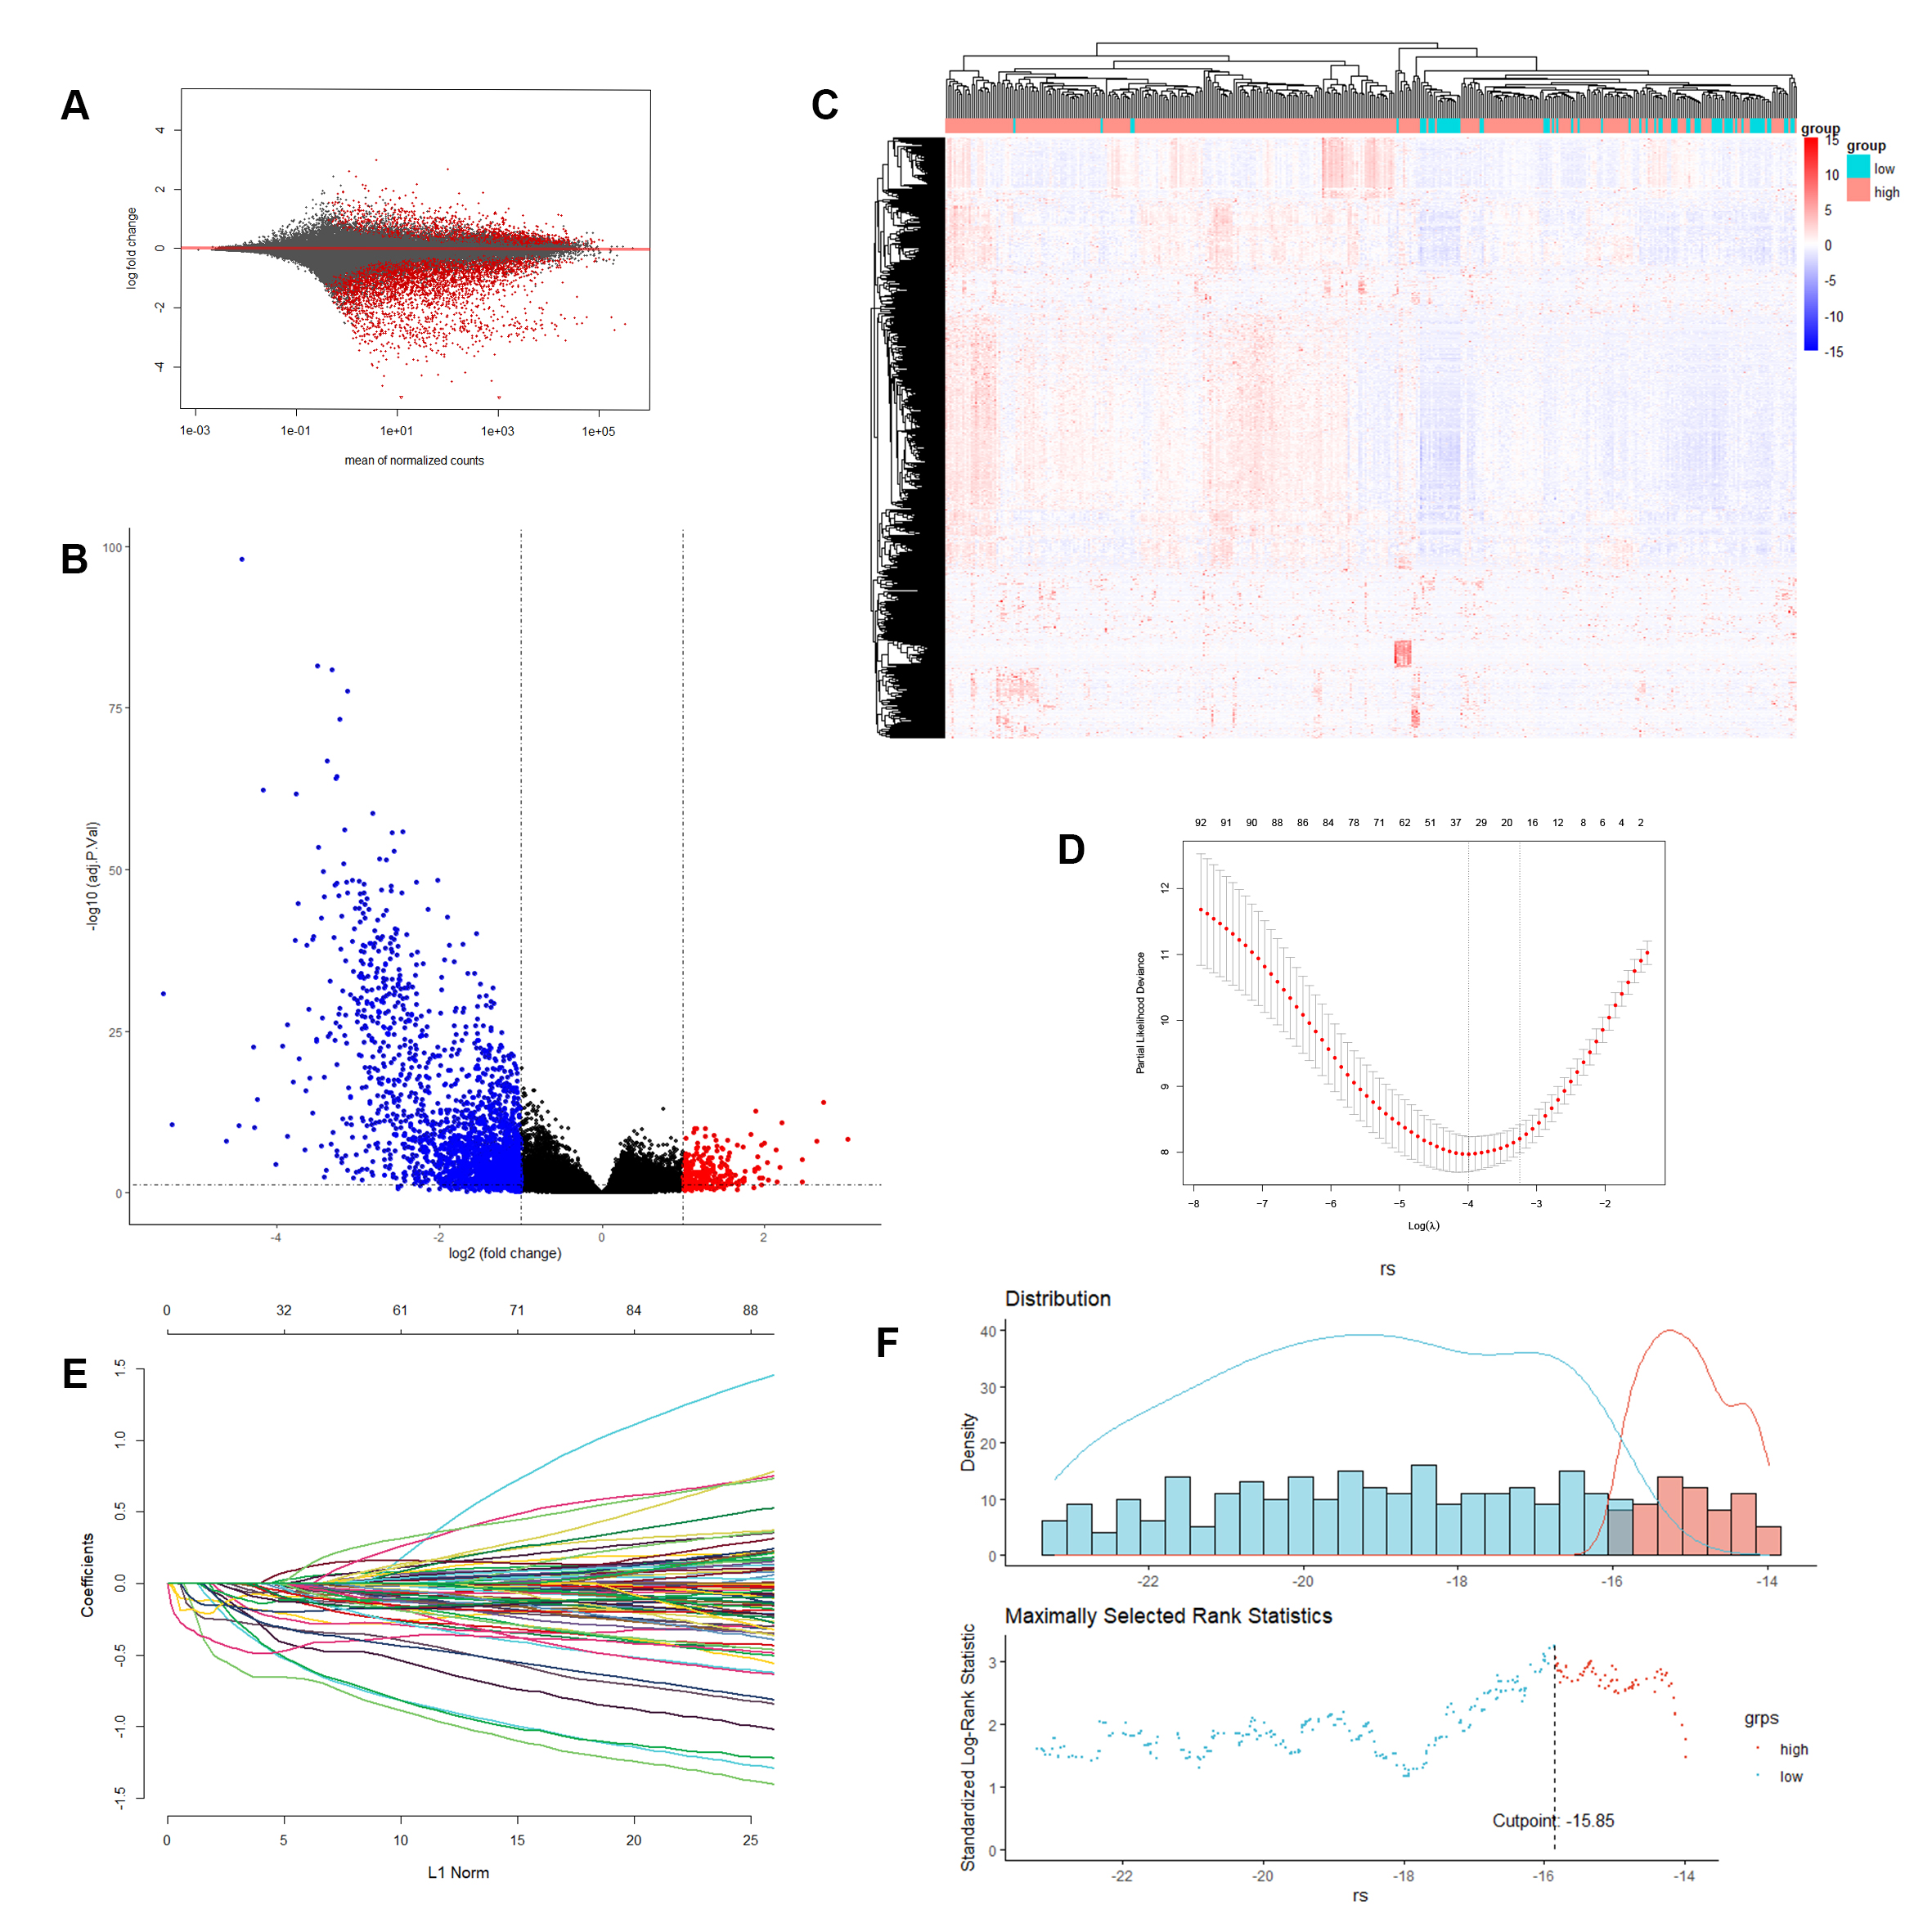
RNA expression profiles of 400 samples in the TCGA cohort were used to construct a B-lineage-associated risk signature predicting the OS of patients with LUAD; the gene expression of total RNA is shown in Figure S1A. In the TCGA cohort, differently expressed genes were detected between low expression of B lineage (70 patients) and high expression of B lineage (330 patients), revealing that 1057 genes were statistically significantly differentially expressed, including 991 downregulated genes and 66 upregulated genes (Fig. S1B). Moreover, cluster analysis of these 1057 significantly differentially expressed genes in the TCGA cohort was performed (Table S1). A significant clustering was observed between the 2 groups of samples, confirming that these 1057 genes were statistically significantly differently expressed (Fig.S1C).
Furthermore, we filtered the differentially expressed genes with absolute value of logFC > 3 and P value < 0.01, including 95 downregulated genes and 1 upregulated genes, to identify genes with large differences between groups as B-lineage-associated risk signature candidate genes (Table S2). Further, 13 genes, including FDCSP, FCER2, CNR2, MS4A1, FCRL1, BLK, TNFRSF13B, CD19, FCRLA, CR2, GH1, KRT20, and ALB, with nonzero regression coefficients with 10-fold cross-validation were found to have maximum prognostic value according to LASSO Cox regression analysis (Fig. S1D and S1E). Finally, a 13-gene B-lineage-associated risk signature was constructed, and the risk score of this risk signature was calculated using the following formula:

The coefficient of each gene is shown in Table S4. Based on the B-lineage-associated risk signature, patients were divided into two subgroups. The optimal cutoff value was determined using the “surv_cutpoint” function of the “survminer” R package; the optimal cutoff value was − 16.2 (Fig.S1F). The cutoff value in the TCGA cohort served as the cutoff value to assign patients into high-risk and low-risk groups across all patients with LUAD in the following analysis.
3.3 Evaluation and validation of the prognostic ability of B-lineage-associated risk signature
The prognostic capability of the B-lineage-associated risk signature in the TCGA cohort was evaluated. Due to the limited patient records available, the duration of treatment is unknown. However, the diversity of treatment methods in patient samples reflects the challenging variables that clinicians encounter when treating LUAD. The Kaplan–Meier analysis demonstrated that the patients in the high-risk group correlated with worse outcome (Fig. 2A). The risk signature distribution, OS, and 13-gene expression profile are shown in Fig. 2B. In addition, the time-dependent ROC curve analysis of the of B-lineage-associated risk signature in the TCGA cohort revealed a promising prognostic capability for OS (half-year AUC = 0.764, 1-year AUC = 0.646, 2-year AUC = 0.621, 5-year AUC = 0.635, and 7-year AUC = 0.622, Fig. 2C).
The risk signature was assessed in an independent validation cohort, meta-GEO cohort, including GSE29013, GSE30219, and GSE31908, to validate the robust ability of the B-lineage-associated risk signature to predict OS. The cohort contained 131 patients with LUAD having survival information and RNA expression profiles. The Kaplan–Meier analysis yielded consistent results that patients in the high-risk group were positive related to worse clinical outcome (Fig. 2D). The risk signature distribution, OS, and 13-gene expression profile are shown in Fig. 2E. The time-dependent ROC curve analysis of the B-lineage-associated risk signature in the meta-GEO cohort validated the robustness of prognostic capability (half-year AUC = 0.75, 1-year AUC = 0.764, 2-year AUC = 0.665, 5-year AUC = 0.596, and 7-year AUC = 0.602, Fig. 2F). The aforementioned results indicated that the B-lineage-associated risk signature could predict OS.
3.4 Stratification analysis of the B-lineage-associated risk signature
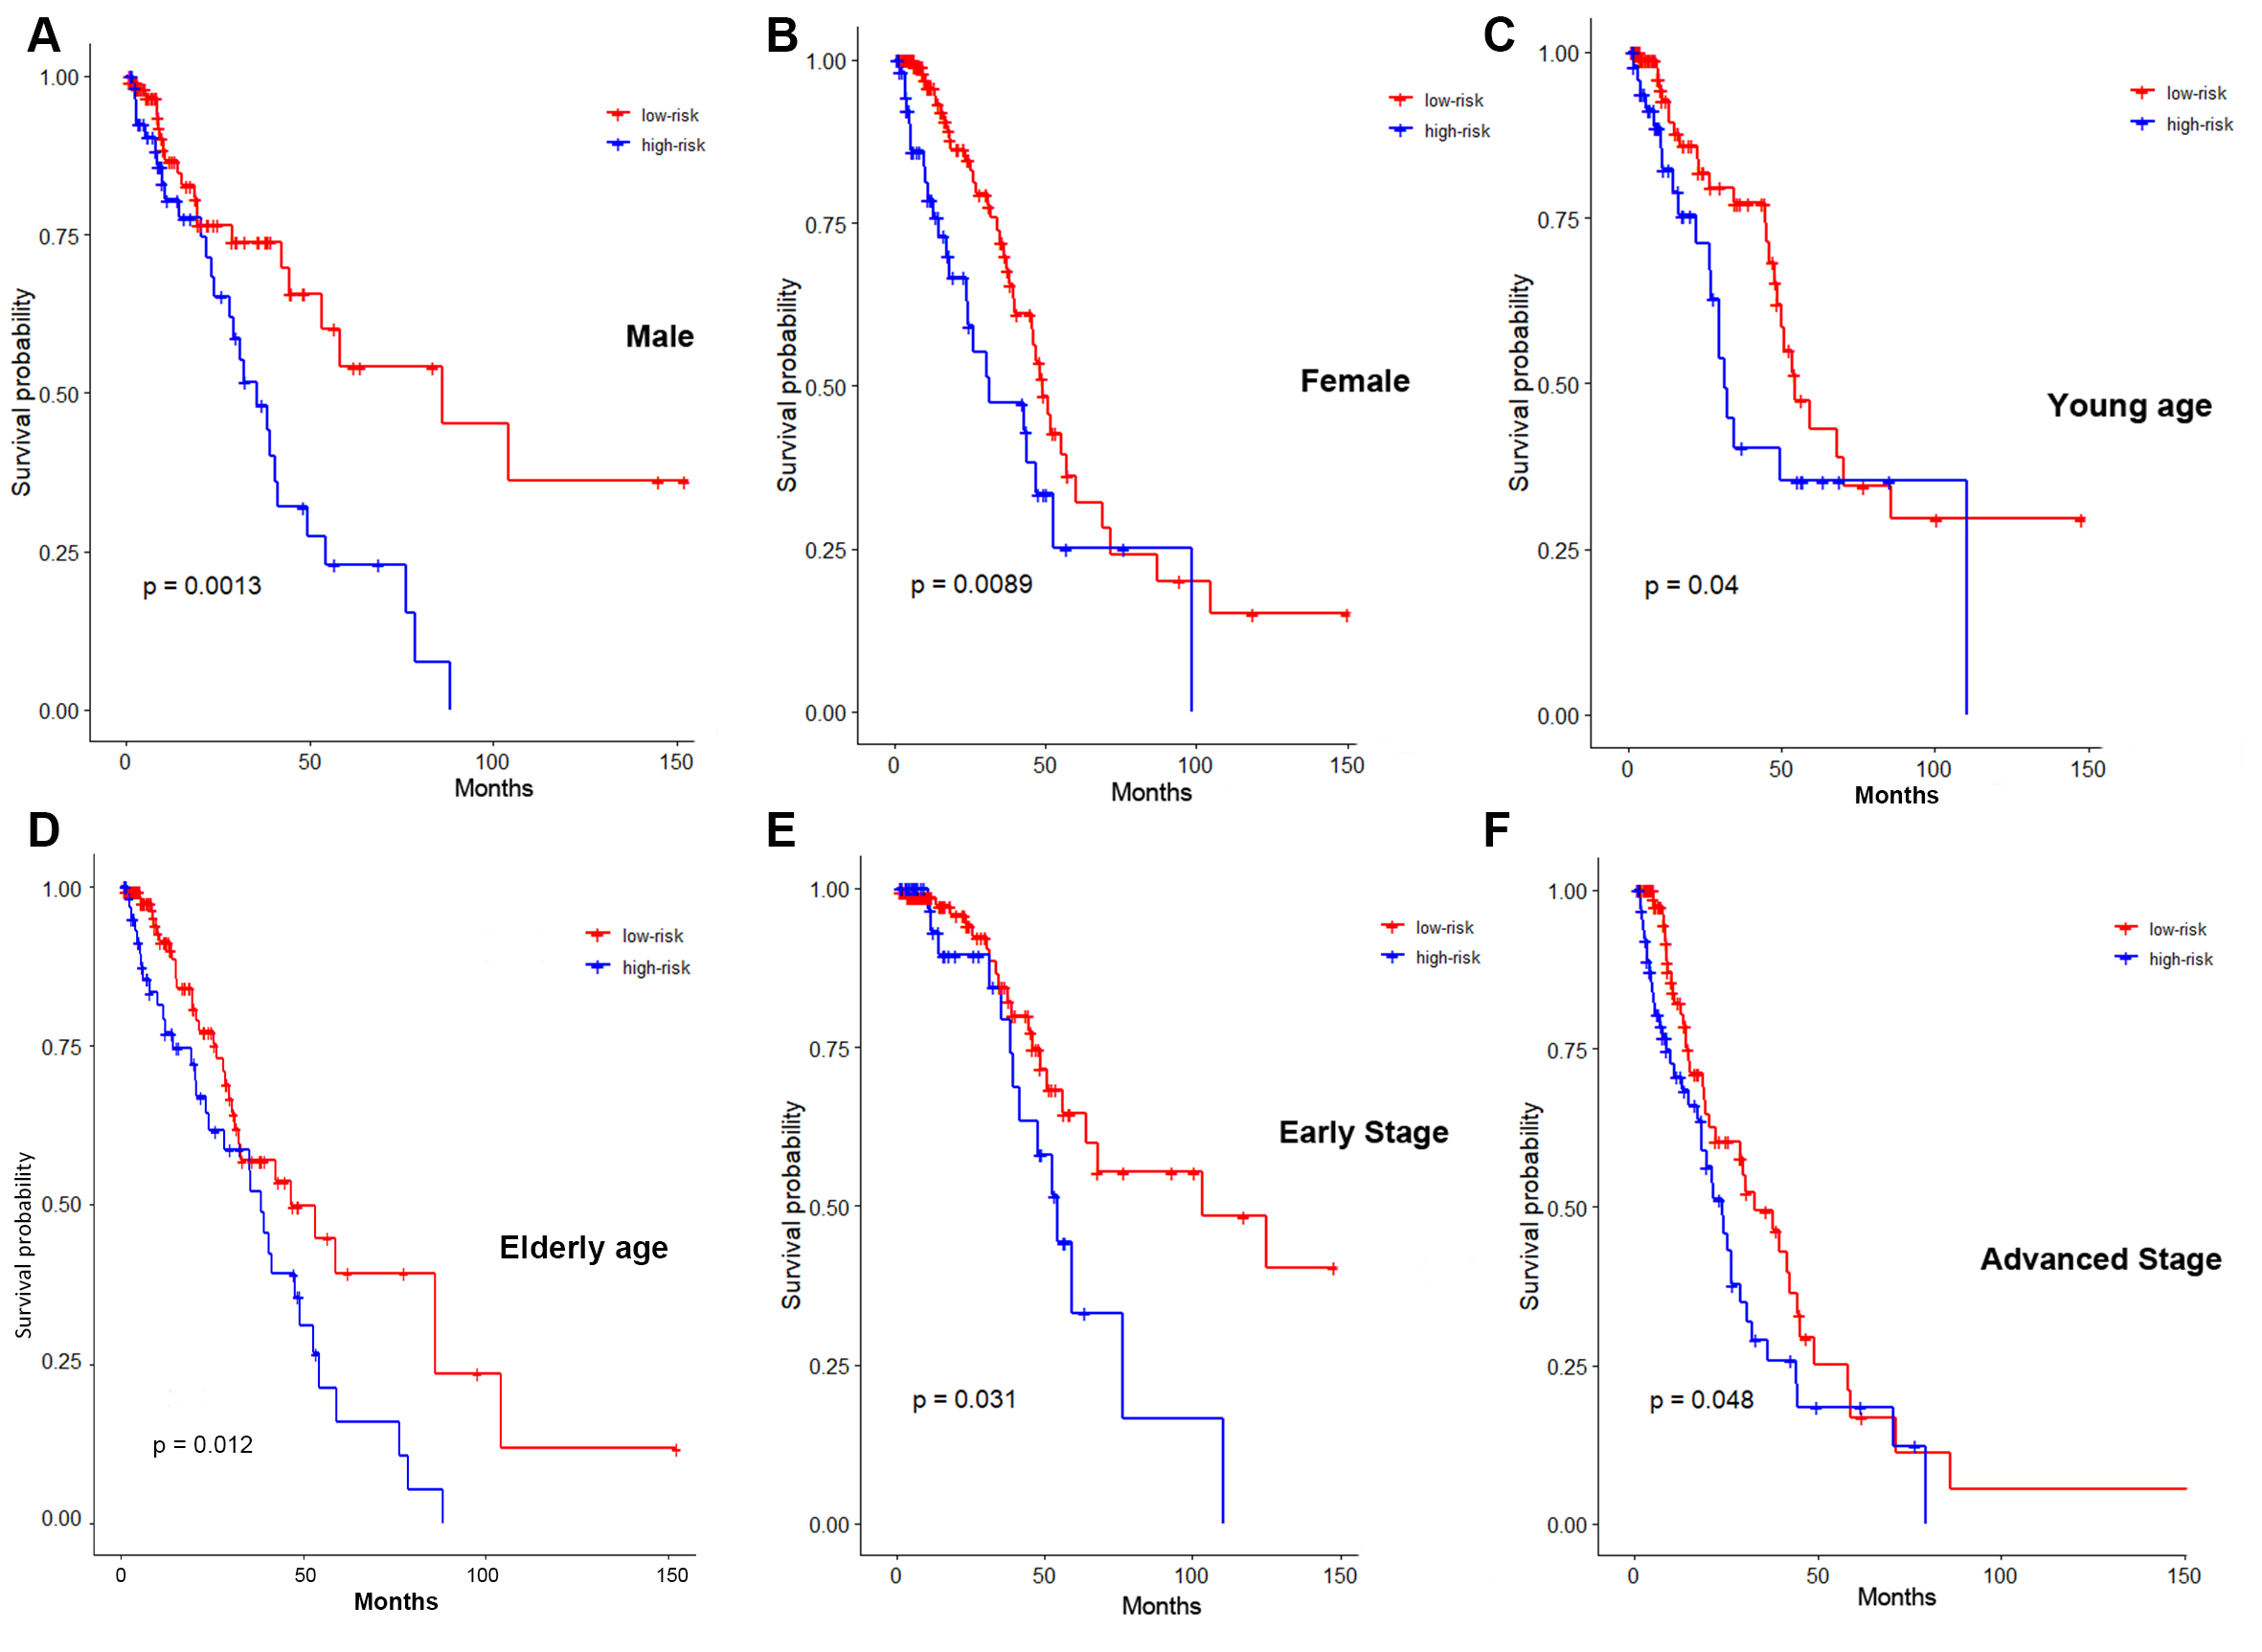
Multiple clinical factors have a significant impact on the survival of patients with LUAD. The stratification analysis of the B-lineage-associated risk signature in several clinical subgroups was performed to verify that the B-lineage-associated risk signature was independently involved in predicting prognosis, without being manipulated by any clinical subgroup. The Kaplan–Meier survival analysis between high-risk and low-risk groups in these subgroups illustrated that risk signature was still a robust and independent marker for predicting OS in patients with different sexes (Fig. S2A and S2B), different ages (Fig. S2C and S2D), and different TNM stages (Fig. S2E and S2F).
3.5 Difference in immune status and immunotherapy benefits between high-risk and low-risk patients
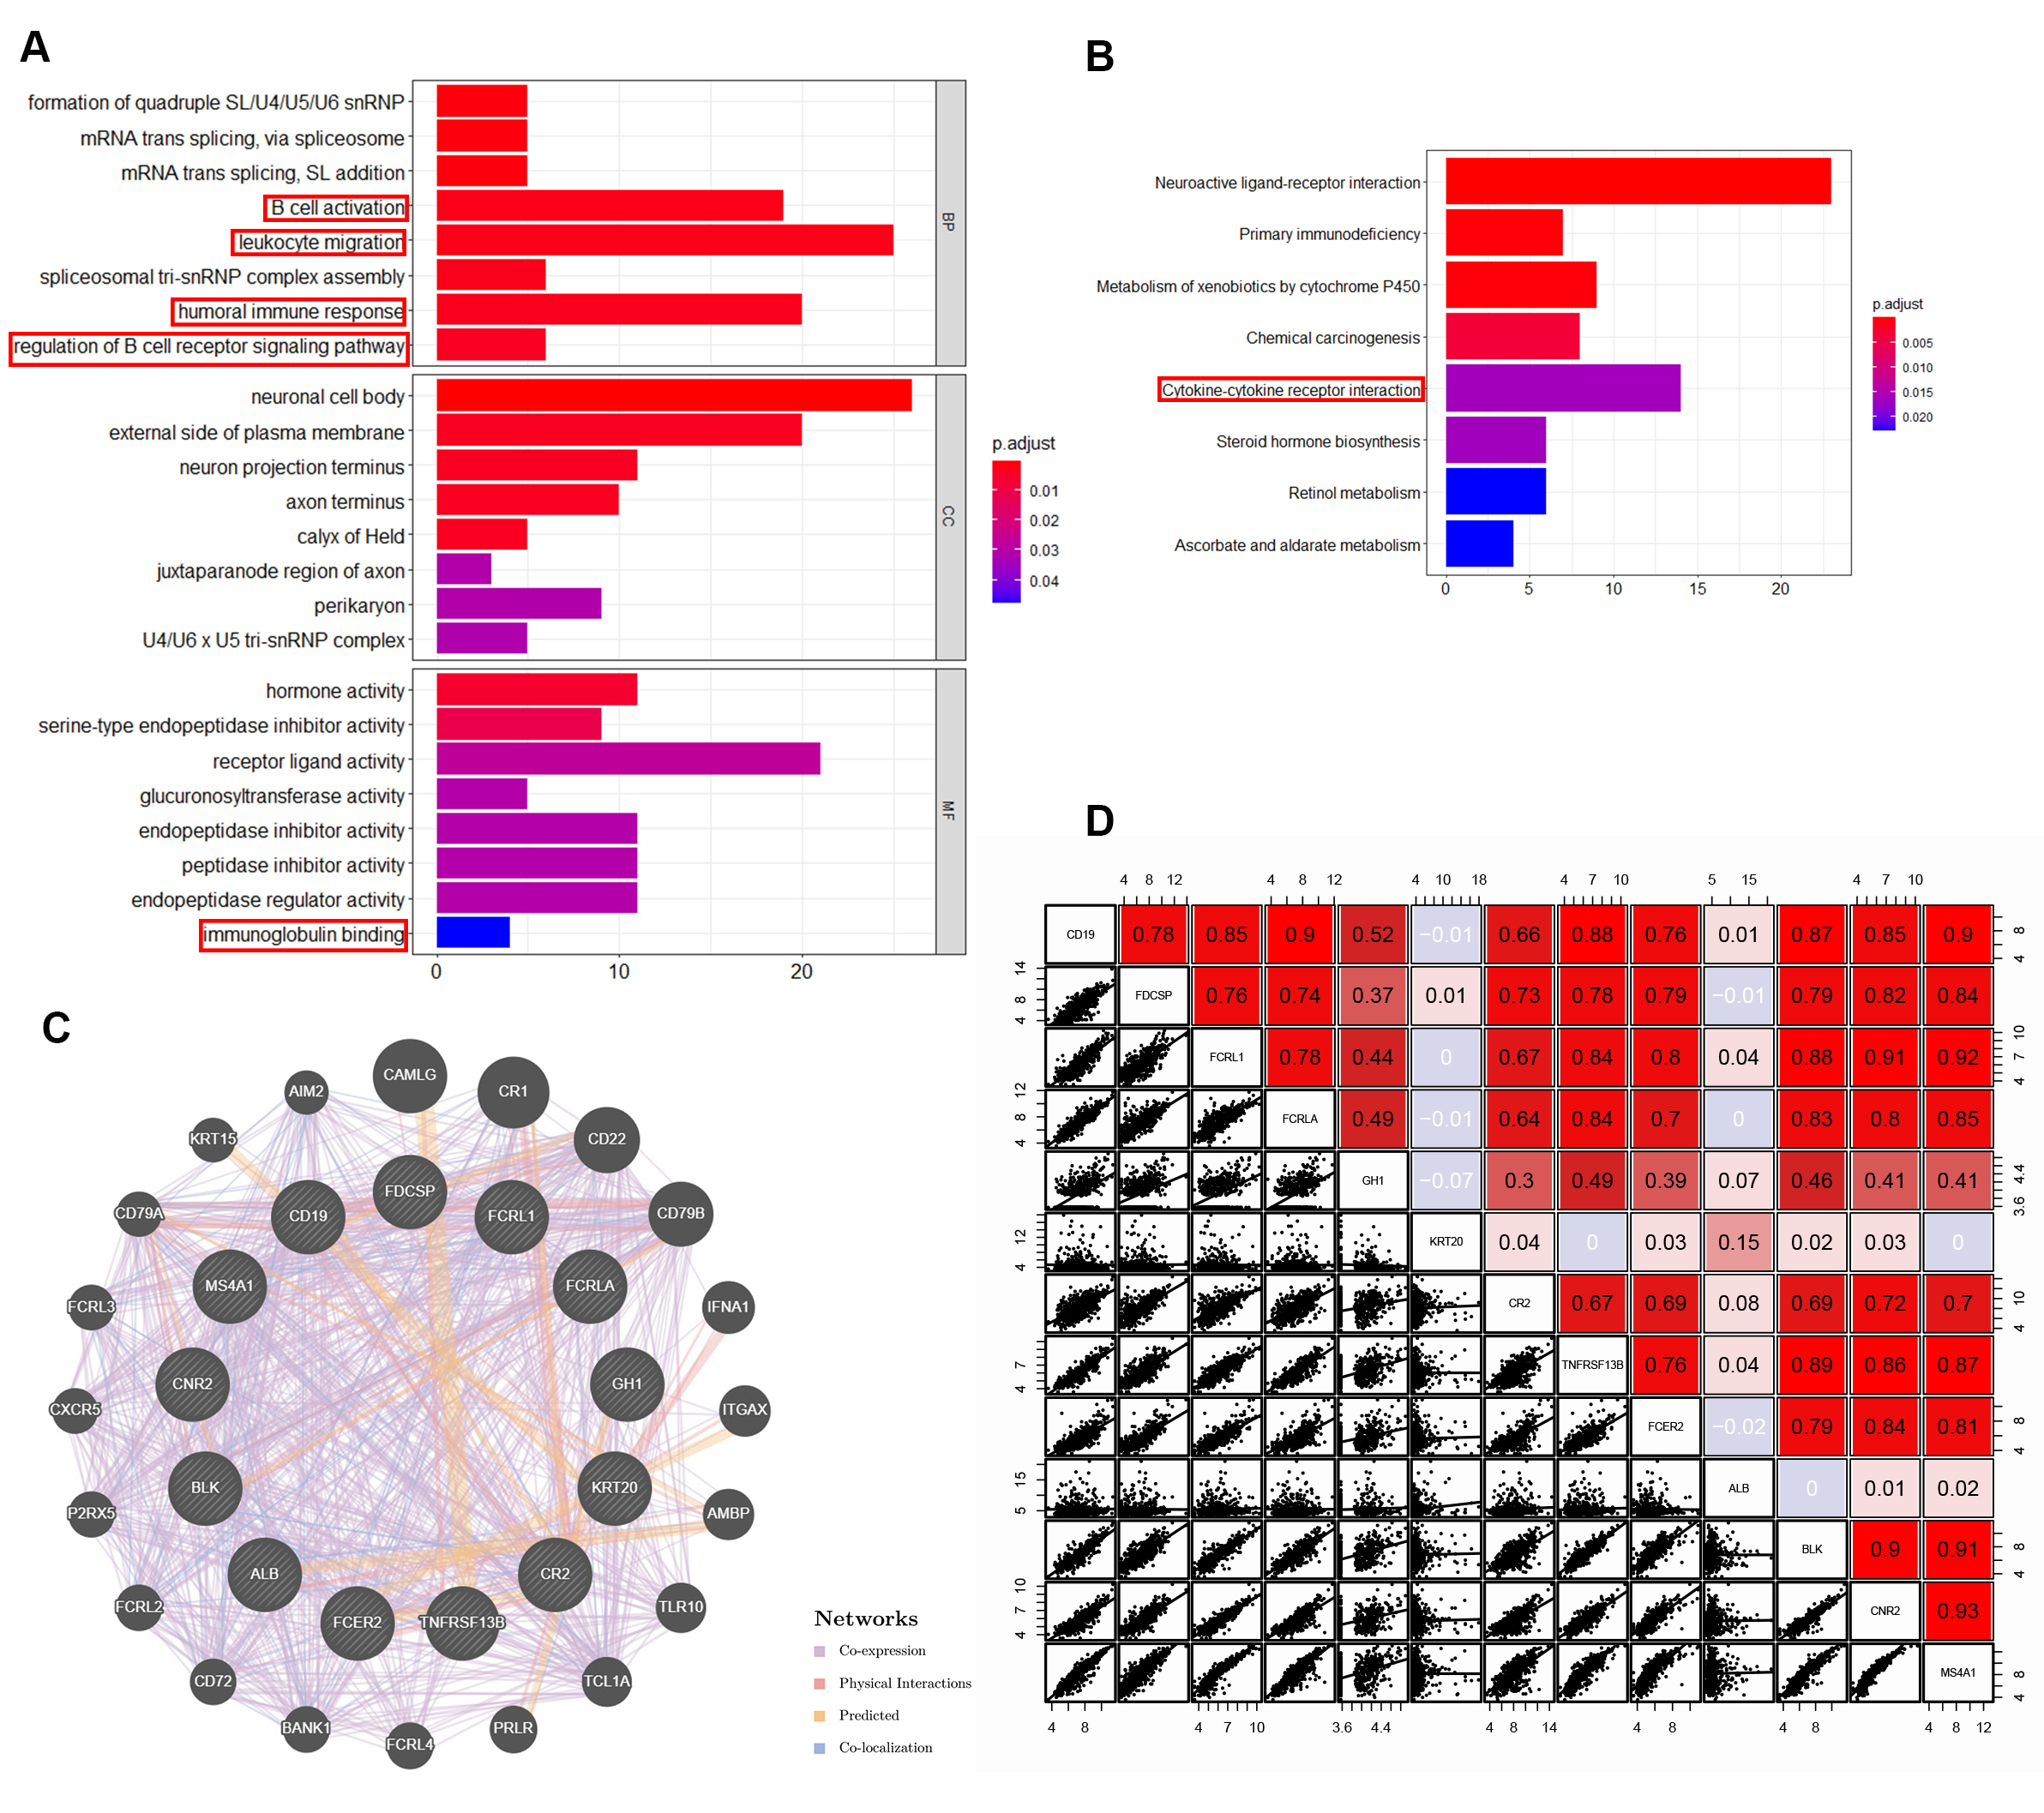
Gene Ontology (GO) and Kyoto Encyclopedia of Genes and Genomes (KEGG) analyses of differently expressed genes were performed to further explore the pathways of statistically differently expressed genes between patients with low expression of B lineage and patients with high expression of B lineage and also understand the potential biological processes affecting the prognosis of patients (absolute value of logFC > 1.5, P value < 0.01, 1057 genes, Fig. S3A and S3B). The GO analysis comprised enriched biological processes, cellular components, and molecular function. These genes were enriched in several immune-related biological processes, including B-cell activation, leukocyte migration, humoral immune response, and regulation of B-cell receptor signaling pathway. In molecular function, these genes were enriched in immunoglobulin binding. The KEGG analysis reflected that these genes were enriched in cytokine–cytokine receptor interaction. These results indicated that differently expressed genes between patients with low expression of B lineage and patients with high expression of B lineage were related to the tumor immune process, suggesting that tumors evade immune surveillance and cause different clinical outcomes due to differences in immune cell activation in the TME and differences in antigen presentation and signal transduction,. Moreover, GeneMANIA online tool was used to observe the interaction of 13 risk signature–related genes (Fig. S3C). The result reflected that these genes were co-expressed and had close physical interactions. In addition, these genes had close relationship with several chemokine-related genes and B-cell surface marker–related genes. Moreover, we got consist result in the correlationship of 13 risk signature–related genes expression, which revealed a extensive co-regulation relationship (Fig. S3D). This finding suggested that these genes might have originated from the same underlying structure and might affect the B-cell activation and antigen presentation process, thereby affecting the prognosis of patients with LUAD.
Recent studies have shown that the difference between the TME and immune cell infiltration can significantly change the recognition of tumor antigens, presentation of signals, and killing of tumor cells by the patient immune system. The expression of immune cell markers was detected to examine the relative abundance of tumor suppressor immune cell subpopulations in the TME between high-risk and low-risk groups. The tSNE plot revealed that two groups of patients in the TCGA cohort were divided into two different principal component clusters based on mRNA expression (Fig. 3A). The expression levels of MS4A1 (encoding CD20, marker of B cells, Fig. 3B), IGHG1 (marker of plasma cells, Fig. 3C), and CD19 (encoding CD19, marker of B cells, Fig. 3D) were significantly high in the low-risk groups, indicating higher abundance of the tumor suppressor B lineages. The expression levels of CD8A (encoding CD8, marker of CD8 + T cells, Fig. 3E), CD4 (encoding CD4, marker of CD4 + T cells, Fig. 3F), and CD3D (encoding CD3, marker of T cells, Fig. 3G) were also significantly high in the low-risk groups, indicating higher abundance of the tumor suppressor T-cell subpopulation.
Meanwhile, immune checkpoints inhibitors have been shown to exert antitumor effects by reversing tumor-immunosuppressive effects. The present study further investigated the relationship between the B-lineage-associated risk signature and the expression of immune checkpoints, including CTLA4, TIGIT, PDCD1, TIM3, and LAG3 (Fig. 3H–3L). These results showed that these immune checkpoints were highly expressed in low-risk patients. In addition, patients were divided into high-risk and low-risk groups by qRT-PCR in 16 patients with LUAD from Jiangsu Cancer Hospital (The primers shown in Table S4). Immunohistochemical analysis was performed on the surface proteins of the immune cells and important immune checkpoints on paraffin-embedded pathological sections of these patients, including CD20, CD19, CD8, CD4, CD3, and PD1 (Fig. 4A). Consistent results were obtained at the protein and RNA levels(Fig. 4B). Moreover, We continue to explore whether immunotherapy can benefit in the "immune activation" low-risk group. Unsurprisingly, B-lineage-associated risk signature and immunotherapy benefit showed a correlation trend (Fig. 4C) in GSE135222. These results indicated that high-risk and low-risk groups distinguished by the B-lineage-associated risk signature had different immune activation and efficiency of immune checkpoints axis, leading to different benefit from immunotherapy.
3.6 Construction and validation of a nomogram based on the B-lineage-associated risk signature
The predictive ability of the B-lineage-associated risk signature for prognosis was evaluated through univariate Cox regression analysis (P value < 0.05). Then, multivariate Cox regression was used to evaluate the B-lineage-associated risk signature score and several other clinical data, including TNM stage, lymph node invasion and age, as independent prognostic factors (P value < 0.05, Fig. 5A). A nomogram that integrated the B-lineage-associated risk signature and other independent clinical factors (lymphatic invasion, age, and TNM staging) was constructed to provide clinicians with a quantitative approach to predict the prognosis of patients with LUAD (Fig. 5B). Time-dependent ROC curve analysis was used to compare the predictive accuracy between the nomogram, B-lineage-associated risk signature, age, and TNM stage in 1, 2, 5, and 7 years (Fig. 5C–5F). The nomogram model suggested higher prognostic accuracy for 1-, 2-, 5-, and 7-year OS with a larger AUC.