Thirty-four GH3-encoding genes (BoGH3s) are present in B. oleracea var. oleracea
In the Ensembl Plants database (http://plants.ensembl.org/index.html), protein sequences of 55 GH3 candidate genes in kale-type B. oleracea showed similarities to the 19 Arabidopsis GH3 proteins [10]. Among these, 34 GH3 proteins were found to have intact GH3 domains (pfam03321) and considered as GH3 proteins (Table S1; Figure S1). Although identical genomic sequences were used for annotation, only 30 B. oleracea GH3 candidate proteins, including two with truncations in GH3 domains, were found to have significant similarities to Arabidopsis GH3s in NCBI database (NCBI, http://ncbi.nlm.nih.gov) [34]. The 34 BoGH3 proteins with the intact GH3 domains in Ensembl Plants database include all 28 putative GH3 proteins with the intact GH3 domains identified in NCBI database (Table S1). For proteins showing different protein sequences between two databases, such as BoGH3.12-2 and BoGH3.17-1, NCBI protein models were adopted in our study because they are supported by RNA-seq data in NCBI. While 34 GH3 protein-coding genes were identified from B. oleracea var. oleracea in our study, 25 and 29 GH3 protein-coding genes were previously reported for cabbage-type B. oleracea var. capitata in the comparison with B. napus genes by two independent studies, respectively [32,33].
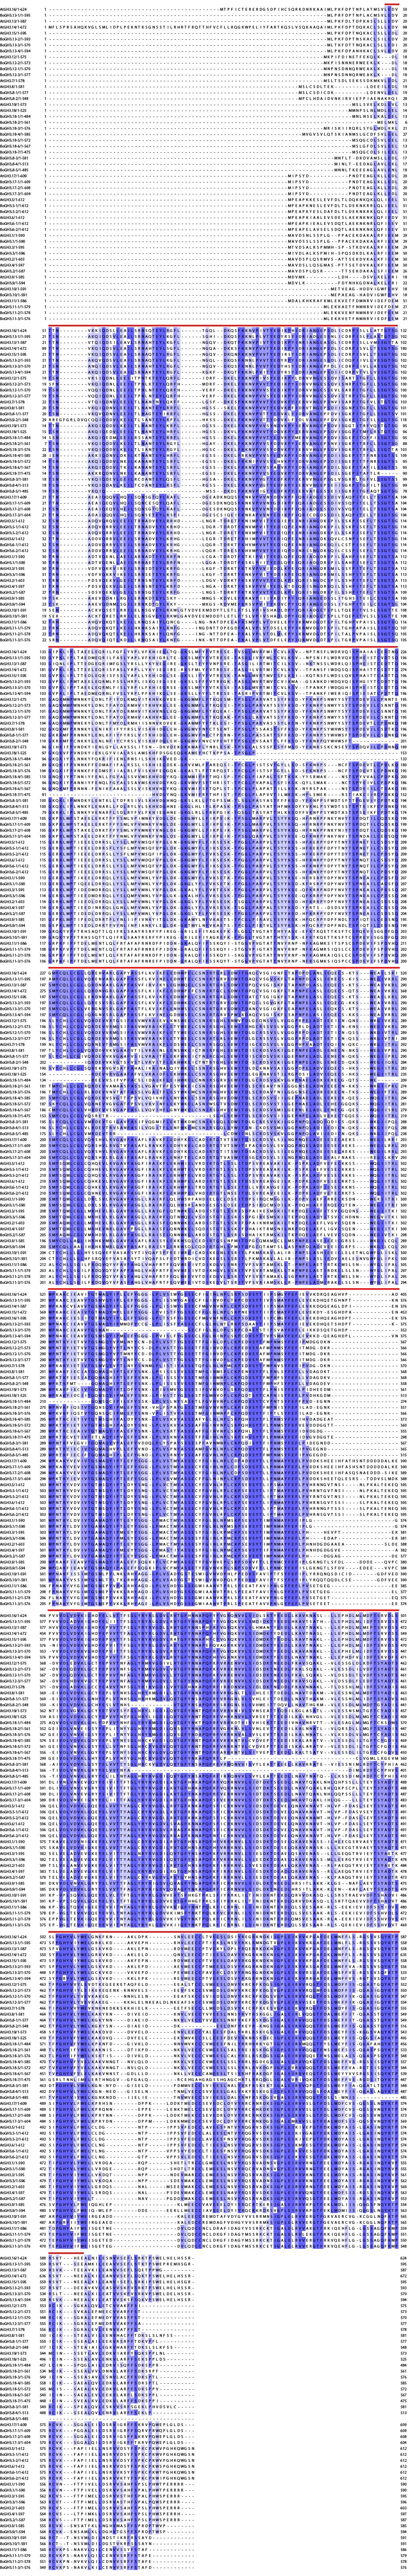
Similar to previous phylogenetic analyses of GH3 proteins including cabbage-type B. oleracea var. capitata, phylogenetic clustering of Arabidopsis and BoGH3 proteins demonstrated that BoGH3 proteins can be divided into three groups (Group Ⅰ, Ⅱ, and Ⅲ) (Figure 1A) [6,10,32,33]. It was found that Group Ⅰ consists of two Arabidopsis and four BoGH3 proteins, while Group Ⅱ consists of eight Arabidopsis and 11 BoGH3 proteins. In the case of Group Ⅲ, nine Arabidopsis GH3s and 19 BoGH3 proteins were clustered together. In general, exon/intron structures of BoGH3 genes were same to closely related counterparts in Arabidopsis with some exceptions (Figure 1B). For example, four protein-coding exons were detected for BoGH3.1 in Group Ⅱ, based on the distribution of RNA-seq reads in NCBI database, while three protein-coding exons of AtGH3.1 is reported in TAIR JBrowse (https://jbrowse.arabidopsis.org/). In case of BoGH3.11-2 and BoGH3.11-3, which are closely related to AtGH3.11 (JAR1) with four protein-coding exons, only three exons supported by RNA-seq reads were observed. Structural differences were also observed for five BoGH3 genes (BoGH3.8-2, BoGH3.8-5, BoGH3.13-3, BoGH3.18-1, and BoGH3.18-7) that were identified only in Ensembl Plants.
Synteny is observed for Group III subgroup 6 GH3 genes between Arabidopsis and B. oleracea var. oleracea
In B. oleracea var. oleracea, 4 out of 34 Group Ⅲ BoGH3 proteins (BoGH3.13-1, BoGH3.13-2, BoGH3.13-3, and BoGH3.13-4) show a close relationship with Arabidopsis subgroup 6 GH3 proteins (Figure 1A). While the four BoGH3 genes are found on different chromosomes, four Arabidopsis GH3 genes (AtGH3.13, AtGH3.14, AtGH3.15, and AtGH3.16) in the same subgroup are located within 15,000 bp genomic region on Arabidopsis chromosome 5 (Figure 2A). When genes located around Arabidopsis and B. oleracea var. oleracea subgroup 6 GH3 genes were compared, syntenies were detected around the AtGH3.13 ~ AtGH3.16 cluster and three BoGH3 genes (BoGH3.13-1, BoGH3.13-2, and BoGH3.13-4) (Figure 2B-2D). In the upstream of three BoGH3 genes, Bo2g011200 (Figure 2B), Bo3g009120 (Figure 2C), and Bo9g167820 (Figure 2D) showing sequence similarities to At5g13330, an RAP2.6L transcription factor found upstream of the AtGH3.13 ~ AtGH3.16 cluster, were identified (Figure 2A). Moreover, BoGH3.12-1, BoGH3.12-2, and BoGH3.12-3, which are clustered with AtGH3.12 (PBS3) in the phyologenetic tree as Group Ⅲ subgroup 4 GH3 genes, were also found further upstream, same to AtGH3.12 (PBS3) located upstream of the AtGH3.13 ~ AtGH3.16 cluster. Consistent with the syntenic relationships in these genomic regions, sequence similarities were also observed downstream of the Arabidopsis GH3 cluster and the three BoGH3 genes on different chromosomes (Figure 2B – 2D): Bo2g011240 and Bo9g166790 show sequence similarity to At5g13390, No Exine Formation 1. In addition to six subgroup 4 and subgroup 6 BoGH3 genes showing synteny (Figure 2B – 2D), analyses for remaining 28 BoGH3 genes revealed that 15 more BoGH3 genes have syntenic relationships with AtGH3 genes (Figure 2E).
Subgroup 6 BoGH3 genes are not induced by auxin treatment in the seedling stage
In Arabidopsis, auxin treatment can induce transcription of some GH3 genes, such as AtGH3.2 (YDK1), AtGH3.5 (WES1), and AtGH3.6 (DFL1) [15-17]. However, expression conditions and functions of GH3 genes in other plants are largely unknown. To gain insights on the expression patterns and functions of four B. oleracea var. oleracea subgroup 6 GH3 identified in this study, we determined whether these genes can be induced by plant hormones and found that none of subgroup 6 BoGH3 genes were significantly induced by auxin (synthetic 2,4-Dichlorophenoxy acetic acid (2,4-D) or natural IAA), GA or JA treatment at the seedling stage, except BoGH3.13-2 that is weakly induced by JA (Figure 3). One of subgroup 4 BoGH3 gene, BoGH3.12-1, also did not show expression changes responding to hormone treatments. In contrast, transcriptional inductions by auxin were evident for BoGH3 genes included as positive controls (BoGH3.2 and BoGH3.5-1), which are closely related auxin-inducible Arabidopsis GH3 genes [16,17].
BoGH3.13-1 is strongly expressed in stamen at a specific stage during flower development
For four subgroup 6 and two auxin-inducible GH3 genes in B. oleracea var. oleracea, relative expression patterns in six different organs - root, leaf, stem, floral bud, opened flower, and silique - were determined. Among four subgroup 6 BoGH3 genes, BoGH3.13-1 was found to be most strongly expressed in floral bud, although significant expression was also observed in silique compared to that in leaf (Figure 4A). Only negligible expressions of BoGH3.13-1 were detected in other organs, including open flowers. For the other three subgroup 6 BoGH3 genes, the strongest expression was commonly found in siliques (Figure 4B-4D), while comparable expressions in floral bud and open flower were also observed for BoGH3.13-2 (Figure 4B). For auxin-inducible BoGH3.2 and BoGH3.5-1, which were included as comparison, distinct relative expression patterns were detected: BoGH3.2 and BoGH3.5-1 were found to be most strongly expressed in root and floral bud, respectively (Figure 4E & 4F). For three subgroup 4 BoGH3 genes, stronger expressions were commonly observed in roots (Figure S2).
For BoGH3.13-1 and BoGH3.5-1, which show strong preferential expressions in floral bud (Figure 4A & 4F), it was also determined whether expressions of these genes are temporally regulated during floral bud development. When the expression levels were monitored for developing floral buds sorted by lengths (Figure S3), which reflect the progress of flower development [44], both genes showed stronger expression when bud lengths are about 2 to 6 mm, although BoGH3.13-1 in subgroup 6 GH3 showed more dramatic expression changes by developmental progress than BoGH3.5-1 (Figure 5A & 5B). In 4 ~ 6 mm-long floral buds, where the two genes are most strongly expressed, almost exclusive expression was detected in stamen among sepal, petal, stamen, and pistils (Figure 5D & 5E). In contrast, no significant developmental and organ-specific expression differences were observed for BoGH3.13-2, another subgroup 6 BoGH3 that are constitutively expressed in floral buds, open flowers, and siliques (Figure 4B, 5C & 5F).
BoGH3.13-1 and BoGH3.5-1 are expressed in tapetum and pollen grains
To narrow down spatial expression patterns of stamen-expressed BoGH3.13-1 and BoGH3.5-1, we generated transgenic plants, in which GUS (β-glucuronidase) reporter genes are expressed under the control of about 1,500 bp putative promoter sequences of these BoGH3 genes. BoGH3.13-1 (-1489 ~ -1)::GUS and BoGH3.5-1 (-1496 ~ -1)::GUS are two transgenic plants, in which -1489 ~ -1 and -1496 ~ -1 bp DNA sequences upstream of BoGH3.13-1 and BoGH3.5-1 start codon, respectively, are fused to GUS reporter genes. In BoGH3.13-1 (-1489 ~ -1)::GUS, GUS expression was observed in anthers of developing floral buds (Figure 6F & 6G), consistent with the qRT-PCR (quantitative reverse transcription polymerase chain reaction) results (Figure 4 & 5). Weak GUS stainings in some stigmas were found to be caused by stigma-attached pollens (Figure 6H). GUS staining was also observed in siliques, but only in the floral organ abscission regions of petals, sepals, and stamens (Figure 6I & 6J). In addition, GUS expression was detected in leaf primordia of BoGH3.13-1 (-1489 ~ -1)::GUS seedlings (Figure 6K & 6L). In BoGH3.5-1 (-1496 ~ -1)::GUS, GUS expression was detected in developing anthers and unfertilized ovule or aborted seeds (Figure 6M - 6Q), but not in seedling leaf primordia (Figure 6R). To further define the spatial expression patterns of BoGH3.13-1 and BoGH3.5-1 in anther, cross-sectioned floral buds were examined and specific expression in tapetum cells and pollen grains were detected for both genes (Figure 6U - 6X). In BoGH3.13-1 (-1489 ~ -1)::GUS, GUS staining seems to appear in the tapetum first and pollens later (Figure 6U & 6V).
BoGH3.13-1 and BoGH3.5-1 are most strongly expressed around when polarized microspores are generated
To investigate which milestone events in microsprogenesis or microgametogenesis occur in pollens when BoGH3.13-1 and BoGH3.5-1 are expressed (Figure 5), developing pollens were collected from floral buds and open flowers. Based on the numbers and organization of 4’,6-diamidino-2-phenylindole (DAPI)-stained nuclei, it was found that tetrads and microspores are observed in less than 2 ㎜ floral buds (Figure 7A & 7D), in which the two anther-expressed GH3 genes, BoGH3.13-1 and BoGH3.5-1, are weakly expressed (Figure 5). In 2 ~ 6 ㎜ floral buds, in which the two anther-expressed GH3 genes are most strongly expressed, microspores, polarized microspores, and bicellular pollens were observed (Figure 7B - 7C & 7E - 7F). While bicellular and tricellular pollens were observed in 6 ~ 8 ㎜ buds, only tricellular pollens were observed in 8 ~ 10 ㎜ buds and opened flowers (Figure 7G - 7L). These data show that BoGH3.13-1 and BoGH3.5-1 are strongly induced when polarized microspores are mainly produced during early microgametogenesis [45,46].
One hundred eighty-six bp region upstream of BoGH3.13-1 is sufficient for anther-specific expression
DNA sequences responsible for tissue-specific expression of BoGH3.13-1 was investigated with different DNA regions upstream of the start codon (Figure 8A). When P1, in which -1017 ~ -1 bp region was fused upstream of GUS reporter gene, was used to generate P1 transgenic plants, GUS expressions in anthers and pollens were still detected (Figure 8B - 8D), but those in floral abscission zones and leaf primordia were lost, except one case showing GUS staining in the floral abscission zone (Figure 8E & 8F). When P2 (-418 ~ -1) and P3 (-340 ~ -155), without -155 ~ -1 bp putative 5’ untranslated region based on RNA-seq reads in SRX209697 (NCBI), were used, anther-specific GUS expressions were found to be maintained (Figure 8G & 8H). While P4 (-278~ -155) did not show GUS expression in all twelve lines, five out of twelve P5 (-418 ~279) showed GUS expression, suggesting sixty-two bp region (-340 ~ -279) in P3 sequence is important for anther-specific expression of BoGH3.13-1 (Figure 8I & 8J).