This exploratory observational study enrolled a total of n = 157 adult Caucasian COVID-19 convalescent patients, who were followed-up in an out-patient setting. Patient-age ranged from 20 to 80 years (mean age 44 years) with a balanced distribution of female (n = 79) versus male (n = 78) patients. Study participants had suffered and recovered from mild to moderate COVID-19 disease, whereby approximately 38% of patients had experienced mild (WHO° 1 and 2a) and 52% moderate COVID-19 disease (WHO° 2b and 3). Patients who had experienced mild disease tended to be younger (age range 19.7–79.5 years, mean 41.2 years, median 38.3 years) than patients experiencing moderate disease (age range 20.7–66.5 years, mean 45.2 years, median 49.6 years, p < 0.028). No other notable differences in terms of demographic characteristics, comorbidities or concomitant medications were observed between cohorts recovered from different severity grades of COVID-19. This statement applies to all sub-group analyses reported here, unless specifically noted otherwise.
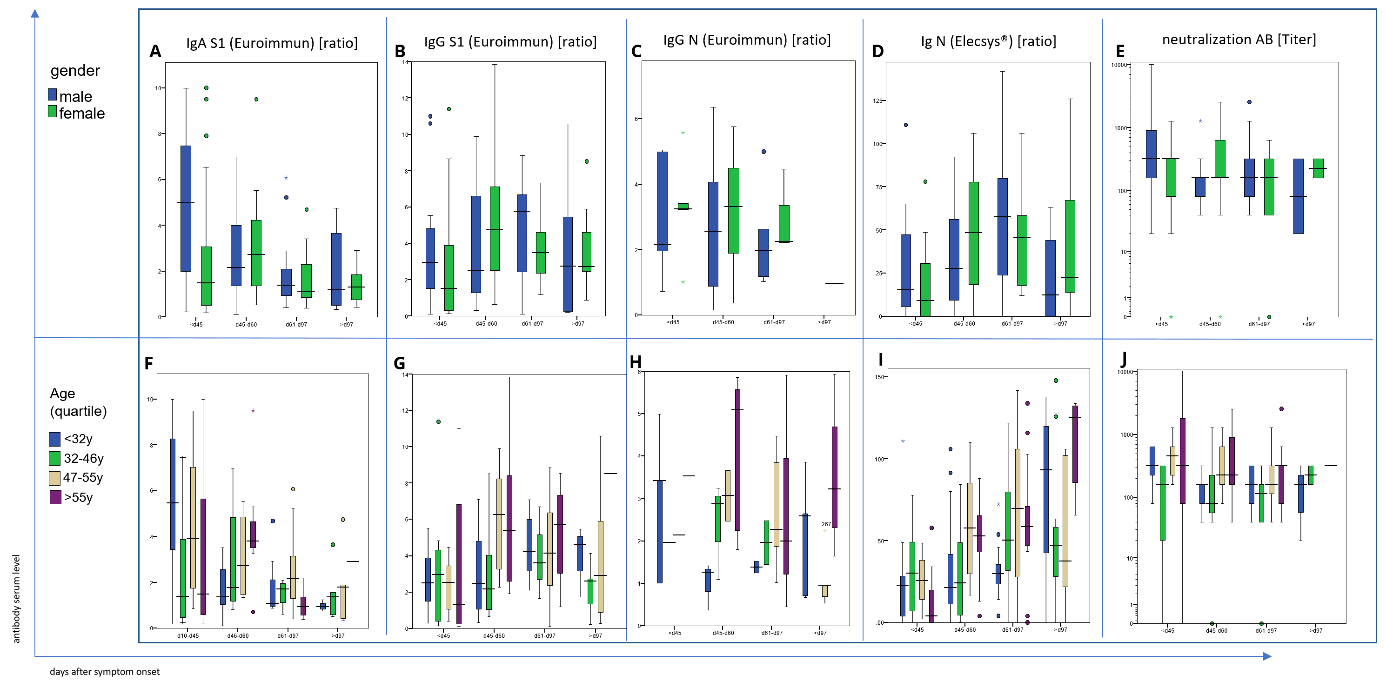
In this convalescent patient cohort, S1-specific IgA antibody levels were barely detectable (ratio < 0.8) or low (ratio 0.8-1.0) in 41 of the 130 tested individuals yet markedly elevated (ratio ≥ 1.1) in the remaining 89 patients. IgA antibody levels were lower in blood samples taken later than 32 days following the end of symptoms (Fig. 1a). These IgA antibody kinetics are principally in line with earlier longitudinal analyses of IgA responses against SARS-CoV-2 antigens 18,19. No apparent correlation between IgA antibody titers and severity of disease was observed in our study population as a whole (Fig. 1a).
S1- (Fig. 1b) and N- (Fig. 1c) specific IgG antibody levels were scattered over a large concentration range over the whole study period. However, in contrast to anti-S IgA levels anti-S IgG titers were higher in individuals with more severe disease (Fig. 1b and Fig. 1d), in accordance with findings reported before19–21. Throughout the study observation period of up to 240 days after the end of symptoms, IgG antibody levels tended to be stable or even elevated in 29 of the 42 subjects tested, whereas they decreased in the remaining 13 subjects (Fig. 2b, c). In all patients in whom elevated antiviral IgG antibodies had been observed at earlier time-points, the respective anti-S IgG antibodies remained detectable at the last observation recorded.
Of note, 81 of 118 samples analyzed in this study (68.6%) neutralized virus at the prospectively defined minimum threshold titer or higher. This proportion of samples exhibiting relevant virus neutralizing capacity is in line with results of a previous study in a similar cohort of convalescent COVID-19 patients 16. Supplementary Fig. 5 displays the correlation between neutralizing antibody titers and anti-S IgG levels. While a certain level of correlation between the two parameters is found (R2 = 0.299.), the wide interindividual scatter allows for the conclusion that total anti-S IgG levels are not adequately predictive of virus neutralizing capacity. Thus, at the individual patient level, total ELISA determined anti-S IgG levels do not permit to reliably discern high or low levels of neutralizing anti-S IgG antibodies.
Sensitivity analyses for patients’ gender and patients’ age did not identify any statistically significant and clinically meaningful differences between the respective cohorts, neither in regard to antiviral antibody titers nor their kinetics (Suppl Fig. 1). For a potential exception, a consistent trend in younger patients (< 32 years of age) towards lower antiviral antibody titers compared to older patients was noted, potentially indicative of a more prominent role of adaptive T-cell mediated rather than humoral antiviral immune responses in younger patients and/or anti-S IgG antibody epitope specificities of higher protective capacity yet the trend was not highly significant. The trend nevertheless affirms that low anti-S antibody titers cannot be readily interpreted as lack of antiviral protection, specifically when observed in younger patients. This interpretation was supported by the distribution of antiviral sero-negative patients across age groups.
Next, we analyzed the impact of the CCR5 delta 32 mutation on COVID-19 morbidity and the humoral antiviral immune response in 126 of the 157 individuals. The median concentrations of S1-specific IgA antibodies and of N-specific IgG antibodies were significantly (p < 0.01 and p < 0.042, respectively) lower (Fig. 3a) in the 23 heterozygous carriers of the CCR5 delta 32 mutation, as compared to the 103 tested individuals carrying wild type CCR5. However, S1-specific IgG antibody levels did not differ between carriers of the CCR5 delta 32 mutation as compared to carriers of only CCR5 wildtype alleles (Fig. 3a) while duration of disease was prolonged significantly according to univariate analysis (p < 0.04) in the presence of the CCR5 delta 32 mutation (Fig. 3b). Our data do not provide evidence that the heterozygous presence of the CCR5 delta 32 mutation is associated with more severe disease, i.e. we did not find this mutation over-represented in cohorts with more severe disease, with 8 of 23 carriers of the mutation (35%) experiencing mild disease.
Previously, the HLA class II allele DRB1*03:01 has been reported to be associated with a potentially more favorable outcome of SARS-CoV-1 in two Asian populations12–14. In this study, where 119 Caucasian individuals were HLA typed, we also observed that those 20 of them expressing the DRB1*03:01 allele tended to have shorter disease durations. However, the difference did not reach statistical significance (Fig. 4a).
In addition, the HLA class II allele DRB1*01:01 (Fig. 4b) and the HLA class I allele B*35:01 (Fig. 4c), which were expressed in 19 and 15 individuals respectively, were also associated with a significantly shorter disease duration (p < 0.003 and p < 0.014, respectively). The disease duration was even shorter in the six individuals expressing two of the identified “protective” HLA alleles (Fig. 4d). However, 18 of the individuals expressing the DRB1*01:01 allele co-expressed the HLA-DQA1*01:01 DQB1*05:01 allele. Therefore, the association of one or both alleles with disease duration remains to be determined. It is noteworthy that the “protective” HLA alleles share the characteristic of binding a large number of the peptides putatively derived from 9621 SARS-CoV-2 viral proteins at a high cumulative calculated HLA-allele affinity score by “in silico” analysis, specifically, the HLA class II alleles22.
DRB1*01:01, DRB1*03:01 and DQA1*01:01 DQB1*05:01 putatively bind 1758, 997 and 837 of the 7903 HLA class II binding peptides presumably derived from the SARS-CoV-2 viral proteins at a cumulative calculated HLA allele affinity score of at least 1422, 1035 and 918, respectively. The HLA class I allele B*35:01 putatively binds 183 of the 3540 HLA class I binding peptides presumably derived from the SARS-CoV-2 viral proteins at a cumulative calculated HLA allele affinity score of at least 46.8.
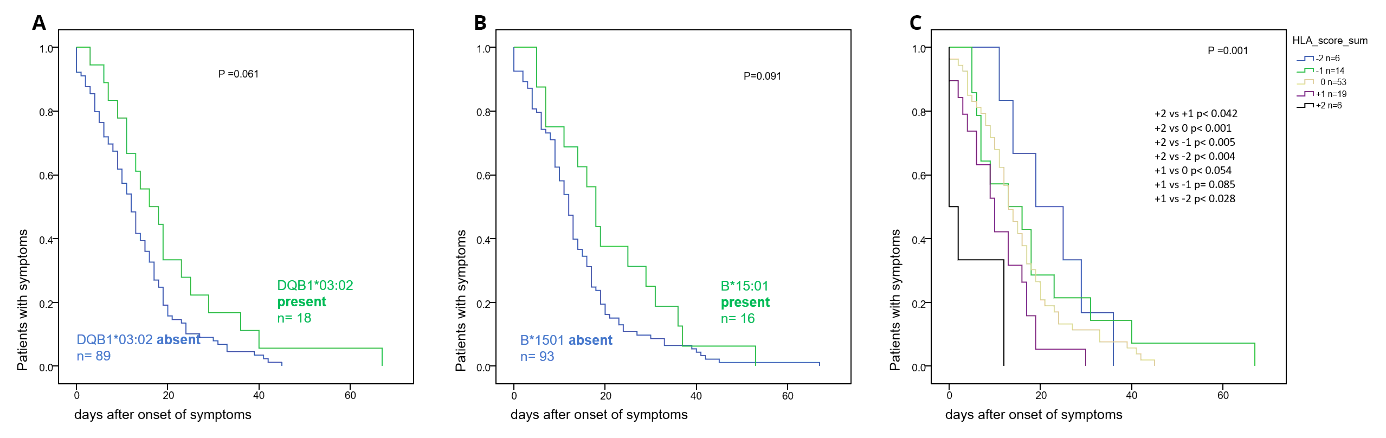
In contrast, the disease durations tended to be longer (p < 0.061 and < 0.095, respectively) in individuals who expressed the HLA class II allele DQB1*03:02 (Suppl Fig. 3a) or the HLA class I allele B*15:01 (Suppl Fig. 3b). The latter two alleles share the characteristic of binding a low number of the peptides derived from the SARS-CoV-2 viral protein at a low cumulative calculated HLA allele affinity score. Specifically, the B*15:01 allele would only bind 75 of the 3540 HLA class I binding SARS-CoV-2 peptides at a cumulatively calculated HLA allele affinity score lower than 21.8. The DQB1*03:02 allele putatively binds 574 of the 7903 HLA class II binding SARS-CoV-2 peptides at a cumulatively calculated HLA-allele affinity score lower than 619.
No significant differences in the titer of neutralizing antibodies (Fig. 5d, i) or in the plasma concentration of S1-specific IgA antibodies (Fig. 5a, f) were found between the groups of individuals expressing the “protective” HLA alleles and of those individuals who did not. In contrast, the plasma concentrations of the S1-specific IgG (Fig. 5b, g) and N-specific (Fig. 4c, h) antibodies were significantly lower in the group of individuals who expressed the “protective” HLA alleles (p < 0.028 - < 0.004, < 0.035 − 0.004 depending on time point after symptom onset, respectively). This finding in conjunction with the lack of difference in the titer of neutralizing antibodies suggests that individuals expressing “protective” HLA alleles produce antibodies with higher avidity.
Blood group antigens are the third category of genetic characteristics analyzed in this study. The blood group A (genotype AA or A0) has been recently shown to be associated with severe disease (WHO° 5–8) 9. Furthermore, AB0 blood group isoagglutinins have been shown to inhibit S-protein- ACE2 interactions 23. In our cohort, the agglutination rate of incompatible blood group erythrocytes was higher in the 40 homozygous 00 individuals and in the 10 homozygous AA individuals than in the 54 heterozygous A0, 13 heterozygous B0 and in the 5 AB individuals.
The 22 AB0 homozygous individuals had a significantly (p < 0.044) shorter disease duration than the 21 heterozygous individuals, when the infection event affected less than 3 individuals (Fig. 6a). AB0 heterozygosity was associated with a higher risk for more severe disease (OR 2.95, 95%CI 1.06 to 8.19, p < 0.046). Interestingly, when 3 or more people were co-infected, the risk for more severe disease tended to increase to a similar extent (“super spreading event” putatively associated with higher virus load) (Fig. 7).
In a Cox regression analysis including the covariates gender, age, the ‘‘protective“ HLA alleles (as defined above), the class I HLA alleles Bw4 and C2 (introduced into this analysis, in addition, as they bind to distinct killer-cell immunoglobulin-like receptors [KIRs] thought to play key roles in the first line innate antiviral immune defense by natural killer-cells 24), heterozygous CCR5 delta 32 mutation, as well as AB0 blood group allele homozygosity, ‘‘protective“ HLA alleles emerged as the strongest predictors of short disease duration (HR 1.5, 95%CI: 1.1–2.1) (Fig. 8a, b, c). In the subgroup of 51 individuals suffering from WHO°1 and WHO°2a (mild) disease, “protective” HLA alleles, absence of CCR5delta 32 mutation and male gender were predictors of shorter disease duration (Fig. 8b).