5.1. Plant materials and treatment
Leafy lettuce (Lactuca sativa L.) GB-30 (bolting resistant, numbered and conserved in our laboratory) was considered as experiment material. The seeds were sown in a sand/soil/peat (1:1:1 v/v) mixture and grown in the Beijing University of Agriculture Experimental Station in Beijing under standard greenhouse conditions (14 h light; 300–1300/mol/(m2 s); 20 ± 2 °C during the day; 13 ± 2 °C at night; 10 h dark; and 50–70% relative humidity). Pest control and water management were performed according to standard practices. When the sixth true leaves were formed, the lettuce plants were moved to a growth chamber under the following conditions: temperature of 20/13 °C (day/night), a 14/10 h photoperiod, and 60% relative humidity for two days of acclimatization. Then, the plants were divided into two groups. The control group was kept under the standard greenhouse conditions as described above. The other group was moved to another growth chamber and treated with high temperatures of 33 and 25 °C during the day and night, respectively. The other environmental conditions were unchanged.
The blossom buds were observed every two days by stereomicroscopy and paraffin-based methods [44] to monitor the progress of flower bud differentiation. The stem lengths (in cm) of the control and treatment plants were measured every four days using a ruler. Simultaneously, stem samples from the control and treatment plants were collected, frozen in liquid nitrogen, and stored at -80 °C for further physiological analysis. On day 8, stem samples from the control and treatment plants were collected, frozen in liquid nitrogen, and stored at -80 °C for further proteome analysis.
5.2. Measurement of Sugar Components
Approximately 0.2 g samples were ground in 10 mL 80% (v/v) ethanol in a tube, and then the tube was placed in a boiling water bath for 1 h, cooled, and centrifuged at 1,000 g for 10 min. The pellet was extracted two additional times with 10 mL 80% (v/v) ethanol. The supernatants from each extraction were combined and evaporated to dryness in a boiling water bath. The samples were resolubilized in 0.5 mL distilled water and filtered through an acetate filter (0.45 µm pore size, Nalgene, Thermo Fisher Scientific, Waltham, MA).
The contents of galactose, glucose, fructose, sucrose were determined using the method of high performance liquid chromatography (HPLC) [45]. The system included a Waters 6000A pump (Millipore, Waters Chromatography Division, Milford, MA), an Inertsil NH2 column (250 mm × 4.6 mm, 5 µm, Dikma Company, Forest Lake, CA) and a Waters 2410 refractive index detector connected to a strip chart recorder. Distilled water, at a flow rate of 10 mL/min, was used as the solvent of the 70% (v/v) acetonitrile. The column temperature was maintained at 35 °C and was preceded by a Waters Bondapak C18/Corasil guard and a set of anion and cation cartridges (deashing guards, Bio-Rad Laboratories, Richmond, CA). All guards were operated at an ambient temperature of 25 °C, and 20 µL samples were injected. The galactose, glucose, fructose, sucrose were identified and quantified from the retention times and the peak heights of stachyose and raffinose standards. All of chemicals were of chromatographical grade in purity. The standards of stachyose and raffinose were purchased from Sigma (St. Louis City, MO).
5.3. Protein Extraction
The samples were extracted using the trichloroacetic acid (TCA)/acetone method as previously described with some modifications. Approximately 2.5 g of each sample was ground into a fine powder in liquid nitrogen. The powder was resuspended in 30 mL of 10% (w/v) trichloroacetic TCA/acetone (65 mM dithiothreitol (DTT)) in a 50-mL tube. The mixture was stored overnight (minimum duration) at -20 °C for precipitation. After centrifugation at 10,000 rpm for 30 min at 4 °C, the supernatant was discarded. Subsequently, 40 mL of pre-cooled acetone was added, and the mixture was centrifuged at 7000 rpm for 15 min. This supernatant was also discarded, and the pellet was washed three times with acetone. Then, 200 µL of lysis buffer (SDT buffer (4% (v/v) SDS, 100 mM Tris-HCl, 1 mM DTT, pH 7.6)) was added to the precipitate, and the mixture was placed on ice for 20 min after ultrasonic treatment for 30 min. After centrifugation at 12,000 rpm for 10 min at 4 °C, the supernatant was extracted. The precipitate was vacuum-dried. The total protein in the supernatant was quantified using the BCA Protein Assay Kit (Bio-Rad, Hercules, CA, USA).
5.4. Protein Digestion and iTRAQ Labelling
Protein digestion was performed according to the FASP procedure described by Wi´sniewski and colleagues[46], and the resulting peptide mixture was labelled using the 8-plex iTRAQ reagent according to the manufacturer’s instructions (Applied Biosystems, Foster City, CA, USA). In brief, each 200-µg protein sample was incorporated into 30 µL of SDT buffer (4% (v/v) SDS, 100 mM DTT, 150 mM Tris-HCl, pH 8.0). The detergent, DTT, and other low-molecular-weight components were removed using UA buffer (8 M urea, 150 mM Tris-HCl, pH 8.0) and repeated ultrafiltration (Microcon units, 30 kDa). Then, 100 µL of 0.05 M iodoacetamide in UA buffer was added to block reduced cysteine residues, and the samples were incubated in the dark for 20 min. The filters were washed three times with 100 µL UA buffer and, subsequently, twice with 100 µL of DS buffer (50 mM triethylammonium bicarbonate at pH 8.5). Finally, the protein suspensions were digested at 37 °C overnight using 2 µg of trypsin (Promega, Madison, WI, USA) in 40 µL of DS buffer, and the resulting peptides were collected as a filtrate. The peptide content was estimated by measuring the UV spectral density at 280 nm using an extinction coefficient of 1.1 for a 0.1% (g/L) solution, which was calculated based on the frequency of tryptophan and tyrosine in vertebrate proteins. For labelling, each iTRAQ reagent was dissolved in 70 µL of ethanol and added to the corresponding peptide mixture. The experiment was performed in three independent biological replicates, each of which consisted of a pool of three plants. The three independent biological replications of the control were labelled (CK1)-113, (CK2)-114, and (CK3)-115, and the three independent biological replications of the treatment were labelled (H1)-116, (H2)-117, and (H3)-118.
5.5. Peptide Fractionation with Strong Cation Exchange (SCX) Chromatography
The iTRAQ-labelled peptides were fractionated by strong cation exchange (SCX) chromatography using an AKTA Purifier system (GE Healthcare, Chicago, IL, USA). The dried peptide mixture was reconstituted and acidified with 2 mL of buffer A (10 mM KH2PO4 in 25% (v/v) acetonitrile (ACN), pH 2.7) and loaded onto a PolySULFOETHYL 4.6 × 100 mm column (5 µm, 200 Å, PolyLC Inc., Columbia, MD, USA). The peptides were eluted with buffer B (500 mM KCl, 10 mM KH2PO4 in 25% (v/v) ACN, pH 2.7) at a flow rate of 1 mL/min with the following gradient: 0–8% buffer B (500 mM KCl, 10 mM KH2PO4 in 25% ACN, pH 3.0) for 22 min, 8–52% buffer B from 22–47 min, 52–100% buffer B from 47–50 min, 100% buffer B from 50–58 min. Then, after 58 min, buffer B was reset to 0%. The elution was monitored by measuring the absorbance at 214 nm, and fractions were collected every minute. The collected fractions were combined into 15 fractions and desalted on C18 cartridges (Empore™ SPE C18 cartridges (standard density), bed inner diameter (I. D.) 7 mm, volume 3 mL; Sigma, St. Louis, MI, USA). Each fraction was concentrated by vacuum centrifugation and reconstituted in 40 µL of 0.1% (v/v) acetic acid. All samples were stored at -80 °C until LC-MS/MS analysis.
5.6. Liquid Chromatography (LC)-Electrospray Ionization (ESI) Tandem Mass Spectrometry (MS/MS) Analysis
Experiments were performed on a Q-Exactive mass spectrometer coupled with an Easy nLC (Proxeon Biosystems, now Thermo Fisher Scientific). Into each fraction, 10 µL was injected for nano LC-MS/MS analysis. The peptide mixture (1–2 µg) was loaded onto a C18 reversed-phase column (Thermo Scientific Easy Column, 10 cm length, 75 µm I. D., 3 µm resin) in buffer A (0.1% (v/v) formic acid) and separated with a linear gradient of buffer B (80% (v/v) acetonitrile and 0.1% (v/v) formic acid) at a flow rate of 250 nL/min, controlled by IntelliFlow technology, for 140 min. MS data were acquired using a data-dependent top 10 method, which dynamically chooses the most abundant precursor ions from the survey scan (300–1800 m/z) for HCD fragmentation. Determination of the target value is based on predictive automatic gain control (pAGC). The dynamic exclusion duration was 60 s. Survey scans were acquired at a resolution of 70,000 at m/z 200, and the resolution for the HCD spectra was set to 17,500 at m/z 200. The normalized collision energy was 30 eV, and the underfill ratio, which specifies the minimum percentage of the target value likely to be reached at the maximum fill time, was defined as 0.1%. The instrument was run with peptide recognition mode enabled.
5.7. Database Search and Protein Quantification
MS/MS spectra were searched using the MASCOT engine (Matrix Science, London, UK; version 2.2) embedded into Proteome Discoverer 1.3 (Thermo Electron, San Jose, CA, USA) against Lactuca.Unigene.pep.fasta (a lettuce protein database translated from the transcriptome, created by our laboratory, which has 53,584 entries in total. The material here was G-B30, which is consistent with the variety studied in this experiment.). For protein identification, the following settings were used: peptide mass tolerance = 20 ppm; MS/MS tolerance = 0.1 Da; enzyme = trypsin; max missed cleavage = 2; fixed modification: carbamidomethyl (C), iTRAQ 8-plex (K), iTRAQ 8-plex (N-term); variable modification: oxidation (M), iTRAQ 8-plex (Y). The false discovery rate (FDR) of protein identification was ≤ 0.01. At least one unique peptide was involved in the identification of every high-confidence protein.
The relative quantification of proteins was based on the signal intensity of the reporter ion, which reflects the relative abundance of the peptide. The protein ratio (fold change) was obtained according to different comparison groups (high-temperature treatment/control) through the ratio of reporter ions labelled with different isotopes as described above. For differentially expressed proteins (DEPs), one can use a protein containing at least two unique spectra, and only these unique spectra, for quantification. Only fold changes ≥ 1.20 or ≤ 0.83 (the ratios with p-values < 0.05 and expected cutoff values < 0.05 with 95% confidence) were considered significant. Median intensities were used for normalization, and outliers were removed automatically (the quantitative protein ratio was normalized by the median ratio in MASCOT).
5.8. Bioinformatic Analysis of Proteins
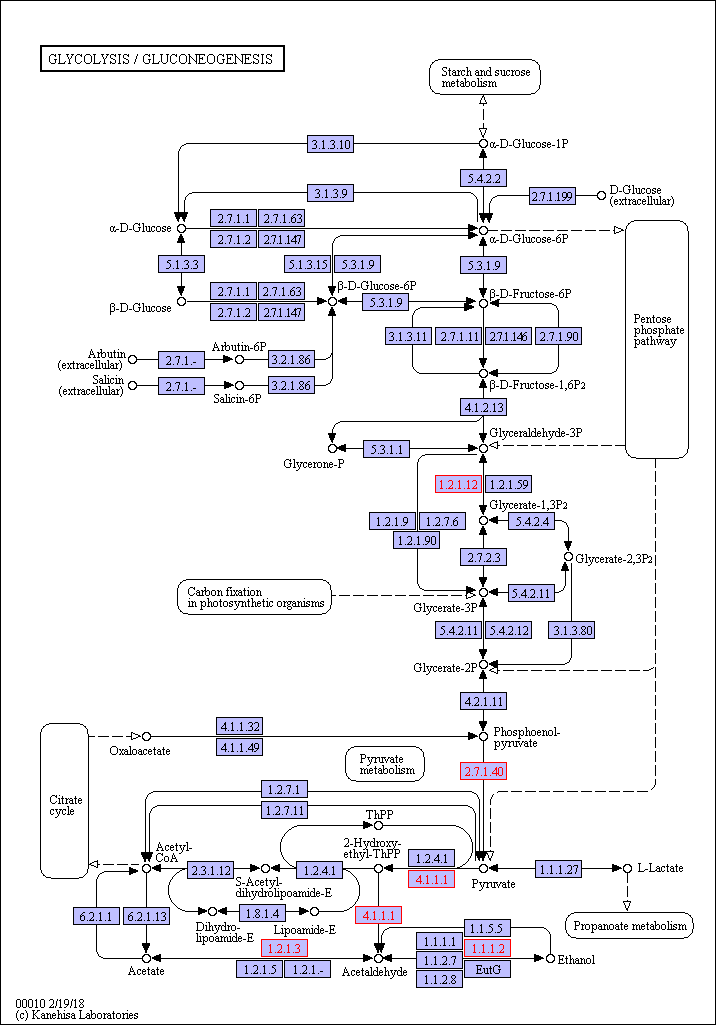
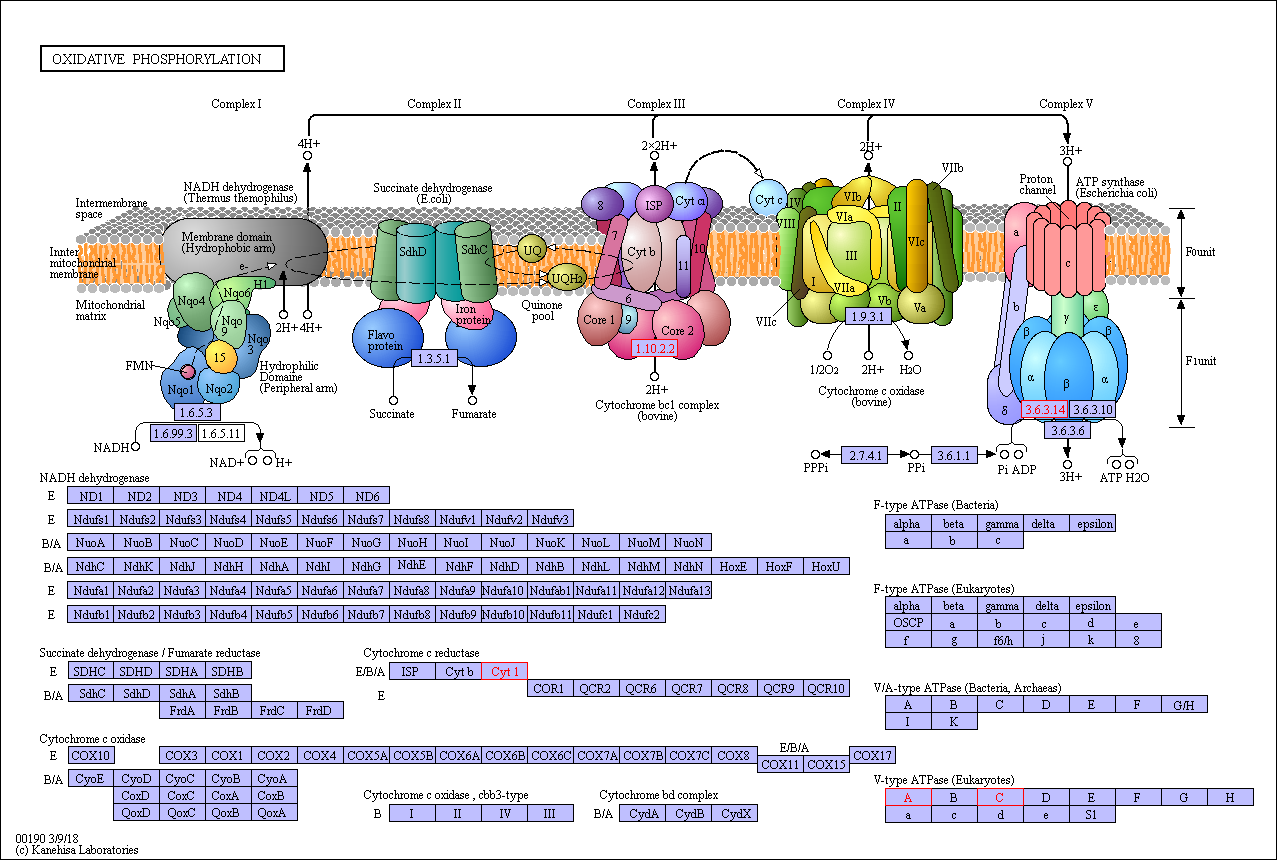
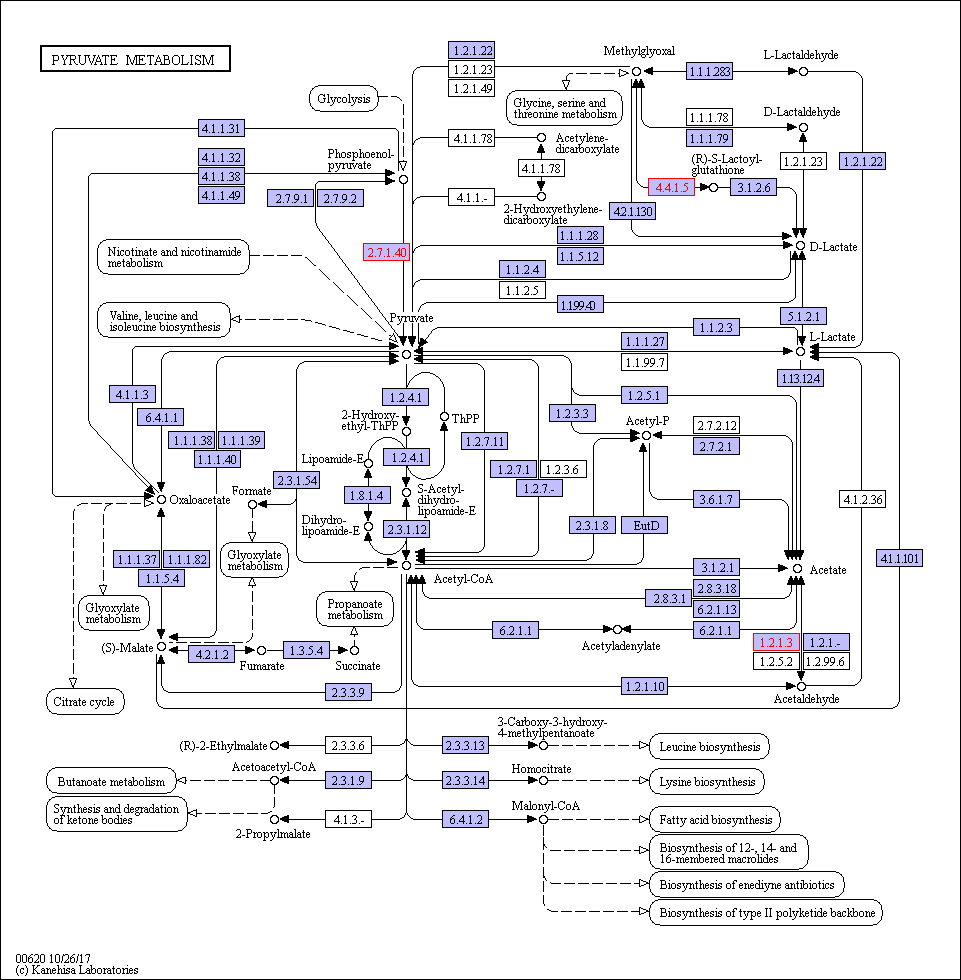
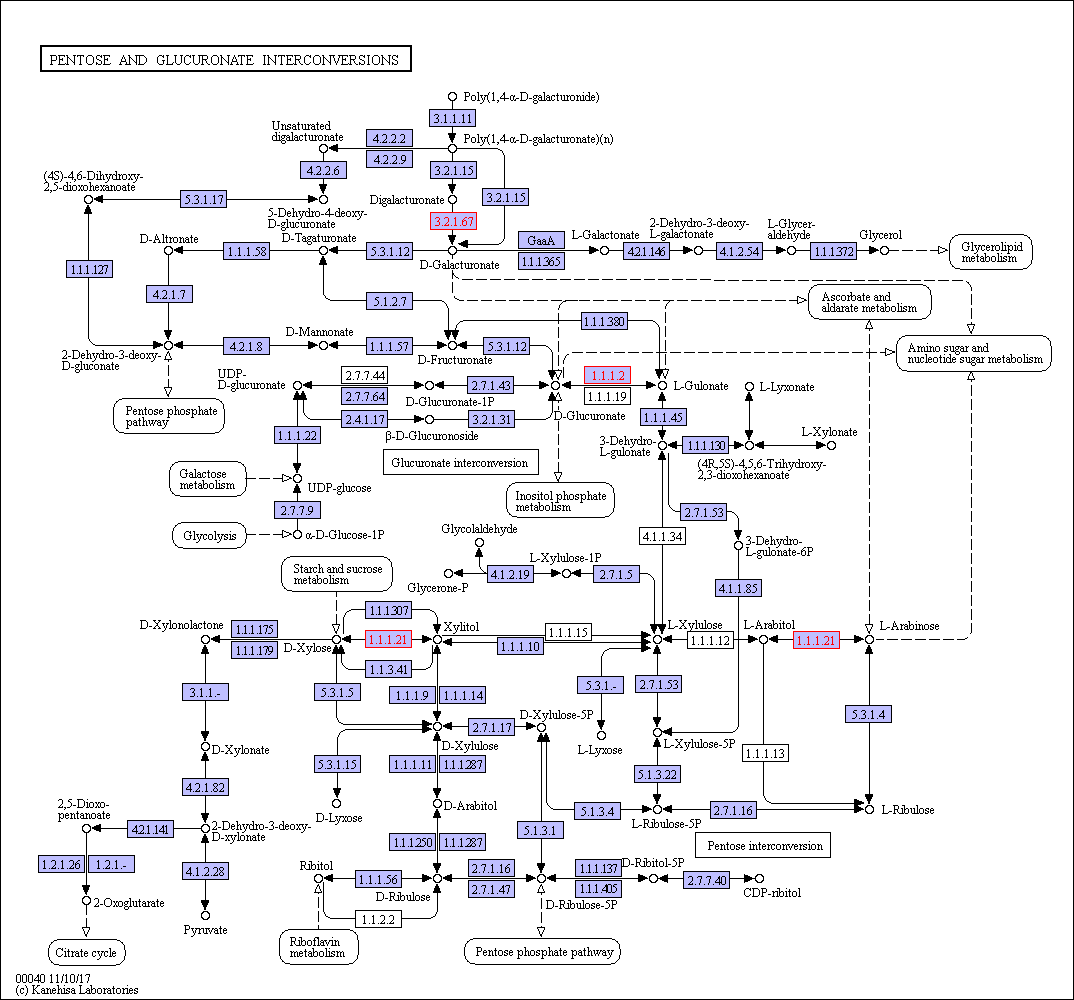
Functional category analysis was performed with Blast2GO software (http://www.geneontology. org) [47]. The online Kyoto Encyclopedia of Genes and Genomes (KEGG) database (http://www. genome.jp/kegg/) was used to retrieve KEGG Orthology (KO) data, and the data were subsequently mapped on pathways in the KEGG database [48]. The corresponding KEGG pathways were extracted. To further explore the impact of proteins with differential abundances in cell physiological processes and to identify internal associations between proteins with differential abundances, enrichment analysis was performed. Gene Ontology (GO) enrichment analysis was performed for three ontologies (biological process (BP), molecular function (MF), and cellular component(CC)). The Benjamini–Hochberg correction for multiple testing was further applied to adjust the derived p-values. Only functional categories and pathways with p-values < 0.05 were considered significant.
5.9. Total RNA Extraction and RT-qPCR Analysis
Transcript levels of genes associated with DEPs were determined using real-time quantitative polymerase chain reaction (RT-qPCR). For total RNA extraction, stems were extracted using an RNA Rapid Extraction Kit (Aidlab Biotech, Beijing, China) according to the manufacturer’s instructions. A Reverse Aid First Strand cDNA Synthesis Kit (TaKaRa Biotech, Beijing, China) was used for reverse transcribing RNA to cDNA. The procedure was as follows: RNA (2 µg) mixed with 1 µL Oligo d (T) 18 (0.5 µg/ µL), 2 × TS Reaction Mix (10 µL) and, TransScript RT/RI Enzyme Mix (1 µL) with an additional 20 µL of RNase-free Water. The mixture was mixed gently and incubated at 42 °C for 15 min. The reaction was terminated by incubation at 85 °C for 5 s, and the cDNAs of the product were stored at -20 °C. The cDNA samples were used as a template, then mixed with 200 nmol primer and SYBR Green PCR Real Master Mix (Takara, Kusatsu, Japan) for real-time PCR analysis using Bio-Rad CFX 96 real-time PCR instruments and CFX manager software ver 3.0 (Bio-Rad laboratories, California, USA). The temperature procedure was as follows: 3 min at 95 °C, and 40 cycles of denaturation at 95 °C for 20 s, annealing at 59 ℃ for 20 s, and extension at 72 ℃ for 20 s. The 18S sequence was used as an internal standard for normalization.
5.10. Statistical Analysis
All tests were performed in triplicate. For measurement of stem length, each biological replicate had six samples from six plants. For observation of flower bud differentiation, each biological replicate had five samples from six plants. For physiological and proteomic analyses, three different stems were pooled as one biological sample, which was performed three times to produce three independent biological replicates (of three pooled stems) for both physiological and proteomic analyses. The presented data represent the means ± SDs of three replications and were statistically analysed using analysis of variance (ANOVA) with SPSS 10.0 (International Business Machine, Chicago, IL, USA). Tukey’s test was used to identify significant differences among groups (p < 0.05, p < 0.01). Figures representing the physiological parameters were generated using Origin Pro 8.0 SR4 (Origin Lab, Northampton, MA, USA) and Microsoft Office PowerPoint 2007.