Patients and clinical samples
10 paired LUAD and paracancerous tissues were collected between January, 2019 and May, 2019 at Fujian Medical University Second Affiliated Hospital. All specimens were obtained from LUAD patients who only received primary surgical treatment. These specimens were immediately snap-frozen by liquid nitrogen after resection, and then stored at -80℃ until RNA extraction. The clinicopathological diagnosis was confirmed by two well-experienced pathologists according to the World Health Organization (WHO) guidelines (2015). The study was approved by the bioethical committees at The Second Affiliated Hospital of Fujian Medical University, China (2020-206). And, all participating patients provided written informed consent.
RNA extraction and sequencing
Total RNA of LUAD tissues and paracancerous tissues was isolated from collected frozen tissues with the RNeasy Mini Kit (Qiagen, Germany) following the standard manufacturer’s instructions. Qubit 4.0 (Thermo Fisher Scientific, Wilmington, DE, USA) was used to evaluate the RNA concentration, and agarose gel electrophoresis was applied to assess the RNA quality.
Then, ribosomal RNA was removed from the total RNA to retain the maximum residual non-coding RNA (ncRNA). After fragments of rRNA-depleted RNA, the cDNA library construction was performed with the TruSeq RNA Sample Prep Kit (Illumina, San Diego, CA, USA). LncRNA/mRNA sequencing libraries were generated using the VAHTS total RNA-seq Library Prep kit for Illumina (Vazyme NR603, China) following the standard manufacturer’s instructions. The cDNA fragments with 150-bp paired-end reads were generated for RNA sequencing. Then, NEBNext® Multiplex Small RNA Library Prep Set for Illumina® (NEB) was applied to establish the miRNA library for samples. 12 libraries were pooled and sequenced in a single lane of Illumina HiSeq Xten sequencing platform. And the Illumina’s TruSeq small RNA library preparation kit was applied to establish the miRNA library with 50-bp paired-end reads generated. After library construction, the sequencing for both lncRNA/mRNA and miRNA was carried out with the Illumina HiSeq Xten platform.
Identifications of differentially expressed mRNAs, miRNAs and lncRNAs
Mirdeep2 (v2.0.0.5) was applied to predict new miRNA, whose expression was calculated and standardized using counts per million (CPM) read. While, LncRNAs were annotated by three databases, including CNCI (https://github. com/www-bioinfo-org/CNCI) and CPC2 (http://cpc2.cbi. pku.edu.cn/), CPAT (https://sourceforge.net/projects/rna-cpat/), PLEX (https://sourceforge.net/ projects/plek/). The intersection was retained for further analysis.
DESeq2Rpackage(https://bioconductor.org/packages/release/bioc/html/DESeq2.html) in the Bioconductor project was applied to screen the differentially expressed mRNAs (DEmRNAs), differentially expressed miRNAs (DEmiRNAs) and differentially expressed lncRNAs (DElncRNAs) between LUAD and normal tissues. |Log2(fold change)|(|log2FC|) ≥1 and statistical P <0.05 were set as cut-off criteria. Subsequently, unsupervised hierarchical clustering was performed for DE-RNAs, and the expression patterns of which in paired tissues were displayed in form of heatmap using the ‘pheatmap’ R package (https://cran.r-project.org/ web/ packages/pheatmap/index.html).
Analysis of the DElncRNAs Enrichment pathway
Gene ontology (GO, http://www.bioconductor.org/packages/release/bioc/ html/topGO.html) function analysis was performed to screen enrichment of targeted genes to annotate the biological functions regulated by DElncRNAs, including biological processes (BP), cellular component (CC), and molecular function (MF). In addition, Kyoto Encyclopedia of Genes and Genomes (KEGG, http://www.genome.jp/keggbin/show_organism?menu_type=pathway_maps&org=hsa) analysis was conducted to determine the vital signaling pathways associated with DElncRNAs. Both GO and KEGG enrichment analysis set gene count ≥2 and P value <0.05 as the threshold for statistical significance.
Predication of miRNA Regulation Relationship
The miRWalk 2.0 (http://zmf.umm.uni-heidelberg.de/ pps/zmf/mirwalk2/) was applied to perform the prediction of miRNA-gene analysis of DEmiRNA. Additionally, miRWalk, miRanda, miRDB, miRMap and TargetScan databases were applied to predict the potential DEmiRNA-DEmRNA regulatory relationships. Subsequently, the StarBase (http://starbase.sysu.edu.cn/) database was used to predict the potential miRNA-lncRNA regulatory relationships by DEmiRNA. Then, the DEmRNA-DEmiRNA and DEmiRNA-DElncRNA regulatory relationships were successfully constructed based on shared DEmiRNAs with which DEmRNAs and DElncRNAs interact, and were visualized by Cytoscape software.
Construction of lncRNA-miRNA-mRNA ceRNA network
Based on the hypothesis of miRNA sponge, the positive correlation expression of DElncRNAs-DEmRNAs was focused on, and the positive correlation co-expressed relationships between DEmRNAs and DElncRNAs simultaneously regulated by DEmiRNAs was obtained. Subsequently, the competing endogenous RNA (CeRNA) network was constructed based on shared miRNAs. Furthermore, we applied a hypergeometric cumulative distribution function test to predict the possible ceRNA pairs, and only the pairs with correlation coefficient>0.5 and P value<0.05 were selected. The Sanguini diagram was built based on the R software package ‘ggalluval’ (https://github.com/corybrunson/ggalluvial).
Public data source
Raw counts of RNA-sequencing data from 510 LUAD and paired normal tissue samples and corresponding clinical information were obtained from The Cancer Genome Atlas (TCGA) dataset (https://portal.gdc.cancer.gov/) in January 2020, and the method of acquisition and application for data were complied with the guidelines and policies. A total of 515 paired LUAD tissues RNA-seq data in the TCGA database were retrieved. LUAD-related RNA-sequencing data and corresponding clinical information were obtained from the TCGA database as following criteria: 1) histologically diagnosed as LUAD; 2) data with clinical information. Finally, a total of 510 paired LUAD tissues was included for further analysis.
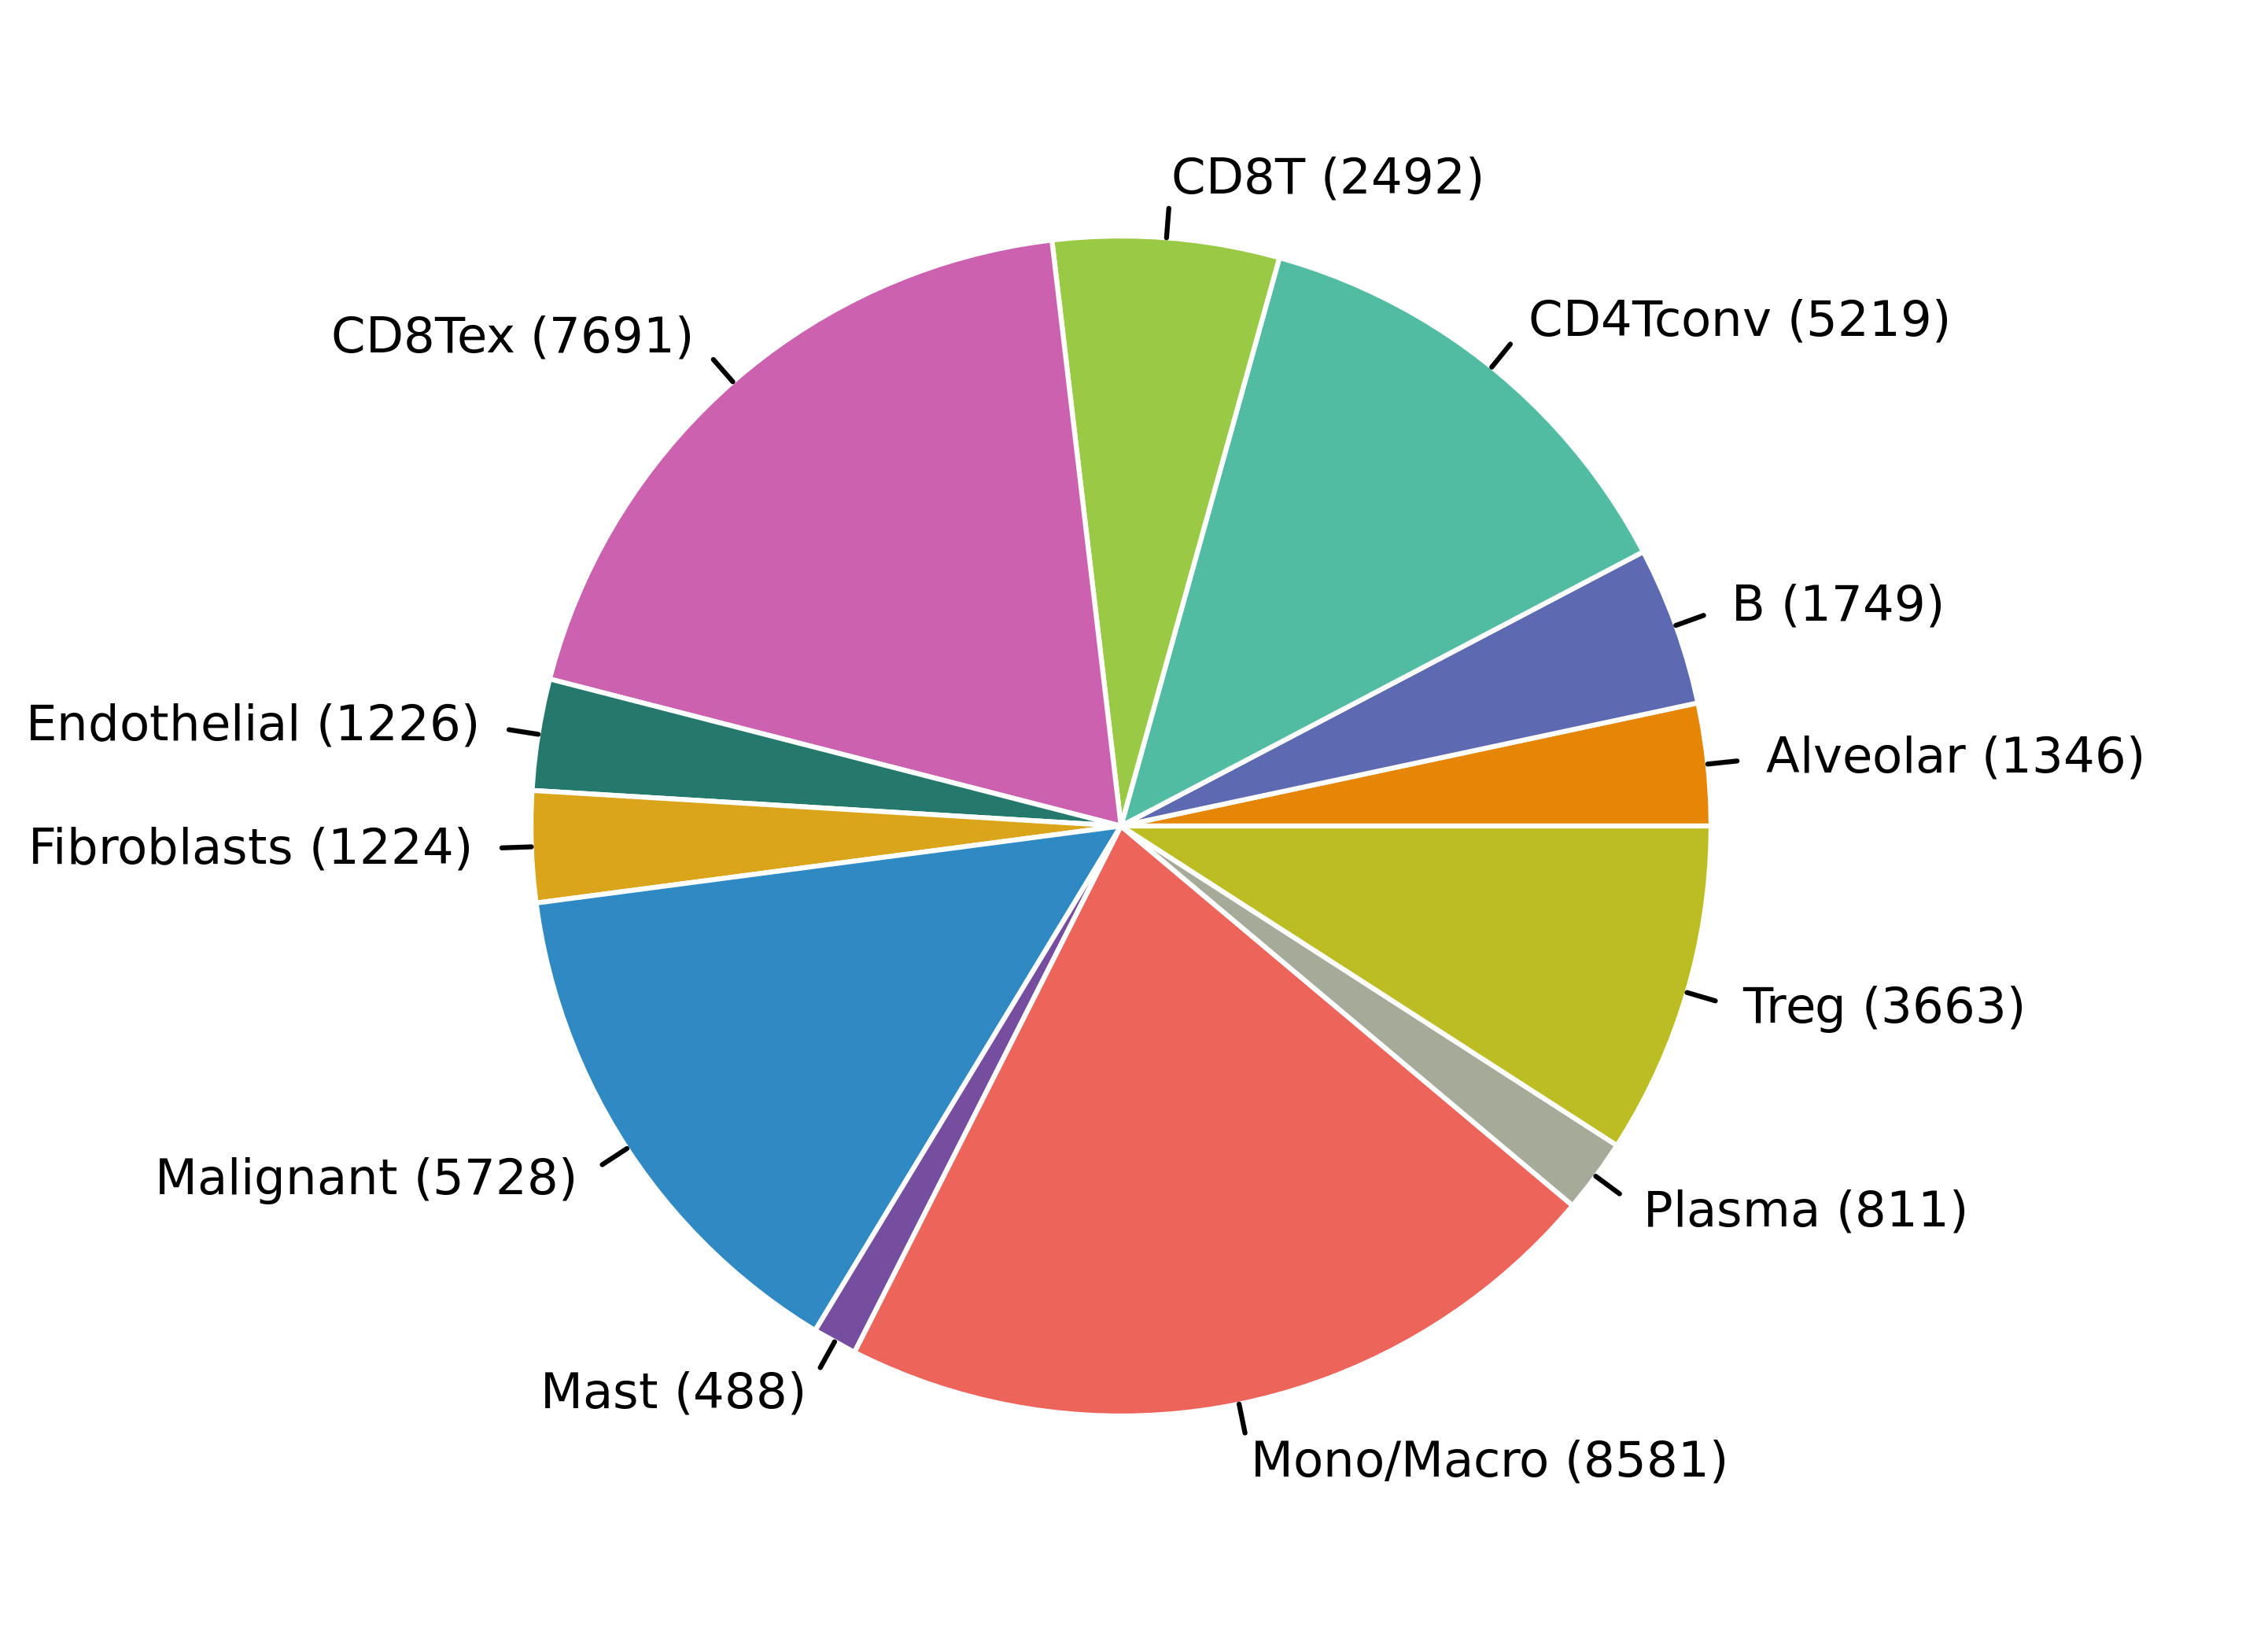
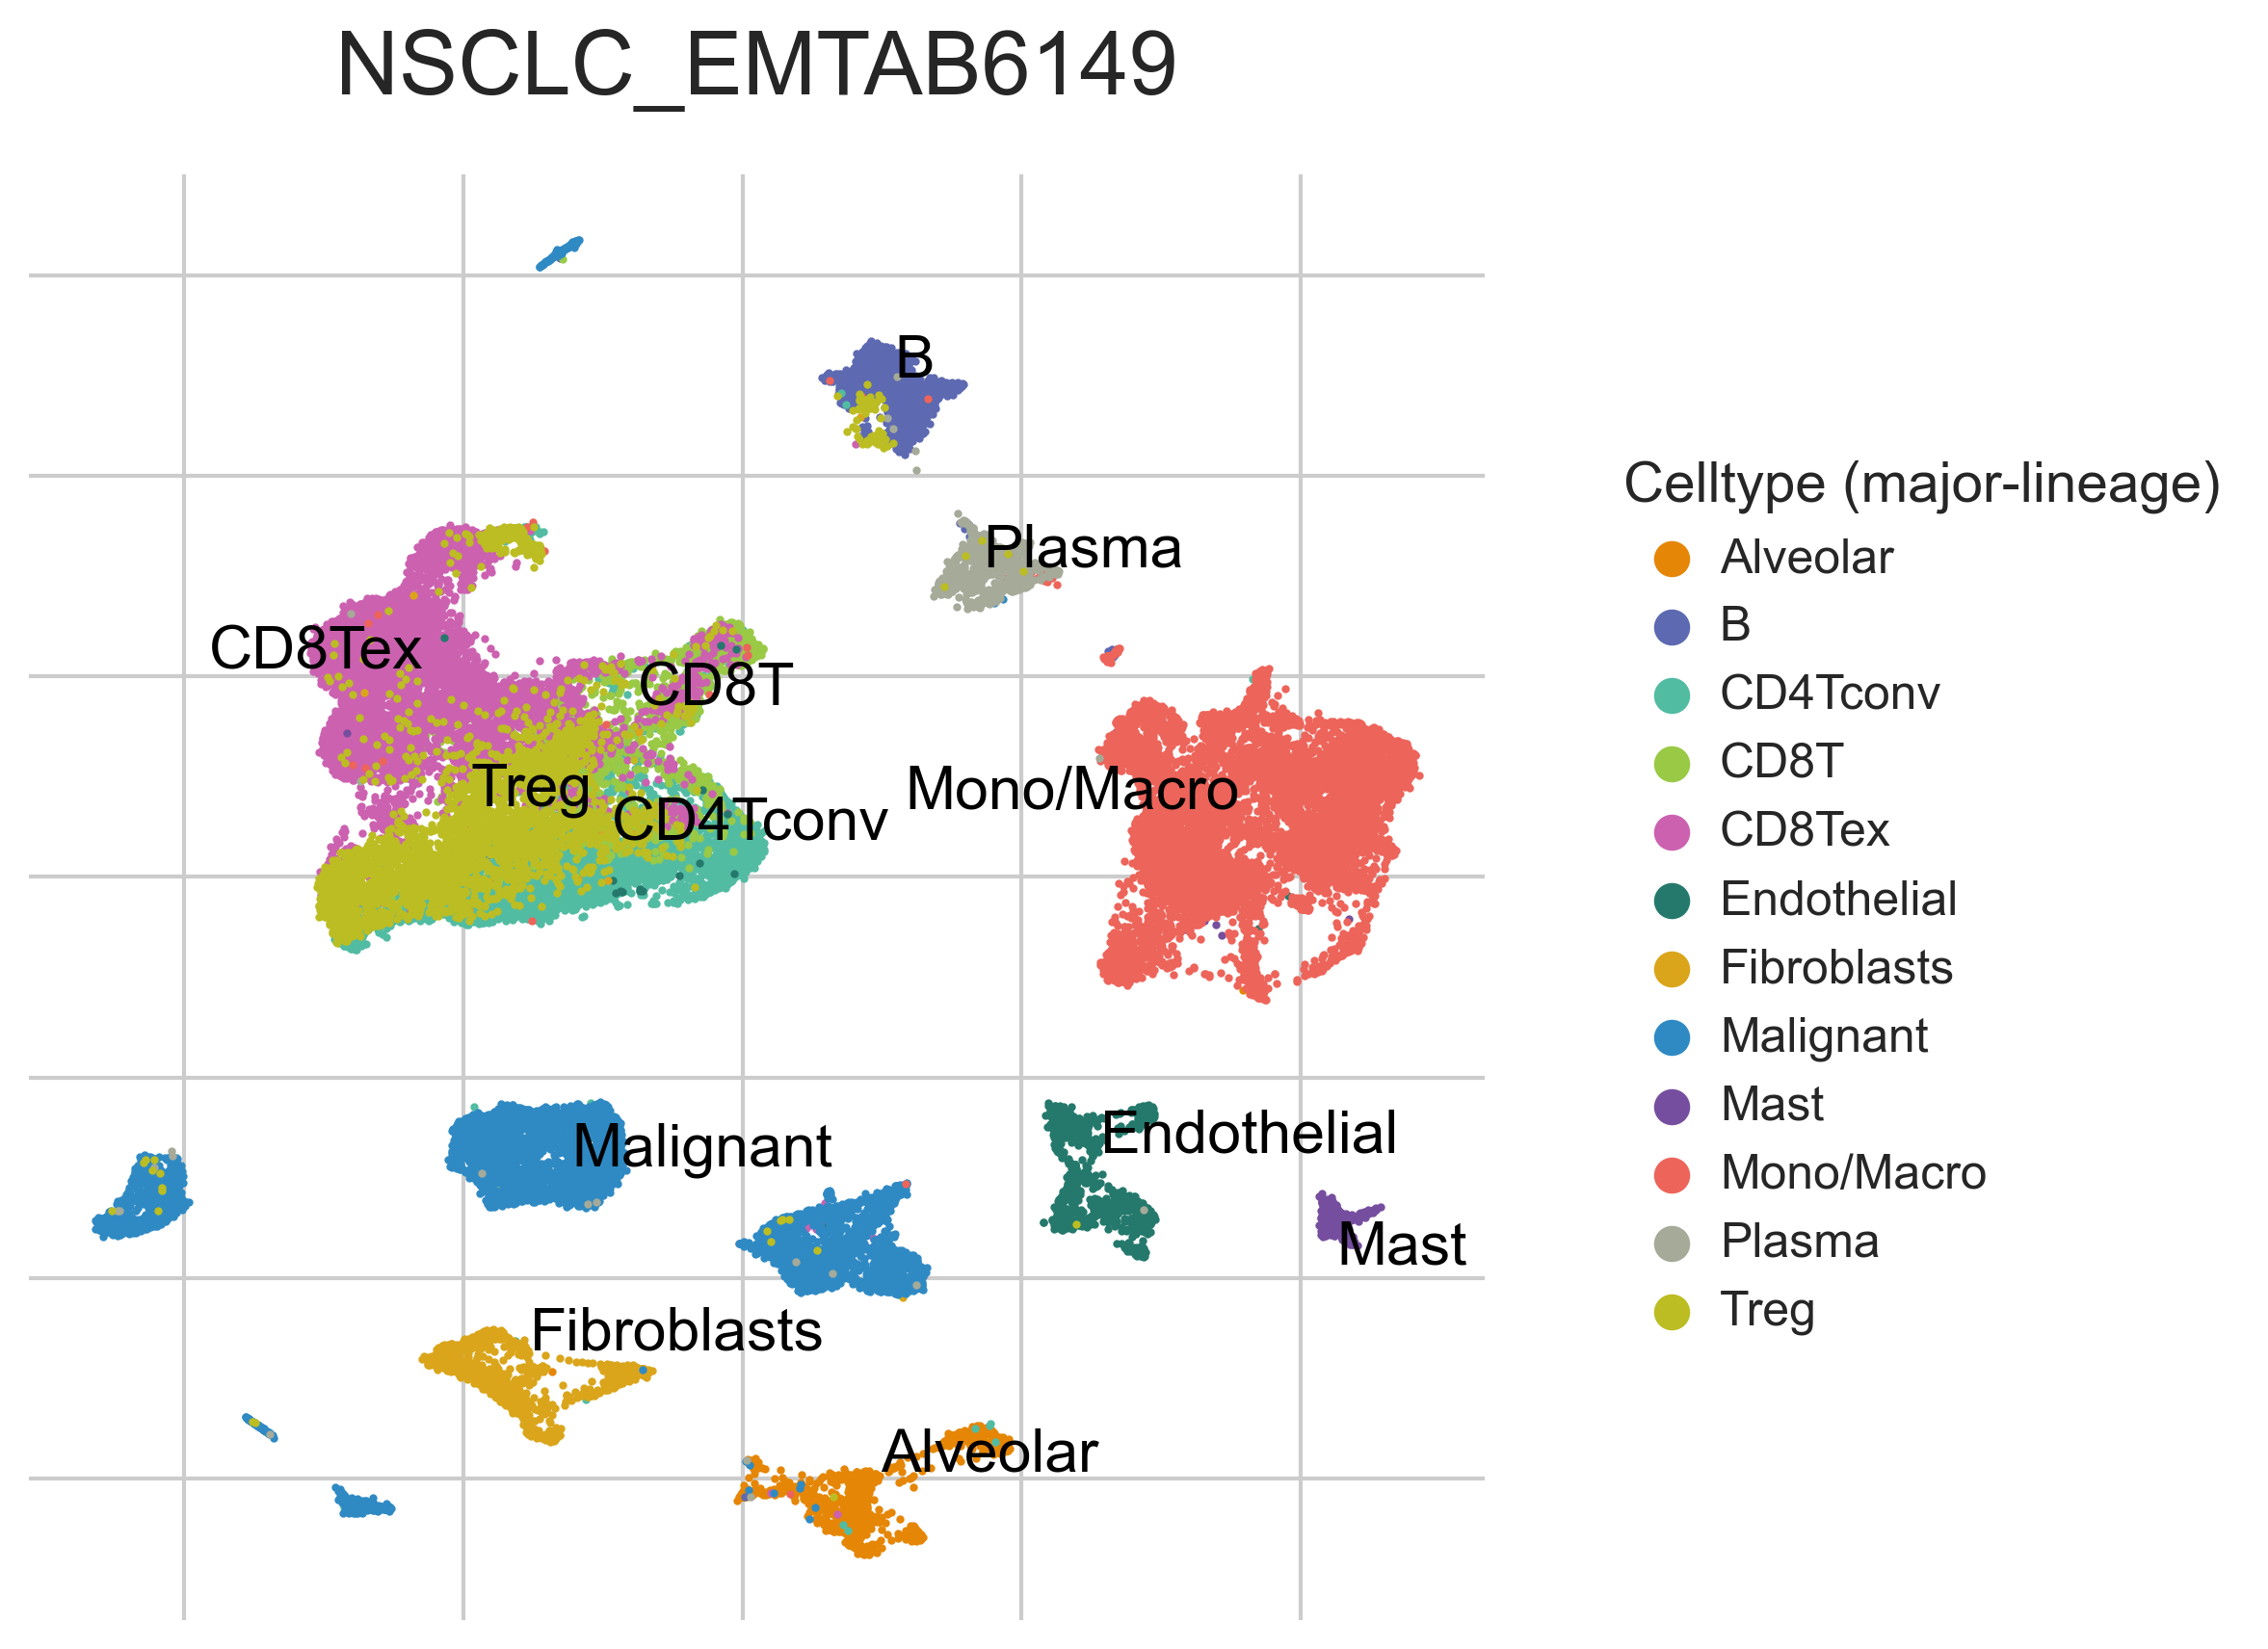
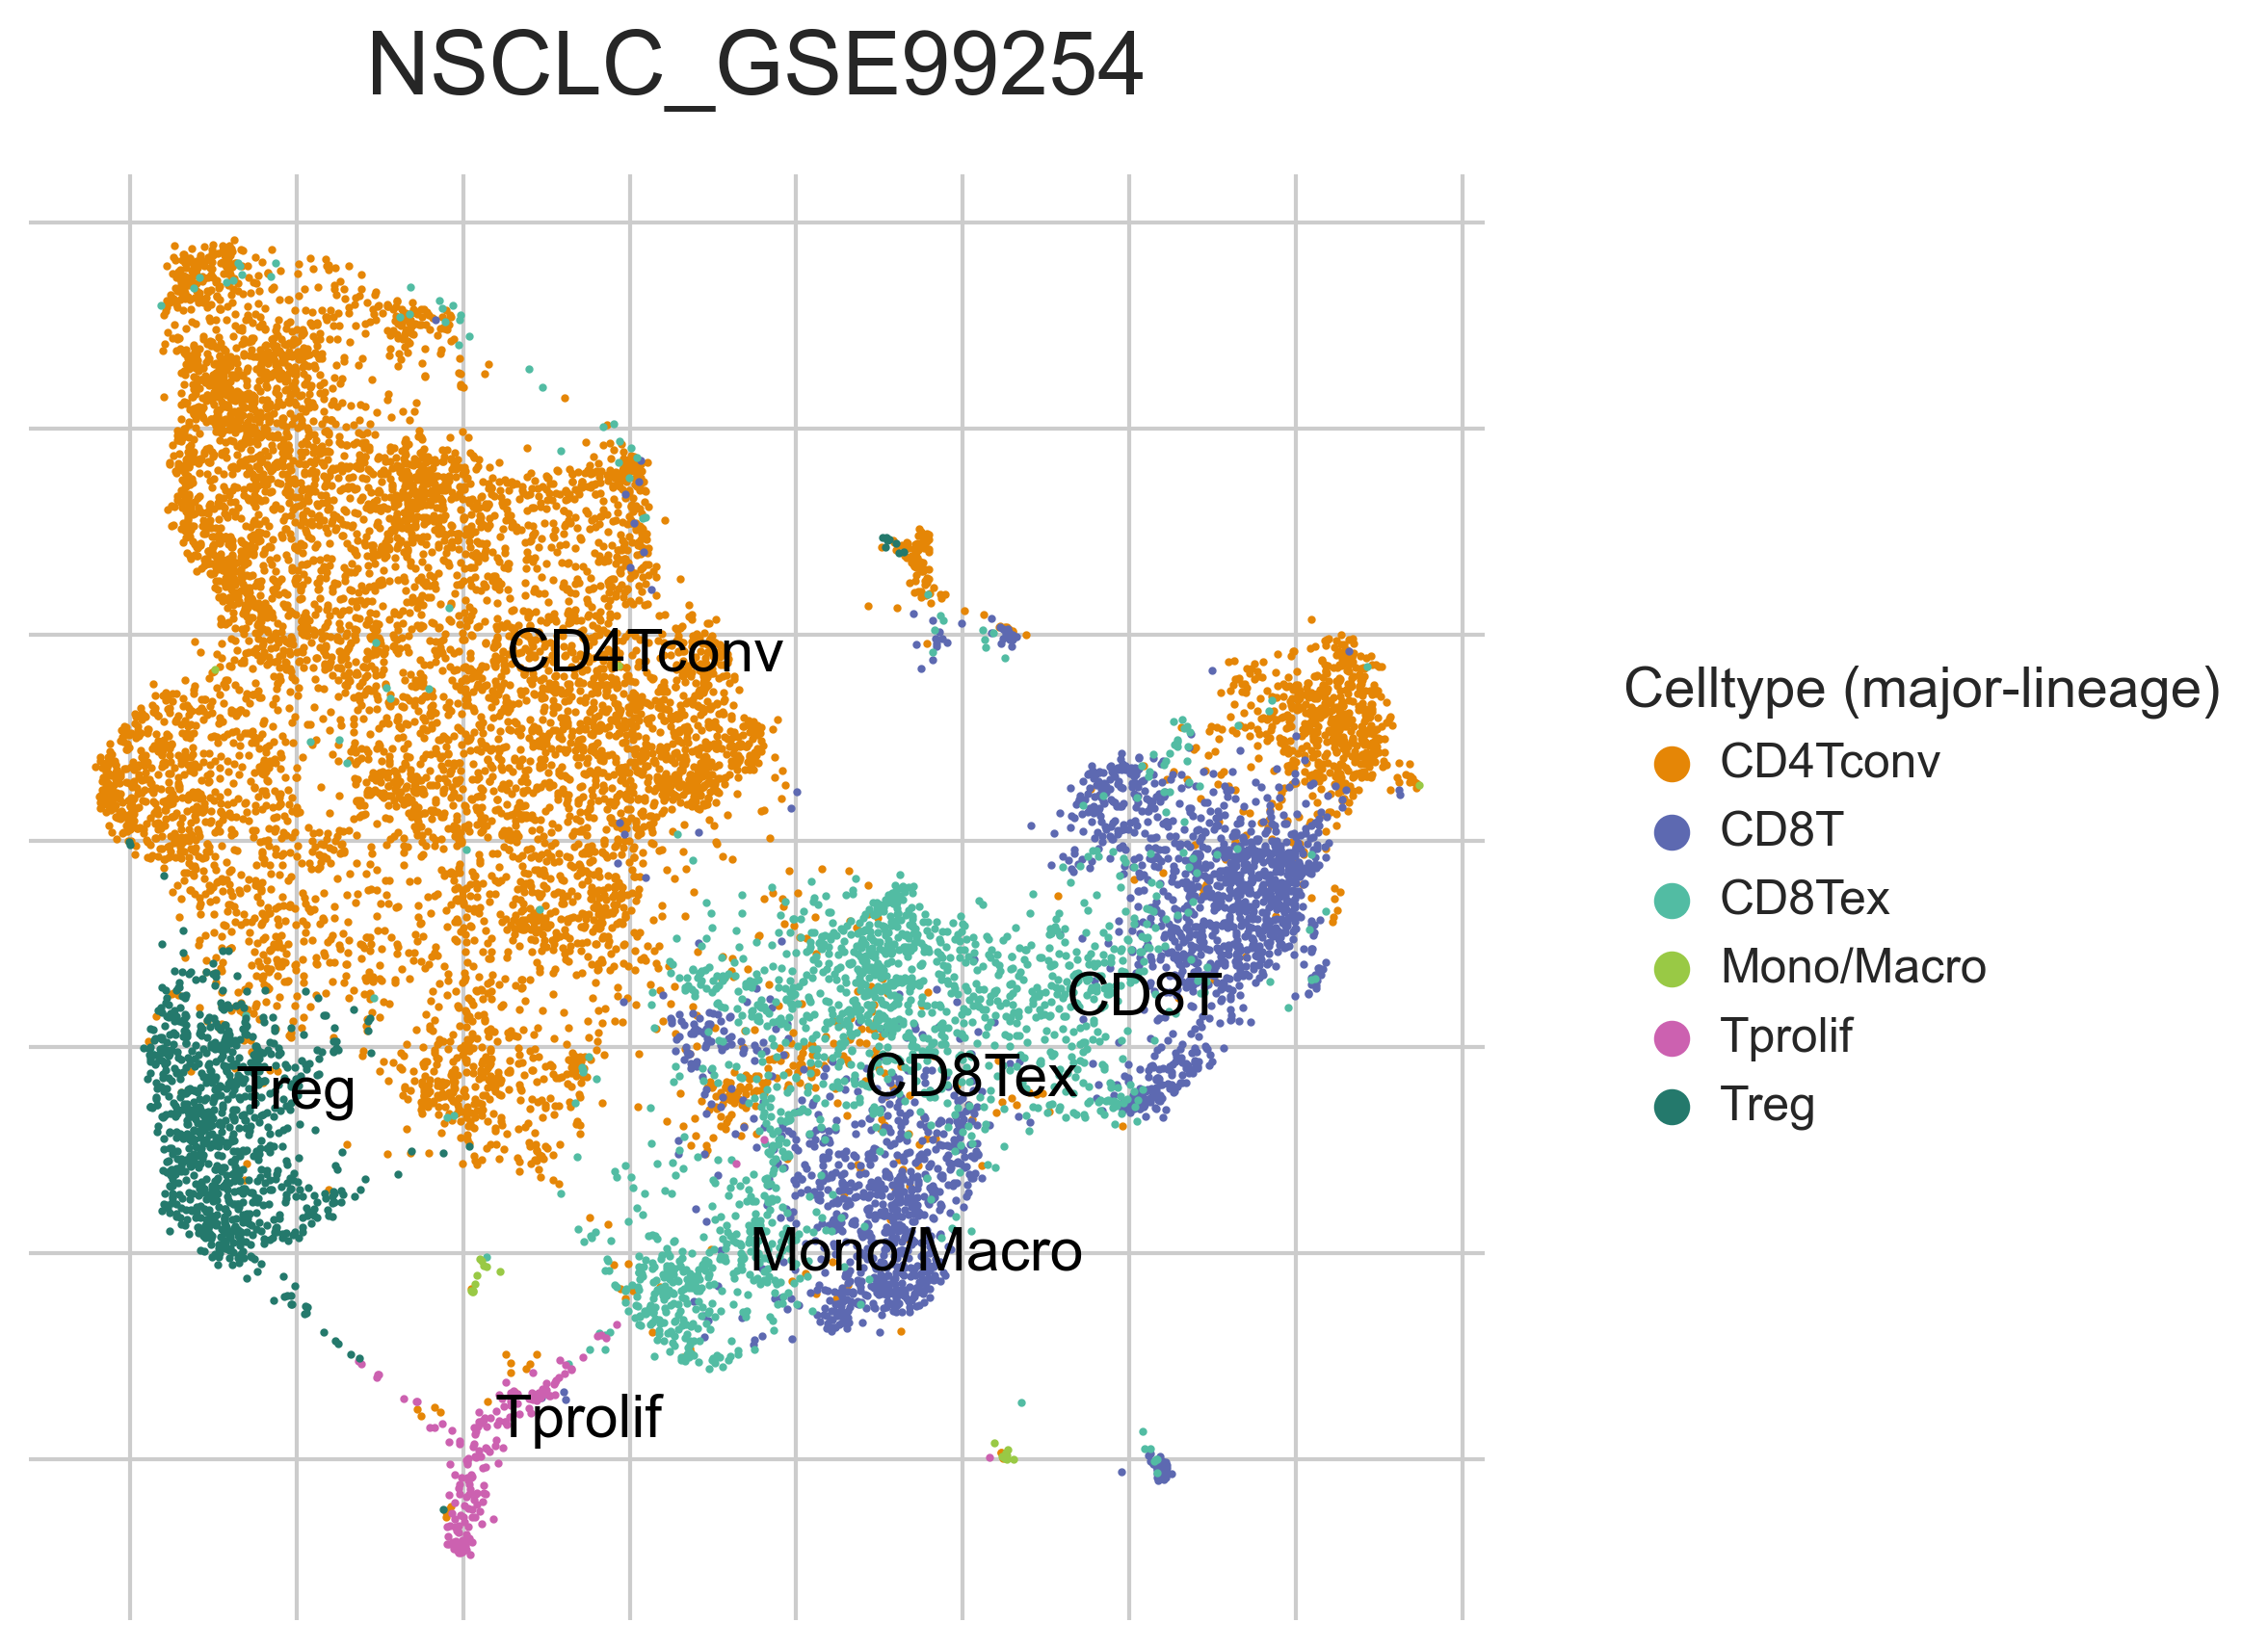
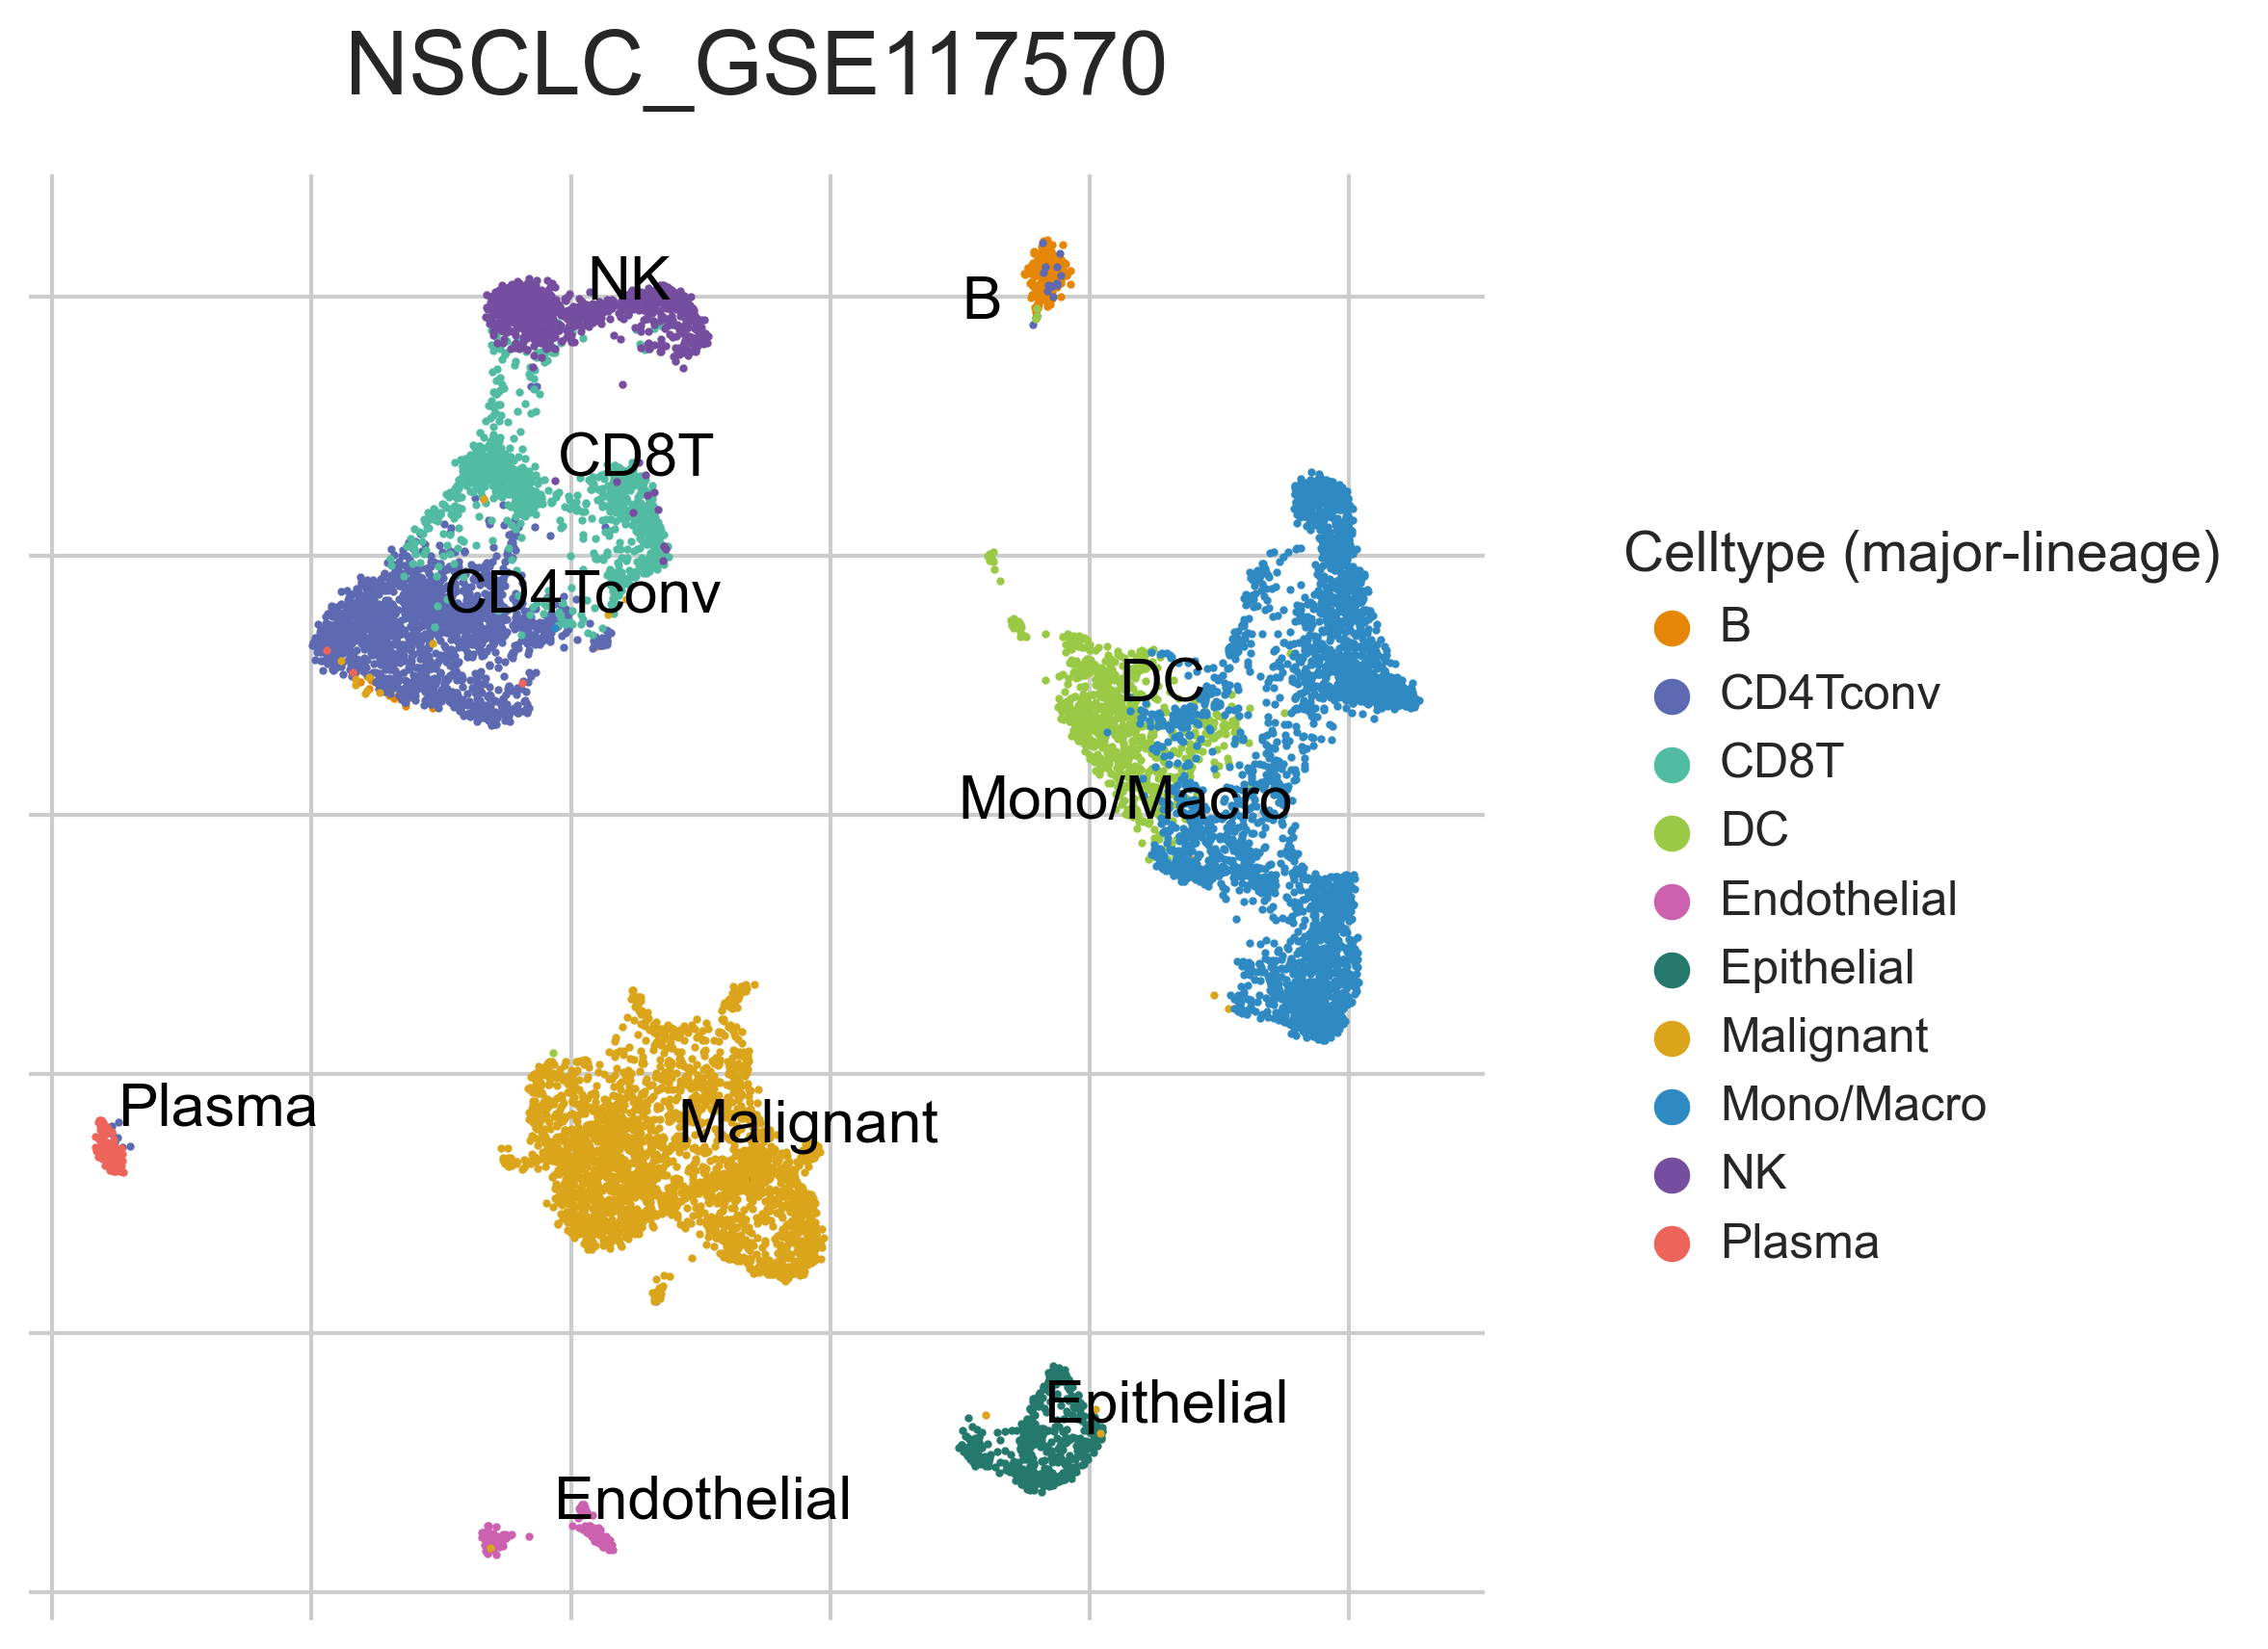
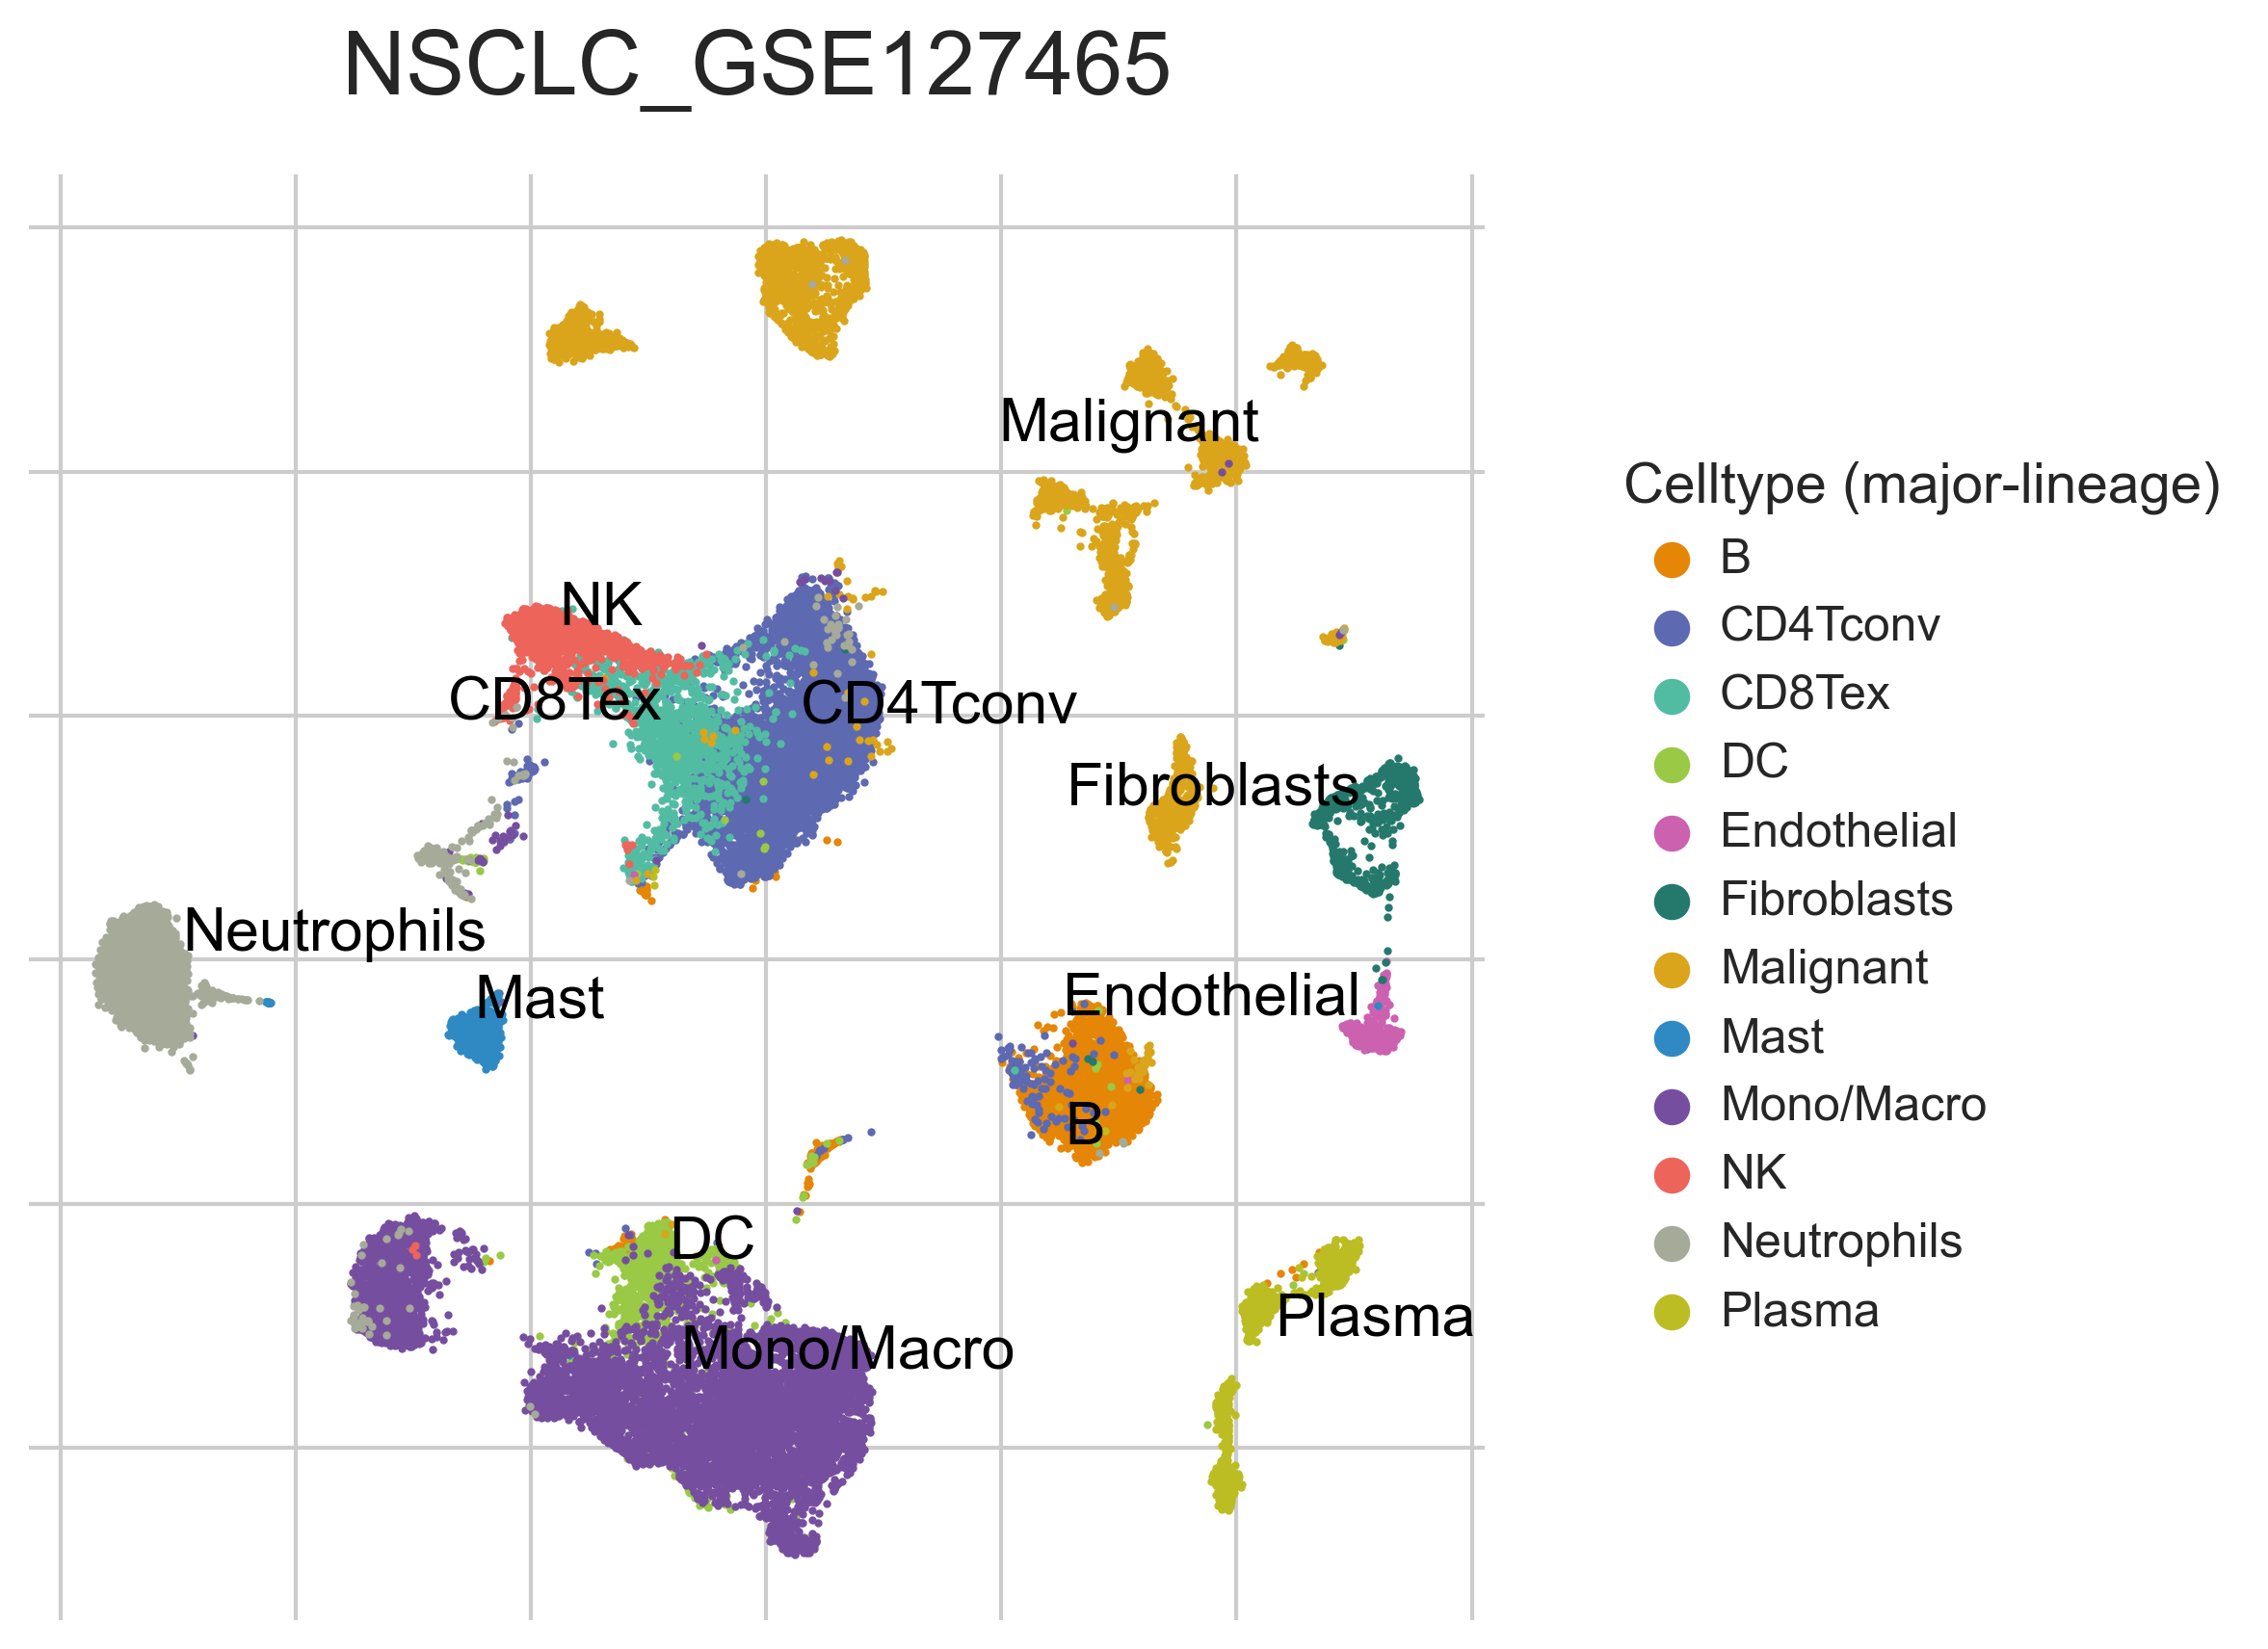
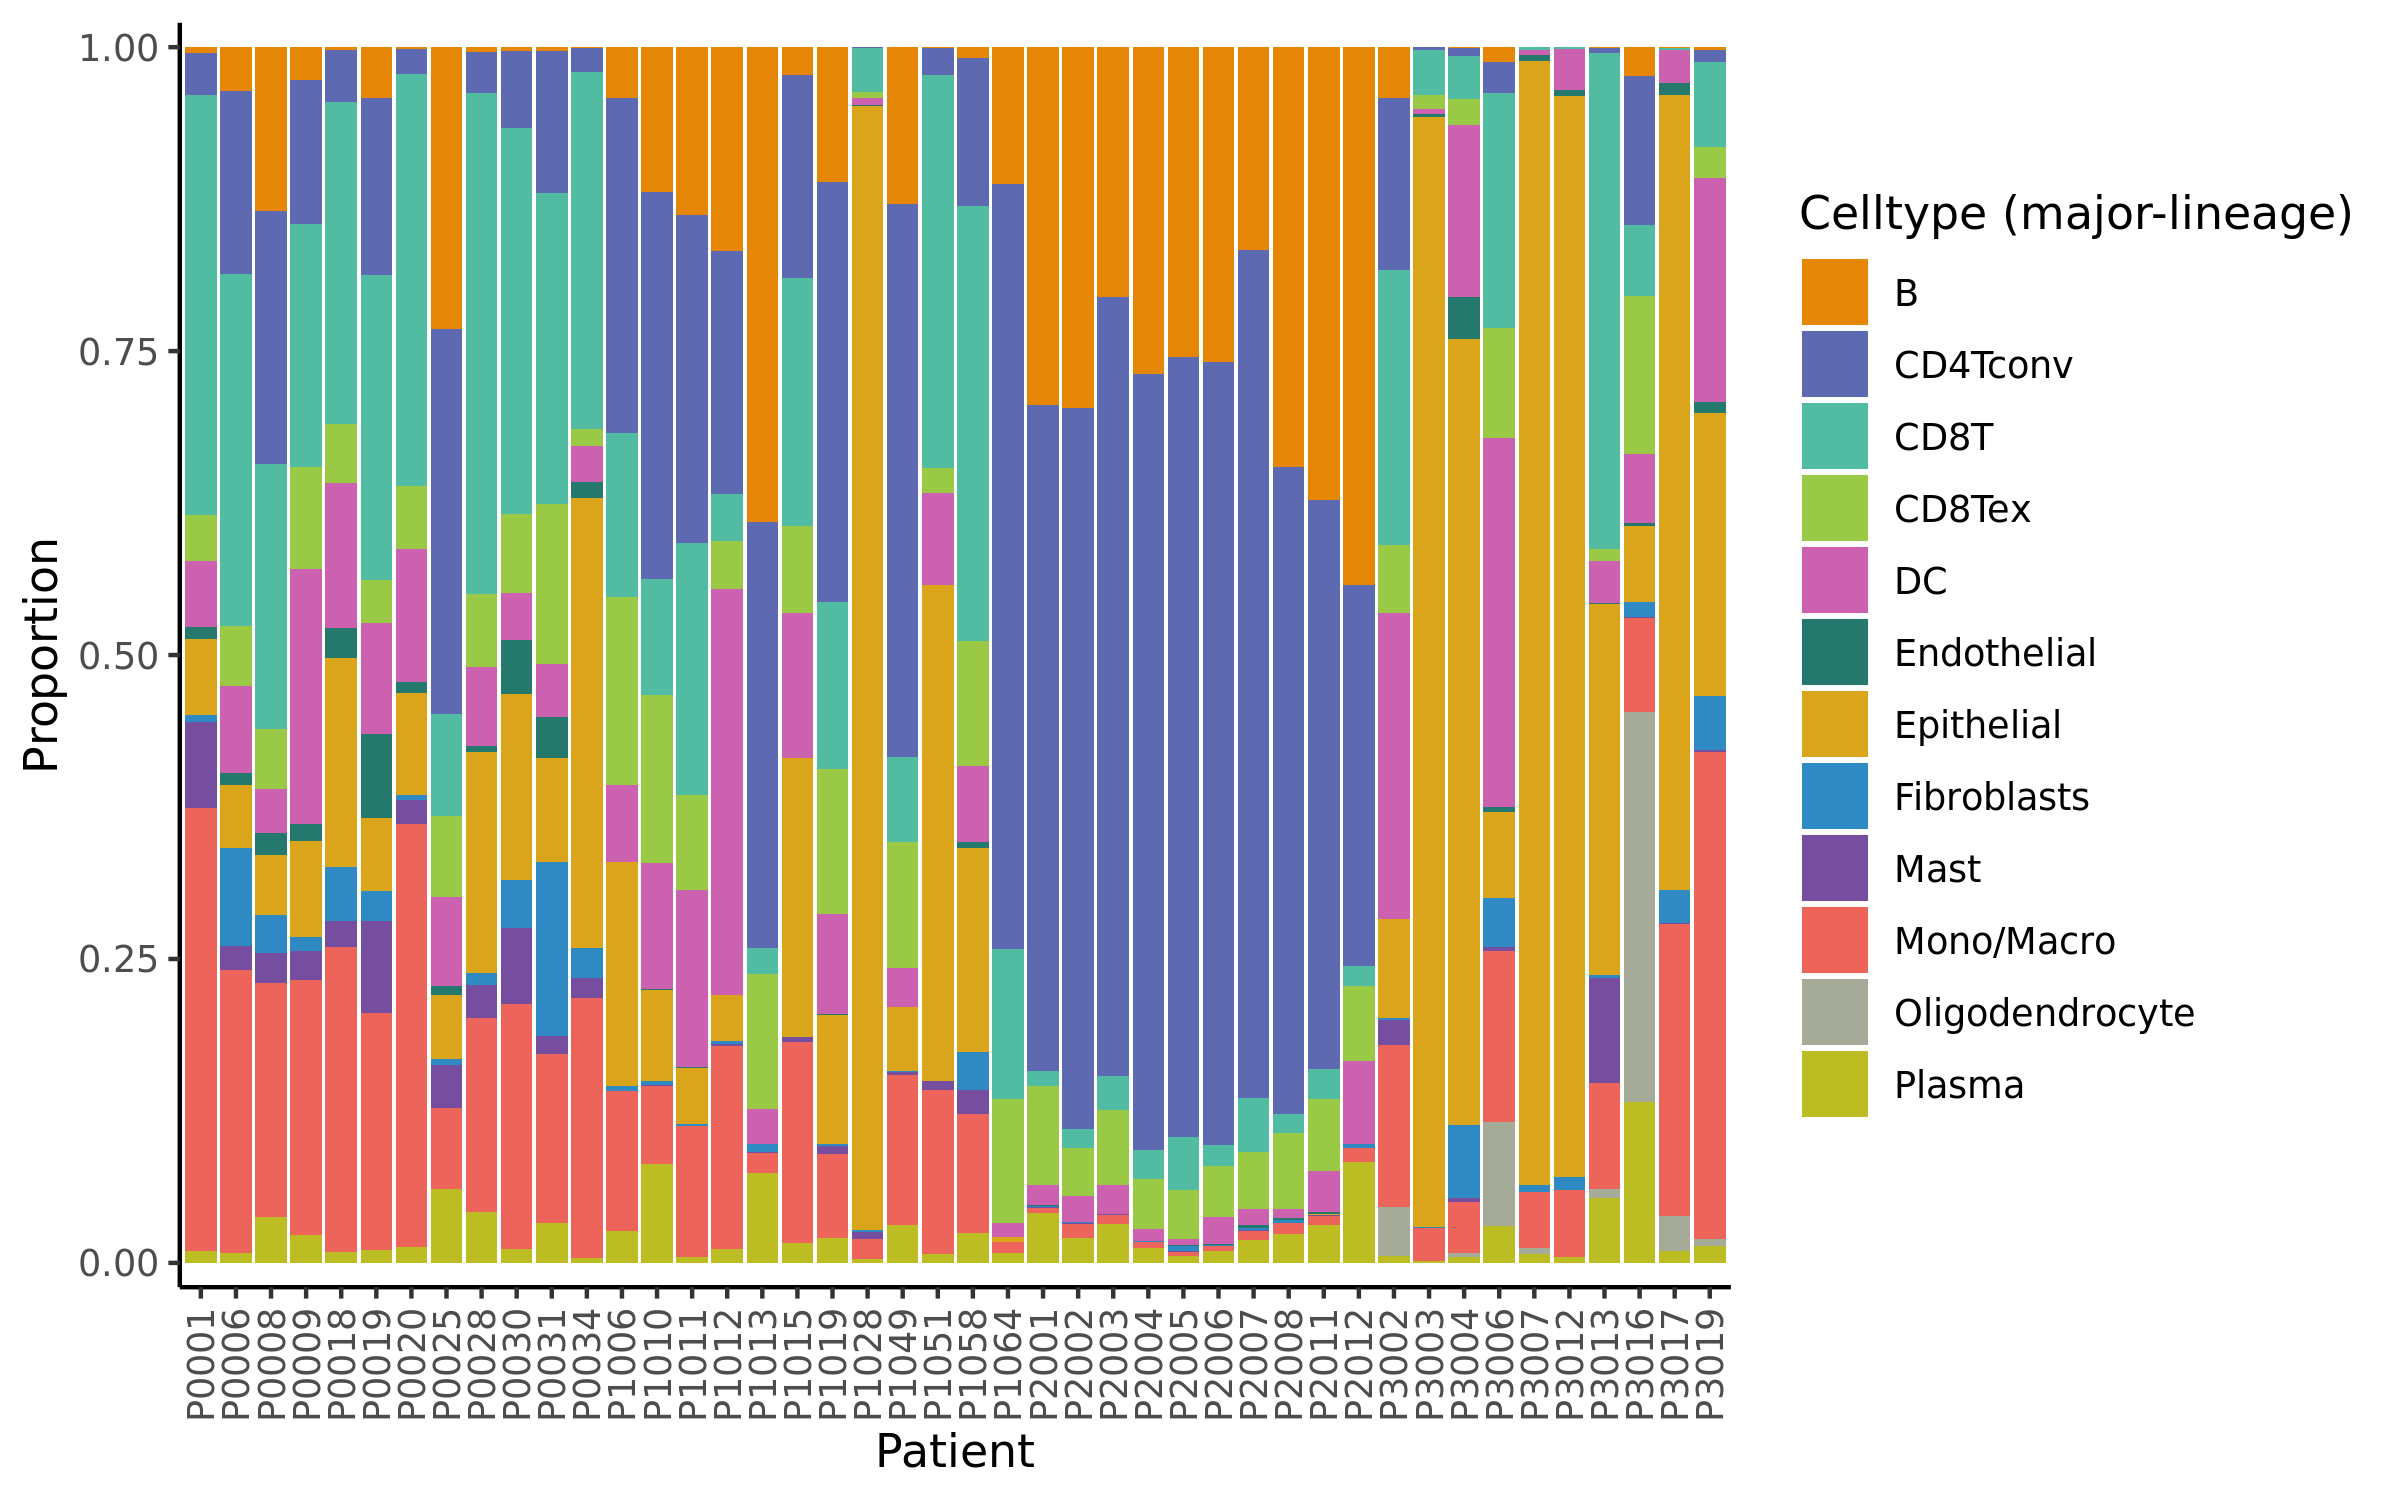
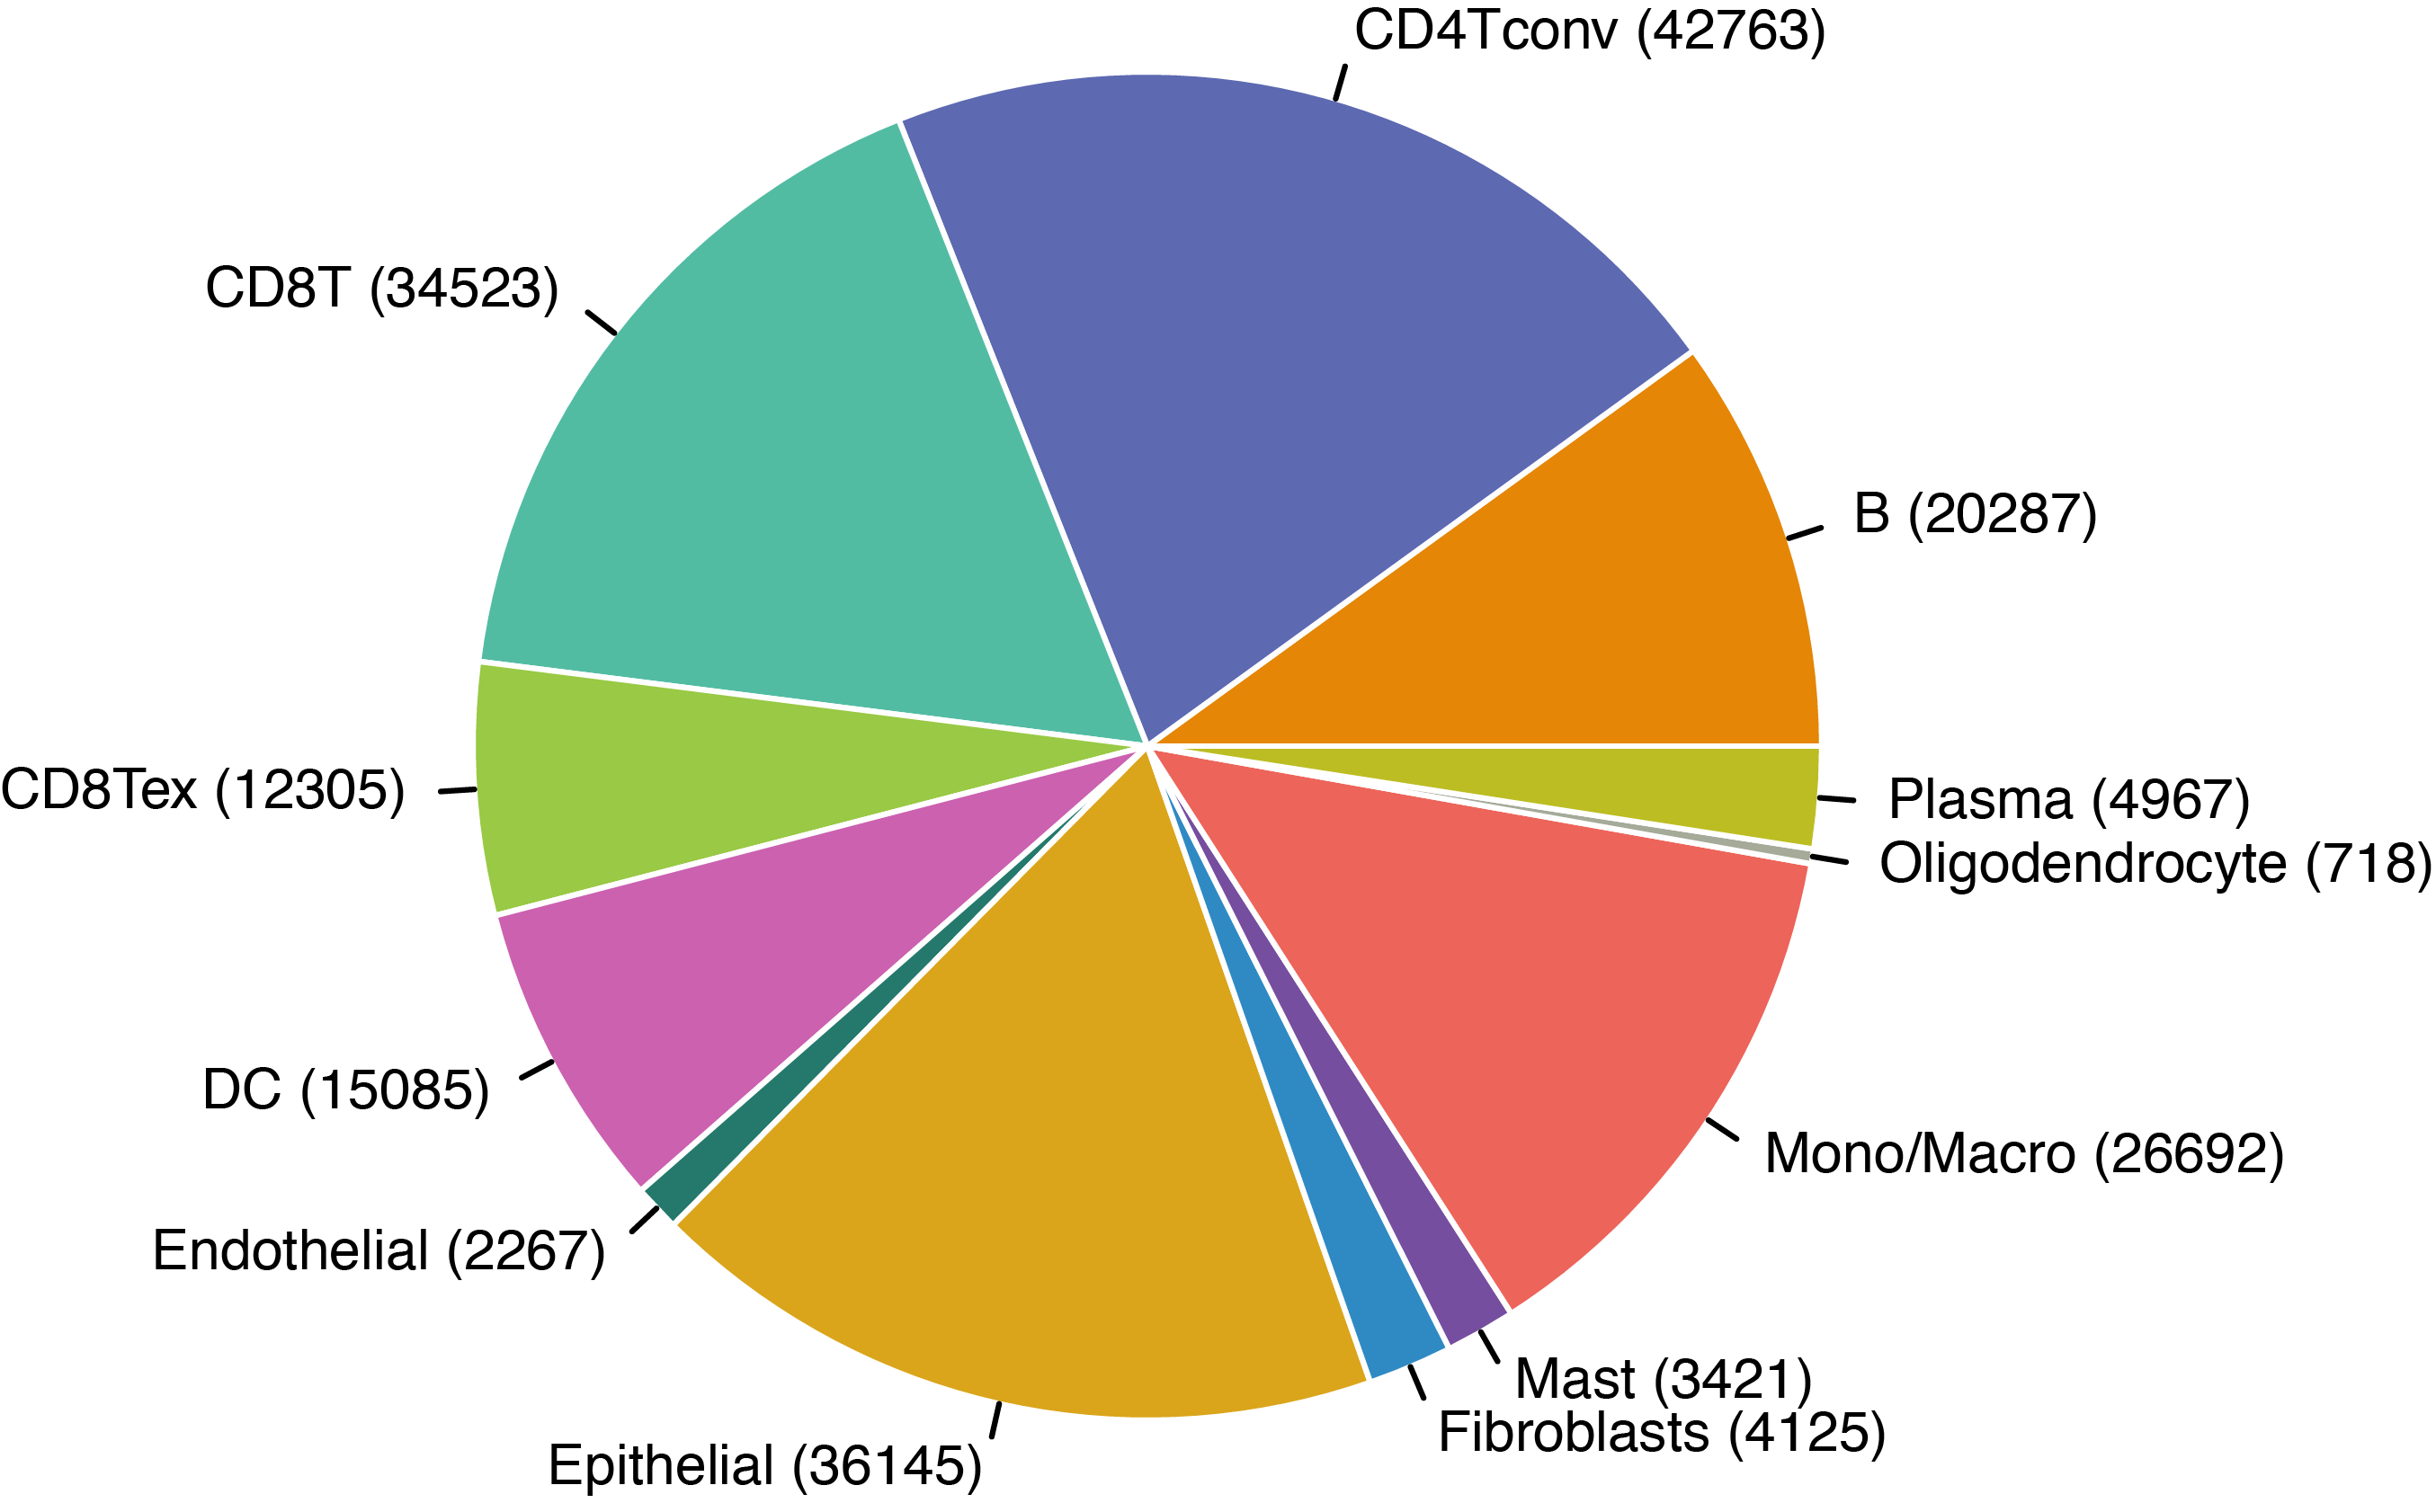
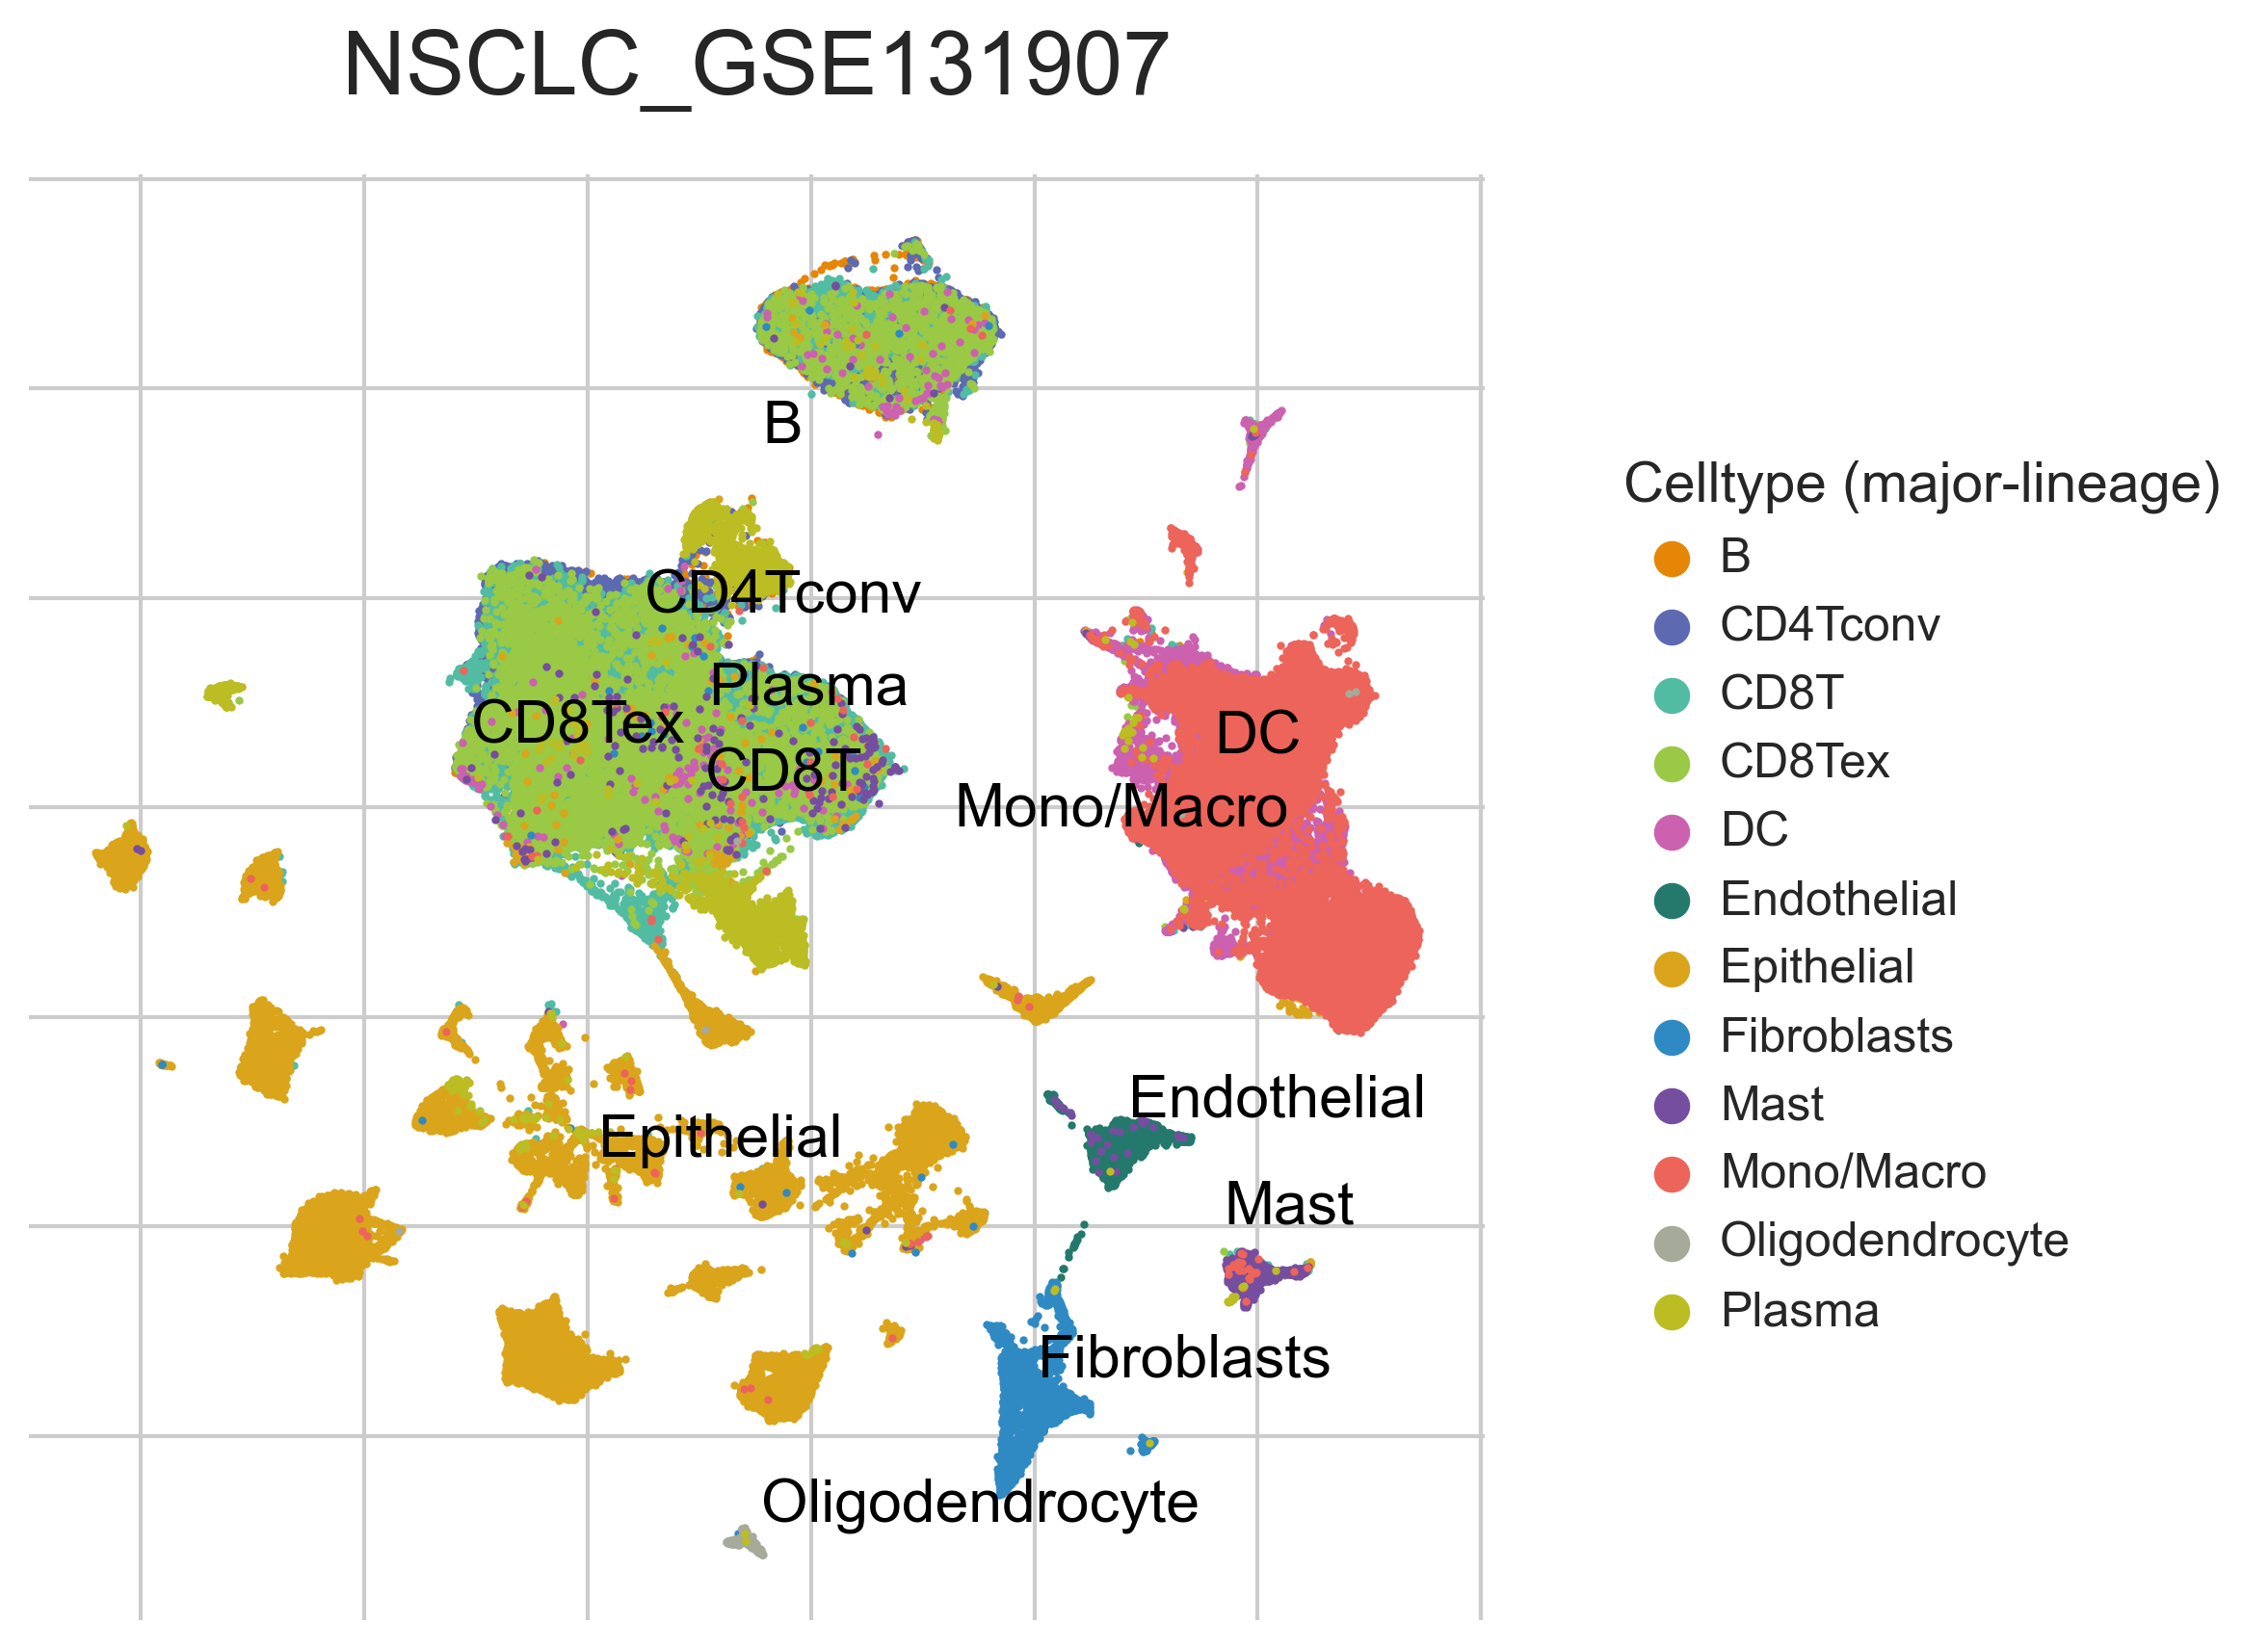
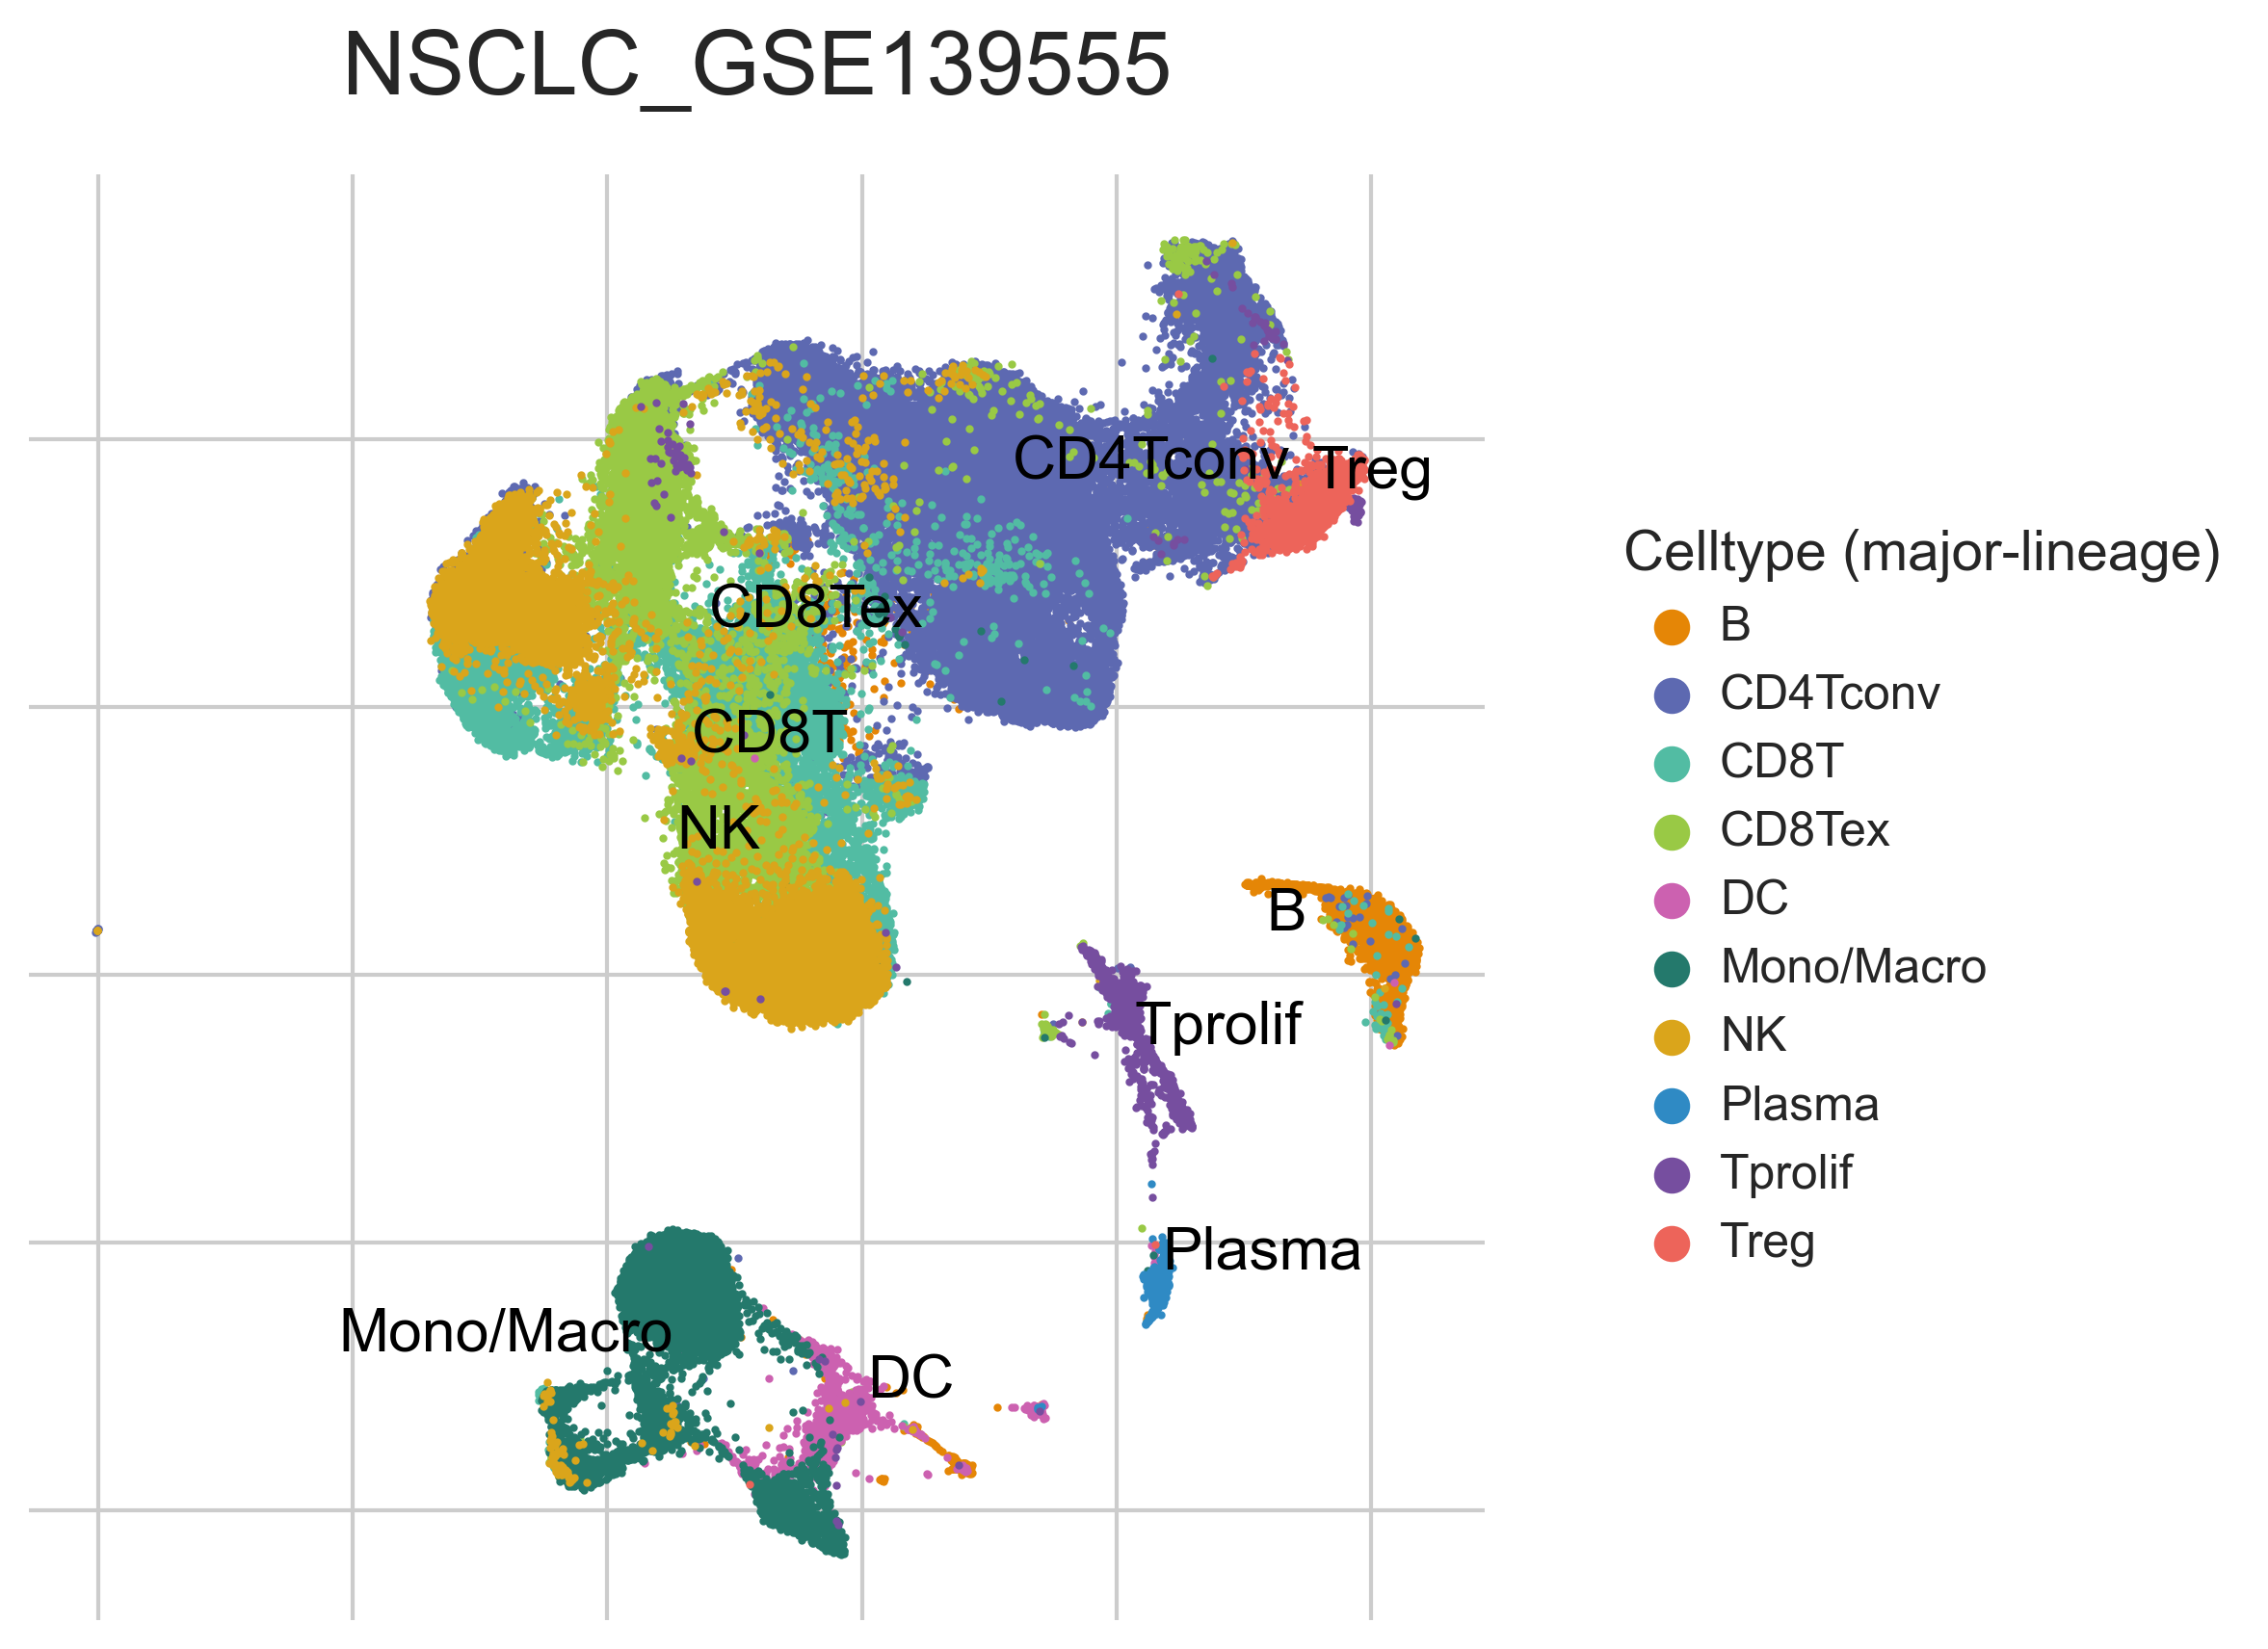
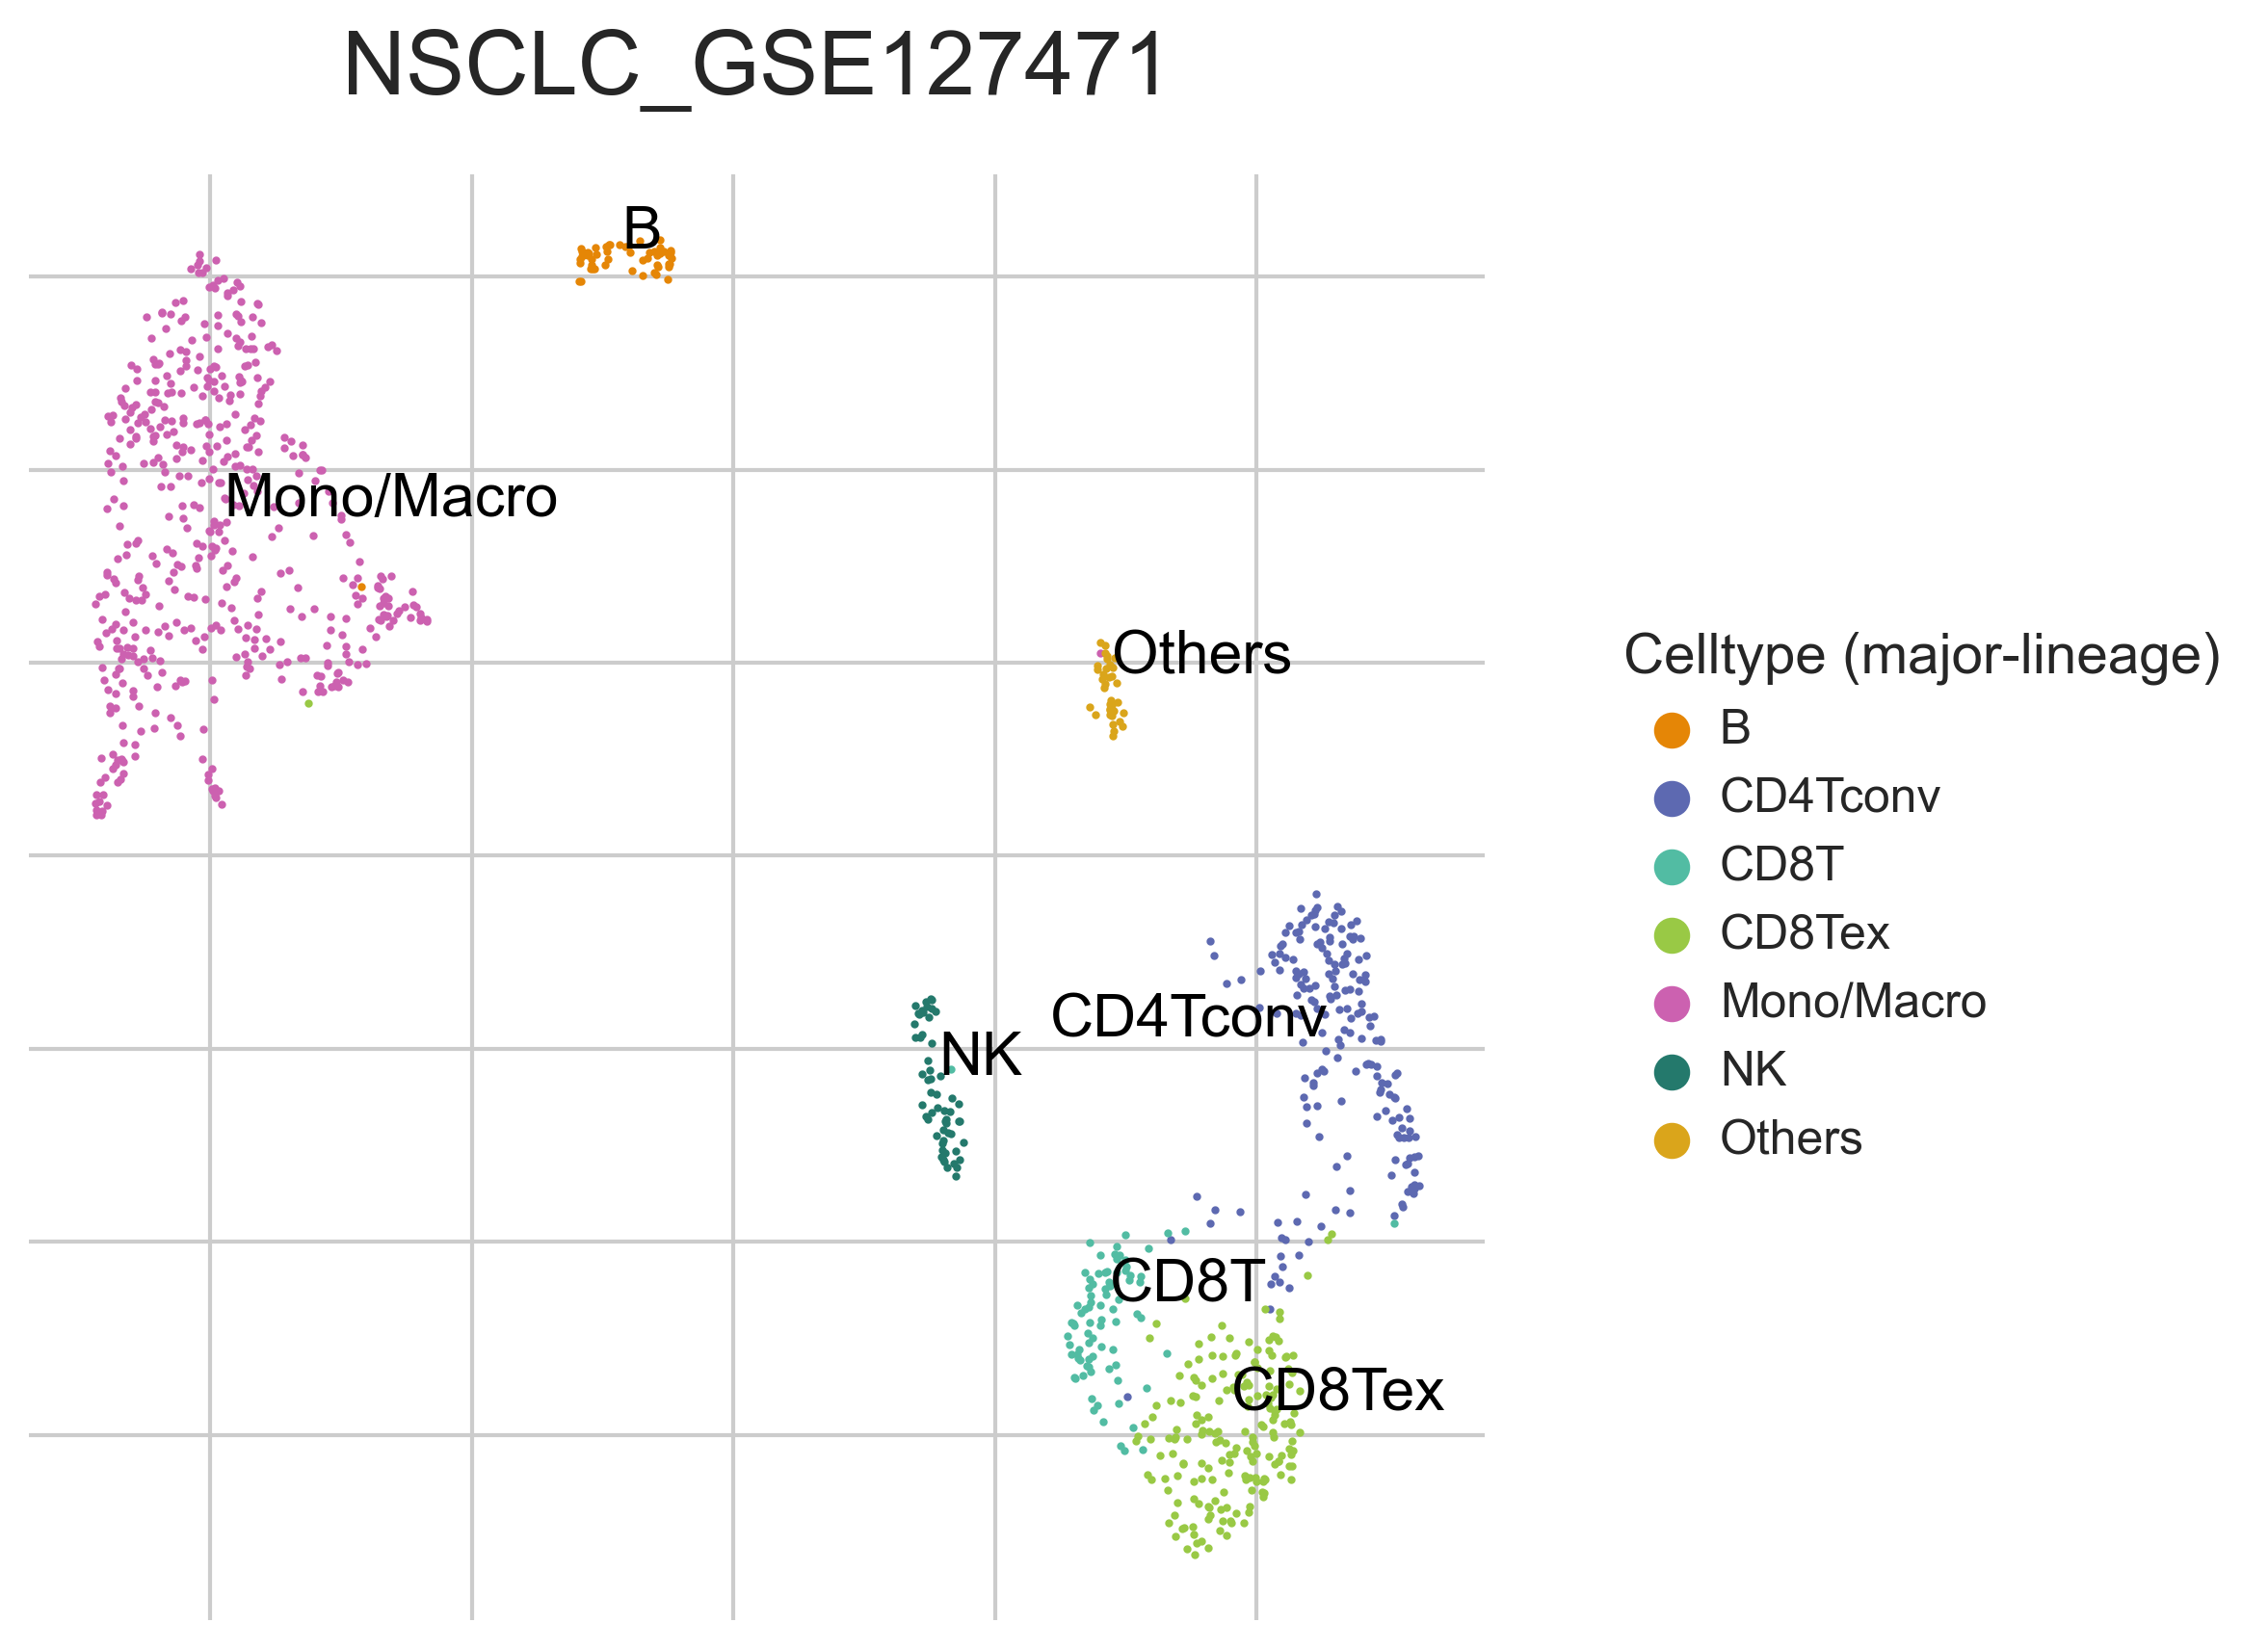
MiRNAs data was downloaded from KM-plotter (https://kmplot.com/ analysis/)[22], and LncRNAs data was obtained from lnCAR database(https:// lncar.renlab.org/explorer)[23]. The single-cell sequencing data of normal lung tissue from 8 mice and 3 humans came from Tabula Muris (https://tabula-muris.ds.czbiohub.org/)[24] and synapse database(https://www.synapse.org/), respectively. While the single-cell sequencing data of NSCLC, including LUAD, resulted from the GEO database (https://www.ncbi.nlm.nih.gov/geo/) and European Molecular Biology Laboratory (EMBL, https://www.ebi.ac.uk/). The databases were included only if they contained single cell RNA sequencing of NSCLC. Finally, we founded 6 valuable datasets. The ScRNA-seq data of EMTAB6149 was prepared from 5 dissected lung tumors[25], while GSE117570 contained scRNA-seq data of tumor-infiltrating immune cells in the early-stage of NSCLC[26]. Besides, GSE127465 contained scRNA-seq data of red blood cell (RBC)-depleted cells from NSCLC tumor and from blood of 7 patients, as well as CD45-positive cells from lungs of 2 healthy mice and 2 lung tumor-bearing mice[27]. GSE127471 data were collected from cryopreserved peripheral blood mononuclear cells of NSCLC and GSE131907 contained data of 208,506 cells derived from 44 patients with LUAD, taken from normal lung tissues, primary tumor, normal lymph nodes, invaded lymph nodes, pleural effusion, and brain metastases[28, 29]. Additionally, GSE139555 contained data of pretreatment samples from 14 NSCLC patients, which covered normal tissue, primary tumor and peripheral blood[30]. The present study meets the criteria of data usage and publishing of the National Cancer Institute of National Institutes of Health, and no approval from the ethics committee was required.
Survival prognosis and clinical factors
The Kaplan–Meier survival analysis with log-rank test was used to compare the survival difference between the above two groups using ‘survival’ (https:// cran.r-project.org/web/packages/survival/index.html) and ‘survminer’ (https:// cran.r-project.org/web/packages/survminer/index.html) R packages. TimeROC analysis was performed to compare the predictive accuracy of each gene and risk score. For Kaplan–Meier curves, p-values and hazard ratio (HR) with 95% confidence interval (CI) were generated by log-rank tests. Univariate and multivariate cox regression analysis were performed to identify the proper terms to build the nomogram. The forest plot was used to display P values, HR and 95% CI of each variable using ‘forestplot’ R package. A nomogram was developed based on the results of multivariate Cox proportional hazards analysis to predict the X-year overall survival (OS). The nomogram provided a graphical representation of the factors, which can be used to calculate the risk of recurrence for an individual by the points associated with each risk factor through ‘rms’ R package (https://cran.r-project.org/web/packages/rms/index.html). All the above analysis methods and R package were implemented by R foundation for statistical computing (2020) version 4.0.3 and ggplot2 (v3.3.2). P value<0.05 was considered statistically significant.
Gene expression atlas based on single-cell sequencing data
We chose the t-distributed Stochastic Neighbor Embedding (t-SNE) algorithm to reduce the dimensionality of the quality-controlled scRNA-seq data of normal lung cell from mouse. Moreover, scRNA-seq data from lung cell atlas and lung cancer brain metastases of human were re-analyzed through the UCSC cell browser (https://cells.ucsc.edu/)[31].To understand the expression of ZC3H12D in different cell types across selected datasets, we applied TISCH (http://tisch.comp-genomics.org/) to obtain the ZC3H12D average expression data from multiple databases[32]. Furthermore, we explored the expression of ZC3H12D in LUAD and other well-characterized NSCLC at single-cell level and identified the distribution of expression of ZC3H12D in different crucial cell-types across datasets.
Screening of co-expressed genes and enrichment analysis
We applied Spearman’s correlation analysis to identify genes that were related to the expression level of ZC3H12D. Those genes with correlation coefficient>0.5, P< 0.01 and FDR < 0.01 were considered as co‐expressed genes for GO functional enrichment analysis and KEGG pathway enrichment analysis. The top 20 categories by GO analysis and top 20 pathways enriched by KEGG analysis were displayed, respectively. The volcano plot and heat map were drawn by LinkedOmics (http://www.linkedomics.org/login.php)[33]and Metascape (http://metascape.org/)[34], and the bubble diagram was drawn by ‘ggplot2’ R package(https://cran.r-project.org/web/packages/ggplot2/index.html).
The immune cell infiltration level and immune molecules expression
To obtain reliable immune infiltration estimations, we utilized the ‘immunedeconv’(https://www.rdocumentation.org/packages/immunedeconv/versions/2.0.0) R package that integrated six state-of-the-art algorithms, including Tumor Immune Estimation Resource (TIMER, http://timer.cistrome.org/)[35]. Besides, immunostimulators and immunoinhibitors were selected and the expression levels (transcripts per kilobase of exonmodel per million mapped reads) of these genes were extracted. The two-gene, and the multi-gene correlation map was displayed using ‘ggstatsplot’ (https://cran.r-project.org/ web/ packages/ggstatsplot/index.html) and ‘pheatmap’ R package, respectively. Additionally, we used Spearman’s correlation analysis to describe the correlations among gene expression. And P<0.05 was considered statistically significant.