Baseline Characteristics
A total of 360 AML patients were enrolled in this study who baseline characteristics as listed in Table 1. The median age of the patient population was 48 years(IQR, 33-59 years), 55% of patients were male(Table 1). The median WBC count was 18.25×10⁹/L(5.54-54.33). The median Hb level was 82.50g/L(66.00-103.25), and median PLT count was 40.50×10⁹/L(19.75-86.25). The median percentages of blasts in PB and BM were 54.00% (21.50-78.00) and 66.00% (45.80-83.28) respectively. The median albumin level was 35.95g/L (32.75-39.52). In total, 70(19.44%), 195(54.17%) and 83(23.06%) patients displayed favorable, intermediate, and poor risk groups, respectively. In total, 21.39% of the patients underwent allo-HSCT.
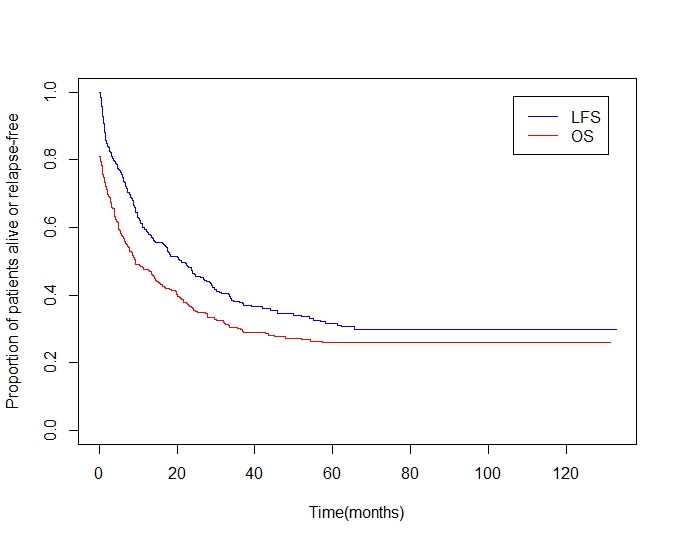
The study was censored on January 22, 2020. The median follow-up time was 15.4 months (range,0.2-132.8). By the time of censor, 65(18.06%) patients did not reach CR after induction and re-induction chemotherapy, 138(38.33%) patients relapsed, and 226(62.78%) patients died. Among them, 28 patients died of induction-related toxic effects, 21 patients died during re-induction chemotherapy, 15 patients died during maintenance and consolidation chemotherapy, 24 patients died of lack of response to induction, 124 patients died of disease-progression, 11 patients died of complications of HSCT and 3 patients died of other reasons(eTable). The unadjusted median DFS was 9.2 months (95% CI, 7.0-14.8), and the unadjusted median OS was 21.2months (95% CI, 16.6-27.6). The 1-year, 2-year, and 3-year DFS percentages were 47.6%(95% CI, 42.6-53.1), 36.0%(95% CI, 31.2-41.5), and 29.8%(95% CI, 25.2-35.3), respectively, while the OS percentages were 59.2%(95% CI, 54.2-64.5), 46.4%(95% CI, 41.4-52.1), and 37.8%(95% CI, 32.8-43.6), respectively(eFigure).
Independent Prognostic Factors
The results of univariate and multivariate analyses of DFS and OS are summarized in Table 2 and Table 3. The univariate and multivariate Cox proportional hazards regression modeling found: age(HR, 1.770; 95%CI, 1.160-2.702; P = 0.008), Hb (HR, 0.634; 95%CI, 0.462-0.870; P = 0.005), albumin (HR, 0.473; 95%CI, 0.363-0.615; P < 0.001) and cytogenetic /molecular risk group (intermediate vs. favorable: HR, 1.614; 95%CI, 1.128-2.309; P = 0.001; poor vs. favorable: HR, 2.459; 95%CI, 1.645-3.676; P < 0.001) at the time of diagnosis, and allo-HSCT treatment (HR, 0.341; 95%CI, 0.234-0.497; P < 0.001) were independent predictors for DFS. Similarly, the following 4 variables were found to be associated with OS: Hb (HR, 0.616; 95%CI, 0.438-0.866; P = 0.005), albumin(HR, 0.448; 95%CI, 0.340-0.591; P < 0.001), cyto/molecular risk group(intermediate vs. favorable: HR, 1.558; 95%CI, 1.068-2.275; P = 0.021; poor vs. favorable: HR, 2.348; 95%CI, 1.523-3.620; P < 0.001), and allo-HSCT treatment(HR, 0.256; 95%CI, 0.166-0.396; P < 0.001). Although the association of age and OS was not significant (HR, 1.528; 95%CI 0.980-2.382; P = 0.061), age was still selected as candidate for nomogram due to its clinical importance [5].
Development and Validation of Nomograms
Nomograms to predict 1-year, 2-year and 3-year DFS and OS of patients with non-M3 AML are shown in Figure 1. The nomograms were constructed based on the 5 variables described above (Table 2 and Table 3). Total points, calculated from the sum of the allocated number of points for each variable in the nomograms, were corresponding to specific prognoses at 1 year, 2 years and 3 years. For example, a 45-year-old patient undergoing allo-HSCT, with an intermediate karyotype, a hemoglobin level of 94g/L and a serum albumin level of 33.9g/L, would have a total of 155 points(0 point for age, 41 points for hemoglobin<100g/L, 70 points for albumin<35g/L, 44 points for intermediate risk group, 0 point for allo-HSCT), for a predicted 1-year, 2-year and 3-year DFS of 59.3%, 45.1% and 37.5%, respectively (Figure 1A).
The discriminative abilities of the nomograms for DFS and OS were evaluated by C-index (0.715 for DFS and 0.731 for OS). To further evaluate the discriminative abilities, the Kaplan-Meier curves of DFS and OS were displayed in Figure 2. Patients with the lowest total points (quartile-4) had a worse DFS (p <0.001; Figure 2A) and OS(p <0.001; Figure 2B), compared to quartile-1, -2 and -3. Specifically, the 3-year DFS proportion of quartile-1, -2, -3 and -4 was 57.1%(95%CI,46.3-70.5%), 34.3%(95%CI,26.1-44.9%), 19.4%(95%CI,11.3-33.4%) and 7.0%(95%CI,3.1-15.8%), respectively(Figure 2A). While the 3-year OS proportion of quartile-1, -2, -3 and -4 was 68.6%(95%CI,58.0-81.1%), 43.1%(95%CI,34.5-53.9%), 28.6%(95%CI,19.2-42.8%) and 10.14%(95%CI,4.8-21.2%), respectively. The accuracy of models was also evaluated by bootstrap validation with 350 resamplings. The 116-sample bootstrapped calibration curves for prediction of 3-year DFS and OS graphically showed good agreement (Figure 3).