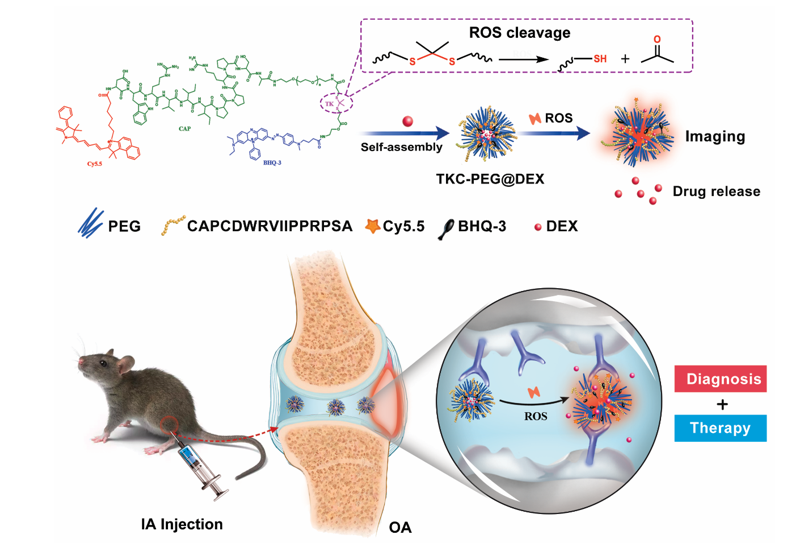
Synthesis of ROS-responsive polymer
Here, thioketal were synthesized via their reaction with 3-mercaptopropionic acid and acetone. The fluorescent monomer (Cy5.5-CAP) was synthesized following a route as shown in Figure S1. BHQ-3 was chosen as a quencher and co-polymerized with a ROS-cleavable thioketal-containing linker to prepare the PEG-TK-BHQ-3 (Figure S2-3). The detailed preparation protocols of ROS-responsive polymers are presented in the Supporting Information and verified by 1H NMR spectra.
Characterization
The morphology of TKC-PEG and TKC@DEX was measured by transmission electron microscopy (TEM) (Bruker, Germany). The particle size distribution and zeta potential of the TKC-PEG and TKC@DEX were recorded using a dynamic light scattering (DLS) (Malvern, UK). The DLS was used to investigate the stability of TKC-PEG incubated in PBS or in different concentrations of KO2 (0 µM, 50 µM and 100 µM) with or without ROS inhibitor (N-acetyl-L-cysteine, NAC) for 0, 1, 2, 4, 8 and 24 h. The Ultraviolet–visible (UV-VIS) absorbance spectra of Cy5.5, BHQ-3 and TKC-PEG were detected by a microplate reader (Thermo Fisher Scientific, USA).
Fluorescent recovery of TKC-PEG
The TKC-PEG solution was added to different concentrations of KO2 (0 µM, 50 µM and 100 µM) with or without ROS inhibitor (N-acetyl-L-cysteine, NAC) and then incubated at 37°C for 1, 2, 4, 8 and 24 h, respectively. The fluorescence signals were captured by using In-vivo Multispectral Imaging Systems (Bruker, Germany).
DEX loading
20 mg of nanoparticles was dispersed in 0.5 mL tetrahydrofuran (THF), followed by the addition of 10 mg DEX (dissolved in 0.5 mL tetrahydrofuran). Then 10 mL deionized water with a syringe was slowly added in to the mixture. The mixture was moved to a dialysis bag (MWCO 3400, Sigma, USA) to dialyze with deionized water for 24 h to remove the unloaded drug. At last, the dried solid micelles were obtained by lyophilization. The drug loading and embedding ratio were measured by the High Performance Liquid Chromatography (HPLC) (Shimadzu, Japan), and then calculated by the following formula using:
Drug loading (%) = weight of DEX entrapped/weight of nanoparticles × 100% (1)
Embedding ratio (%) = weight of DEX entrapped/weight of DEX feeding × 100% (2)
DEX release study
The DEX release profiles of TKC@DEX NPs were determined by dialysis membrane method. Briefly, TKC@DEX NPs were placed in dialysis bags and immersed in 15 mL four different buffers: (1) PBS only; (2) PBS with 50 µM KO2; (3) PBS with 50 µM KO2 and its inhibitor; (4) PBS with 100 µM KO2. KO2 was selected as a reagent to simulate the ROS microenvironment[24]. All solutions containing 1% tween 80 were shook constantly at 37°C. At each time point (0, 1, 2, 4, 12 and 24 h), 1 mL of aliquots was removed from the release media and 1 mL of the same buffer was supplemented. The concentration of DEX release from TKC@DEX NPs was measured by HPLC. The procedures were performed in triplicate.
Chondrocytes isolation and culture
Chondrocytes were isolated from the knee joints of 3-day-old C57BL6/J mice (the Animal Experimental Center of Guangxi Medical University, Nanning, China) by enzymatic digestion in aseptic conditions according to previous report[35]. Firstly, articular cartilages were digested in trypsin (Gibco, USA) for 40 min at 37°C and then minced and digested with 2 mg/mL collagenase II for 3 h at 37°C. Secondly, the chondrocytes were centrifuged at 1000 rpm for 5 min and then suspended in DMEM medium containing 10% fetal bovine serum (FBS, Gibco, USA), 1% penicillin and streptomycin (Solarbio, China). Then, they were transferred into a culture flask and cultured at 37°C in a 5% CO2-humidified incubator. The third generation of cells was collected for further experiments.
In vitro cytotoxicity assay
The cytotoxicity of TKC-PEG and TKC@DEX in chondrocytes was determined by Cell Counting Kit-8 (CCK-8, Japan). Briefly, cells were incubated in medium containing various concentrations of TKC-PEG (0, 3, 6, 12, 25, 50, 100, 200 µg/mL) or TKC@DEX (0, 3, 6, 12, 25, 50, 100, 200 µg/mL) for 24 and 48 h. Afterward, each well was added with 10 µL CCK-8 and incubated for 4 h in humidified incubator. The absorbance of solutions was detected at a wavelength of 450 nm by a microplate reader (Thermo Fisher Scientific, USA). CCk-8 assay was also used to assess the cell viability of MIA-induced chondrocytes after treatment with DEX, CAP@DEX, TK@DEX, or TKC@DEX for 24 h.
Hemolysis test
The hemolysis ratio of TKC@DEX at various concentrations (50, 100, 200, 400, 800 μg/mL) was performed in vitro[36]. The TKC@DEX samples were dissolved in PBS at 37°C. Then 20.0 μL of erythrocyte dispersion was added into the TKC@DEX solution (1.0 mL) and the mixture was incubated for 1 h at 37 °C. After centrifuged at 2000 rpm for 10 min, the hemoglobin in supernatant was measured using a microplate reader at 415 nm. The positive and negative controls were determined by replacing the sample solution with ultrapure water and PBS, respectively. Experiments were performed for three times and the hemolysis rate (%) was calculated using following equation: (As − An) / (Ap − An) × 100, where As, An, and Ap mean absorbencies of the sample, negative control and positive control, respectively.
Intracellular ROS detection and bioimaging
We used monosodium iodoacetate (MIA), an inhibitor of glyceraldehyde-3-phosphate dehydrogenase activity, to induce oxidative stress injure and the pathological OA symptoms of chondrocytes[37]. Chondrocytes were seeded into 6-well or 24-well plates and divided into four groups: (1) control: chondrocytes cultured with medium only; (2) MIA 3 µM: chondrocytes induced with 3 µM MIA for 24 h; (3) MIA + inhibitor: chondrocytes pretreated with 5 mM NAC [38] (N-acetylcysteine, the antioxidant which can significantly prevent the production of ROS) for 1 h followed by addition with 3 µM MIA for 24 h; (4) MIA 6 µM: chondrocytes induced with 6 µM MIA for 24 h. Intracellular ROS production was determined by using a fluorescent 2,7-dichlorodihydrofluorescein diacetate (DCFH-DA) kit. Chondrocytes were harvested, and incubated with DCFH-DA (10 µM) for 20 min in the dark at 37°C. The chondrocytes were then washed three times with serum-free medium, and immediately detected by flow cytometer (BD, Biosciences, USA)[39]. The ROS generation of normal chondrocytes was also measured. Meanwhile, to reduce the production of ROS induced by MIA, chondrocytes were pretreated with 5 mM NAC for 1 h, follow by the addition of 3 µM MIA for 24 h, then intracellular ROS was detected.
In addition, cellular uptake and degradation of TKC-PEG NPs induced by endogenous ROS were investigated. After treated with MIA, the chondrocytes were incubated with TKC-PEG NPs for 4 h, and then they were washed with PBS and fixed with 95% ethanol for 30 min. Meanwhile, MIA (3 µM) treated cells were also incubated with CAP-PEG and TK-PEG NPs as controls. Then the chondrocytes were stained with immunofluorescence of COL2A1 (1:200, Boster) and nuclei was counterstained with DAPI. Finally, the fluorescence images were photographed using a fluorescence inversion microscope (OLYMPUS, Japan).
MIA-induced chondrocytes and treatment
Chondrocytes were seeded into 24-well or 6-well plates and separated into five groups: (1) control: chondrocytes cultured with medium only; (2) MIA: chondrocytes induced with 3 µM MIA; (3) MIA + DEX: chondrocytes pretreated with 3 µg/mL DEX for 1 h followed by addition with 3 µM MIA for 24 h; (4) MIA + TK@DEX: chondrocytes pretreated with TK@DEX (an equivalent DEX dose of 3 µg/mL) for 1 h followed by addition with 3 µM MIA for 24 h; (5) MIA + CAP@DEX: chondrocytes pretreated with CAP@DEX (an equivalent DEX dose of 3 µg/mL) for 1h followed by addition with 3 µM MIA for 24 h; (6) MIA + TKC@DEX: chondrocytes pretreated with TKC@DEX (an equivalent DEX dose of 3 µg/mL) for 1h followed by addition with 3 µM MIA for 24 h.
Quantitative real-time polymerase chain reaction (RT-qPCR) analysis
The primer sequences for the OA-related genes are listed in Table 1. Total RNA was isolated using an RNA isolation kit (Tiangen Biotechnology, China). Then a reverse transcription kit (Takara, Japan) was used to reversely transcribe RNA to cDNA. Real-time PCR was conducted by a Light Cycle 96 system for 10 min at 95°C, 15 s at 95°C, and 60 s at 60°C. The relative gene expression levels were calculated using the 2−ΔΔCT method with β-actin as the control.
Immunofluorescence.
The expression of OA catabolic biomarkers IL-6 and MMP-13 in chondrocytes was assessed by immunofluorescence. Chondrocytes were fixed with 95% ethanol for 30 min and permeabilized with 0.1% Triton X-100 for 10 min. Samples were incubated with primary antibody as follows: IL-6 (1:200, Boster, China), and MMP-13 (1:200, Boster) at 4°C overnight. Then the samples treated with the secondary antibodies FITC-anti-rabbit IgG (1:50, Boster) for 60 min at 37°C and counterstained with DAPI for 5 min. Finally, the fluorescence images were photographed using a fluorescence inversion microscope (OLYMPUS, Japan).
OA model and treatment.
All animal experiments were approved by the Ethics Committee of Guangxi Medical University. A total of 60 C57BL6/J (8 weeks old, male) were obtained for this experiment. To induce OA, mice received a single IA injection of 0.05 or 0.1 mg of MIA (Sigma, USA) after anesthesia[40–42]. After induction of OA model, the mice were randomly sorted into five groups (n = 6): PBS group, IA injections of 50 µL PBS; DEX group, IA injections of 50 µL PBS with DEX (1 mg/kg); CAP@DEX group, IA injections of 50 µL PBS with CAP@DEX (an equivalent DEX dose of 1mg/kg); TK@DEX group, IA injections of 50 µL PBS with TK@DEX (an equivalent DEX dose of 1 mg/kg) and TKC@DEX group (an equivalent DEX dose of 1 mg/kg). IA injections were performed twice a week. The rats in these groups were sacrificed for further analysis at 2 and 4 weeks after therapy.
In vivo NIR bioimaging
For in vivo bioimaging, mice were anesthetized by isoflurane. Each group of OA mice (n = 6) was IA injected with 50 µL of 400 µg/mL TKC-PEG, CAP-PEG or TK-PEG, and the normal mice (n = 6) were also IA injected with TKC as control. The images were captured by an In-vivo Multispectral Imaging Systems (Bruker, Germany) at 0, 1, 2, 4, 7 and 14 d.
In addition, the fluorescence intensity of the TKC was also investigated. The mice were randomly sorted into three groups (n = 6): 0.05 mg MIA + inhibitor group, IA injection of 0.05 mg MIA concomitant with 5 mM NAC; 0.05 mg MIA group, IA injection of 0.05 mg MIA; 0.1 mg MIA group, IA injection of 0.1 mg MIA[43, 44]. Finally, the mice were sacrificed and the macroscopic evaluations of joints were performed.
Macroscopic observation
After 2 weeks or 4 weeks of treatment, the knee joints of mice were harvested for macroscopic evaluation according to the macroscopic scoring system (scale of 0–4) by three independent observers[45].
Histological analysis.
The joints were fixed in 4% paraformaldehyde and subsequently decalcified with a 14% ethylenediaminetetraacetic acid (EDTA) solution for ten days. Next the joints were embedded in paraffin and cut into 5 µm thick slices by sharp blade. HE (Solarbio, China) and safranin O-fast green (Solarbio, China) staining were performed for histomorphological analysis. The severities of OA were graded by three independent observers by using the Osteoarthritis Research Society International (OARSI) score (scale of 0–24)[46]. Furthermore, Immunohistochemical staining for MMP13 (1:200, Boster) was performed to evaluate the anti-inflammatory effects of the probes.
Statistical Analysis.
All data are presented as the mean ± SD, and p < 0.05 was considered statistically significant. The significant differences among groups were evaluated by one-way ANOVA. Statistical analyses were conducted using SPSS statistics (SPSS 19.0).