Comparison of the gut microbiota profiles between AGM_N, CM, RM
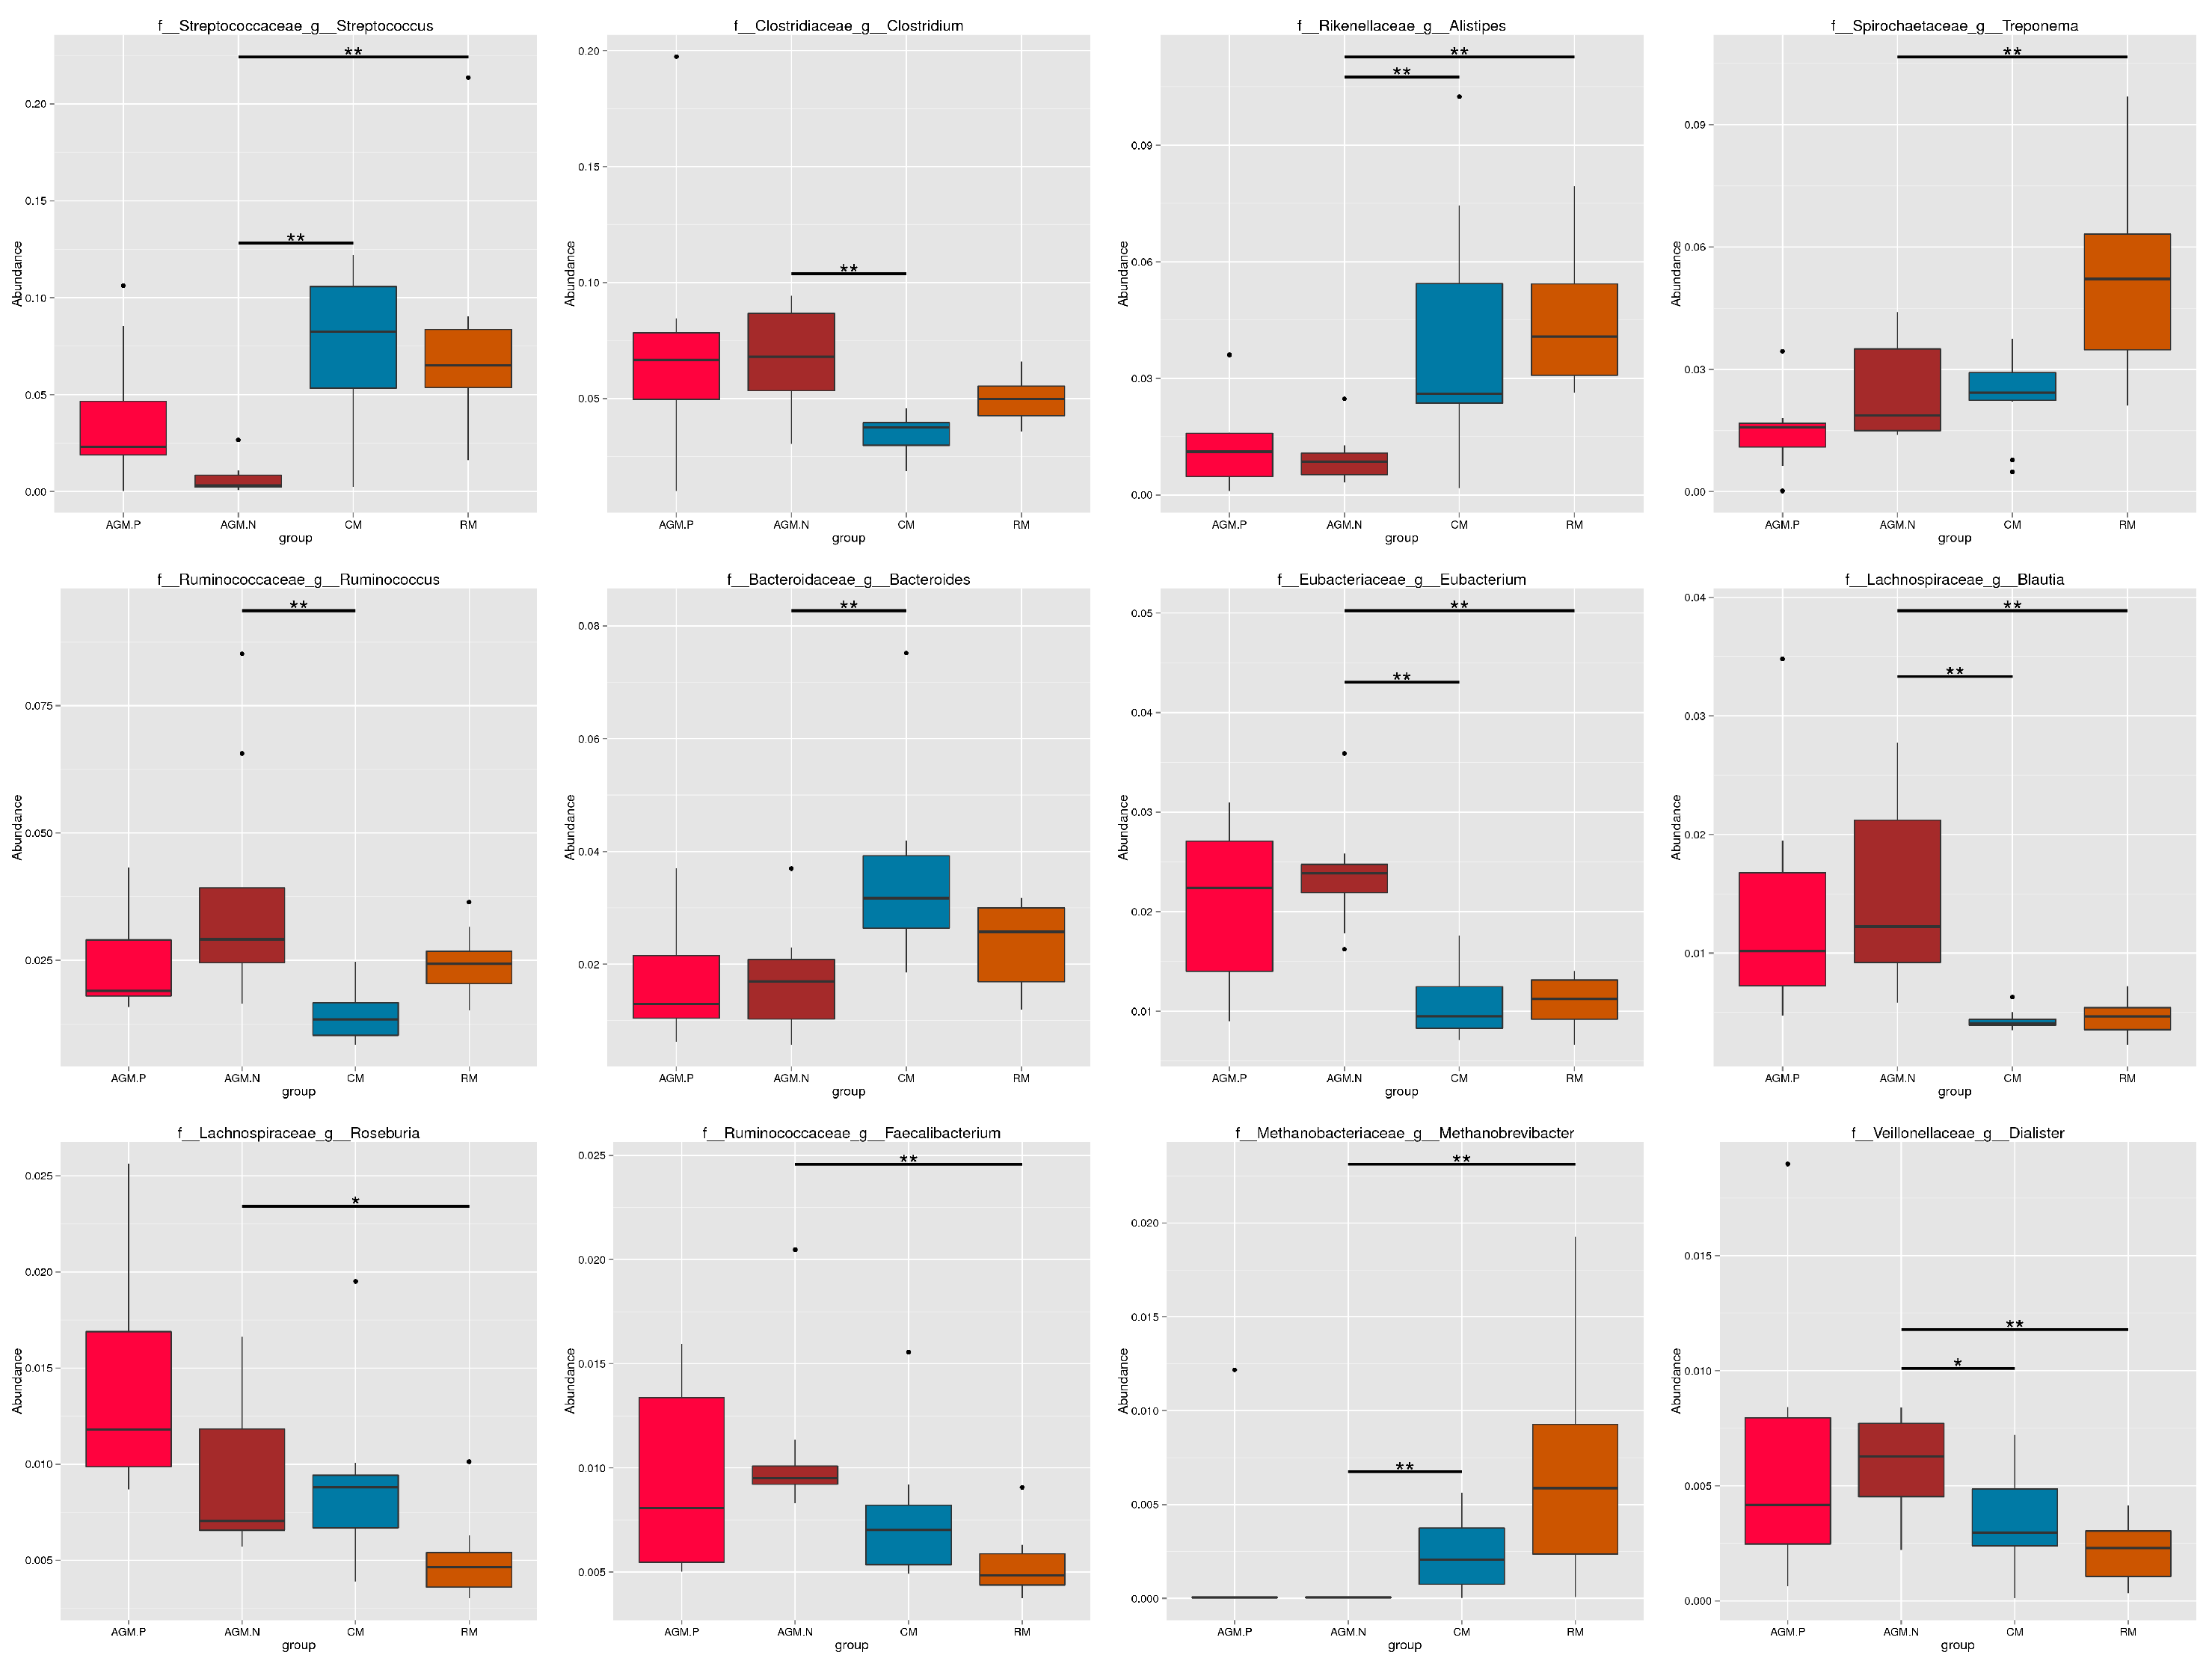
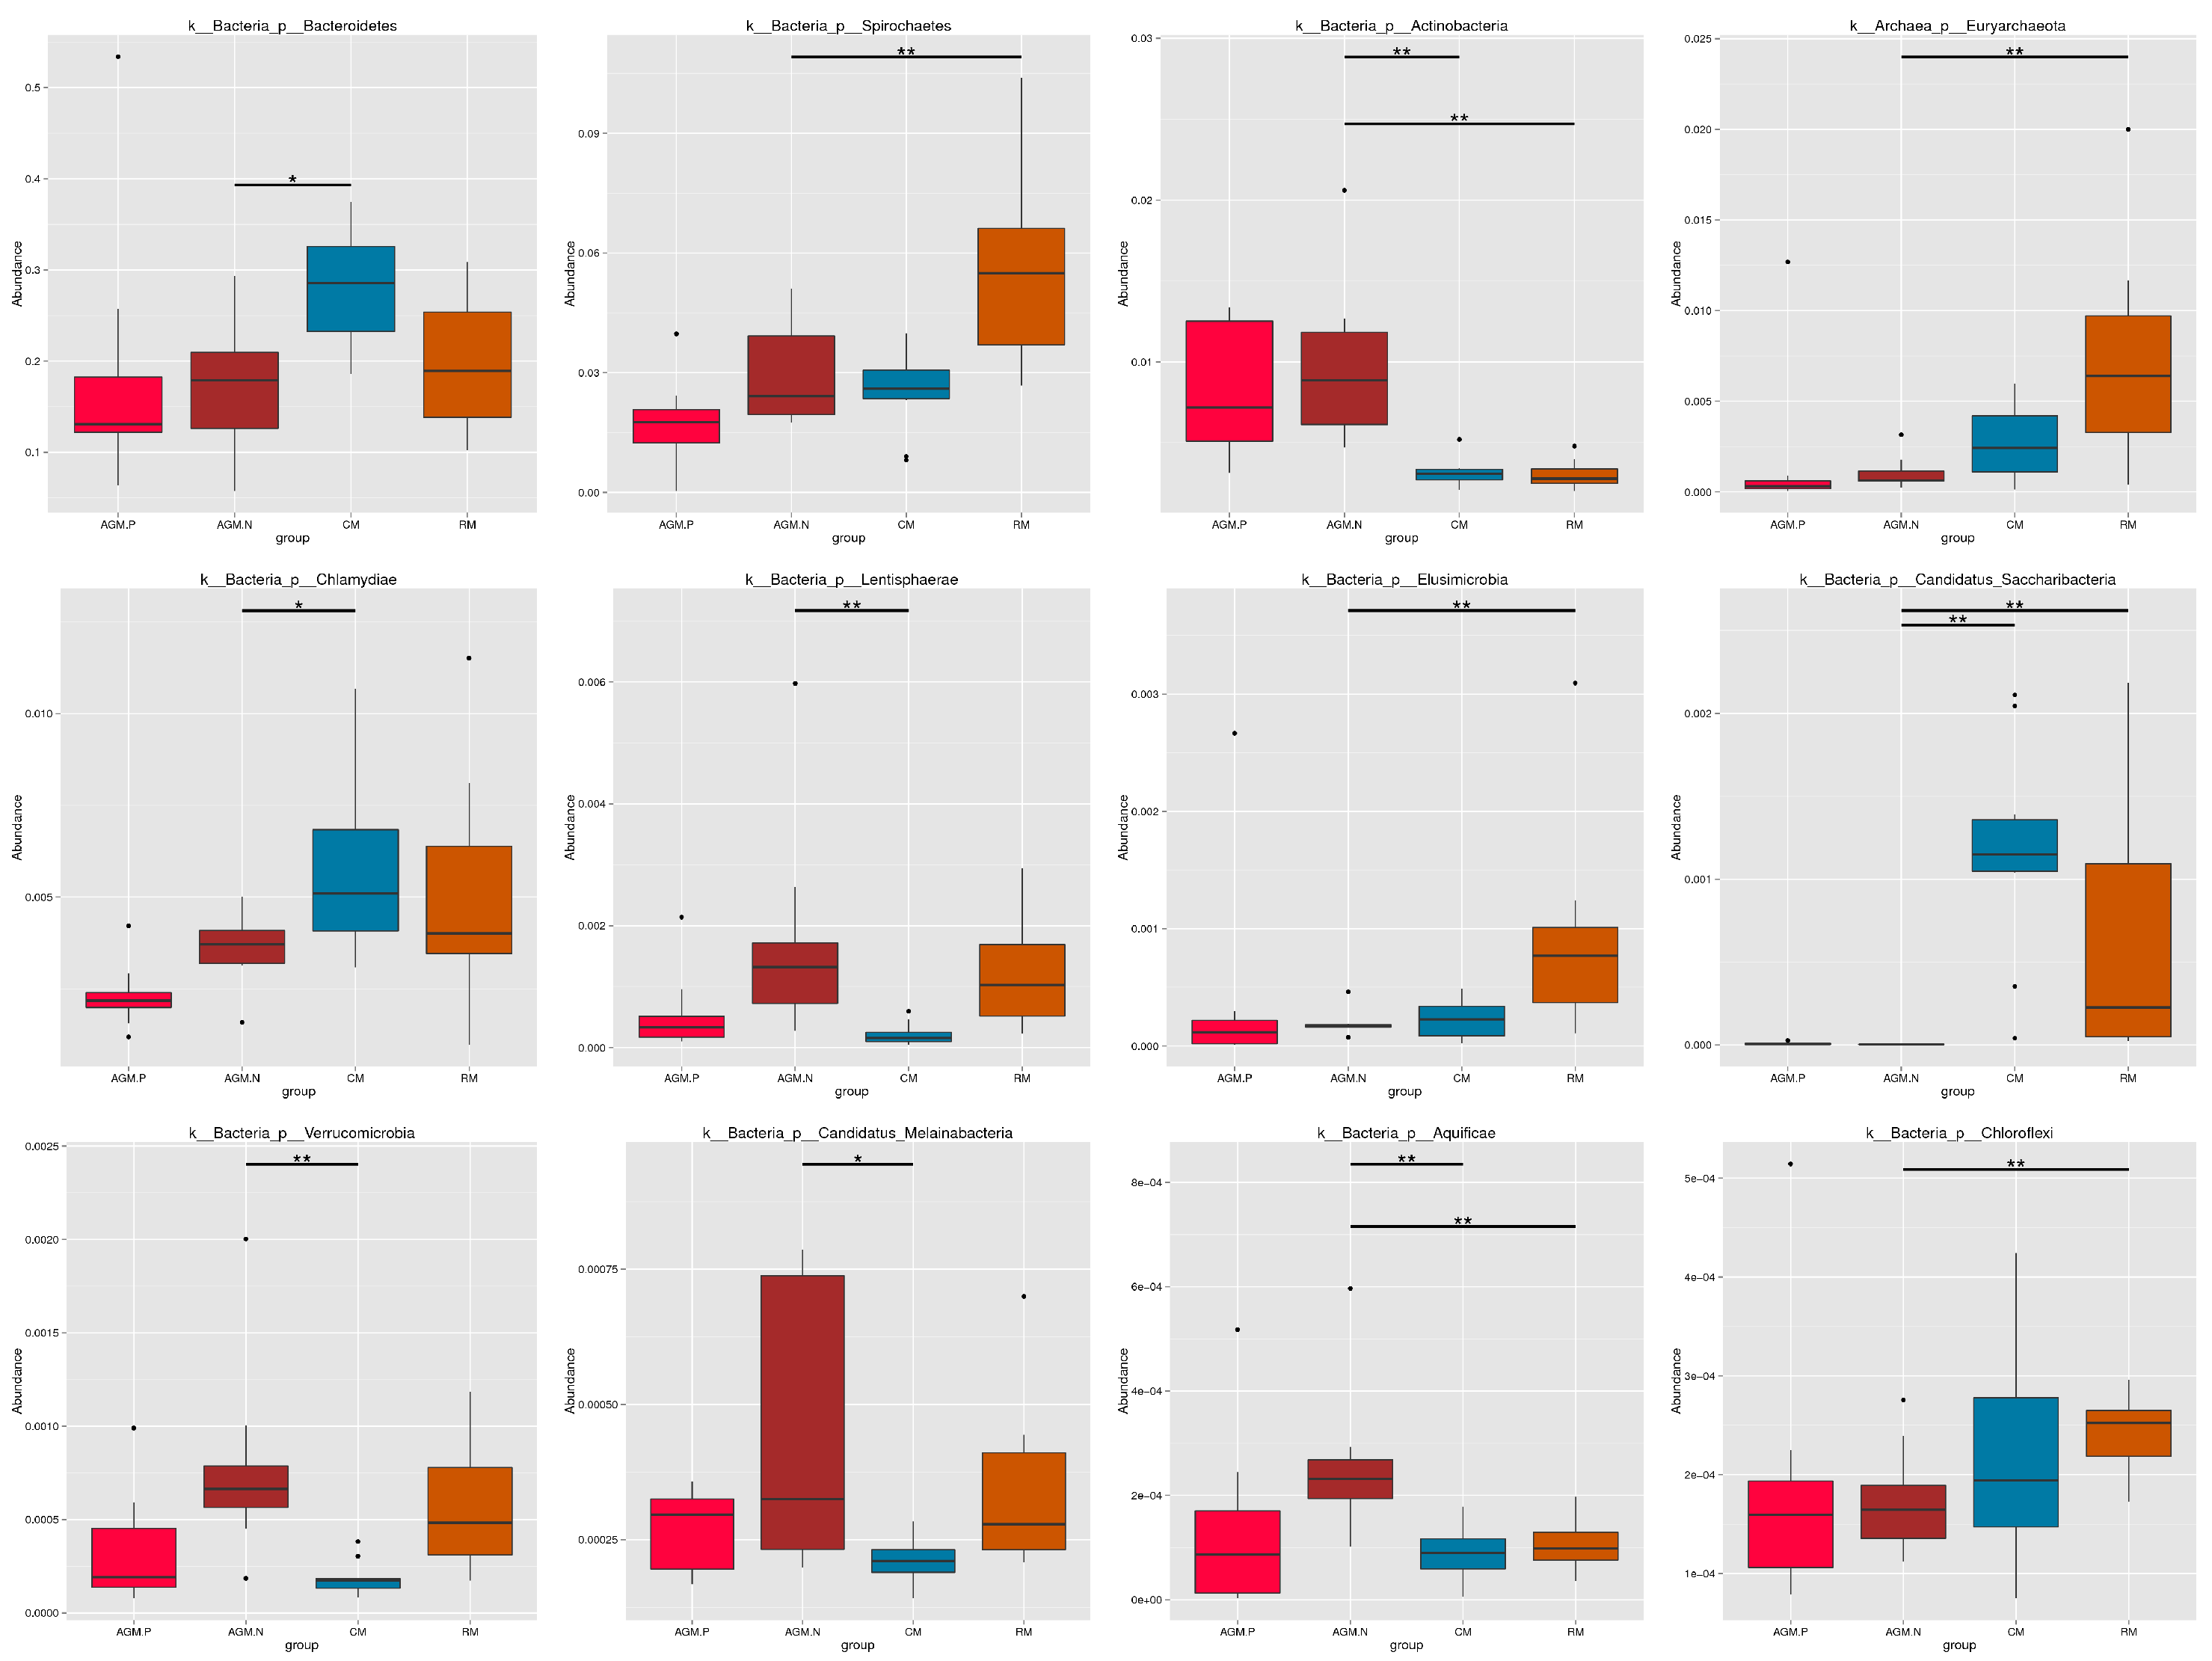
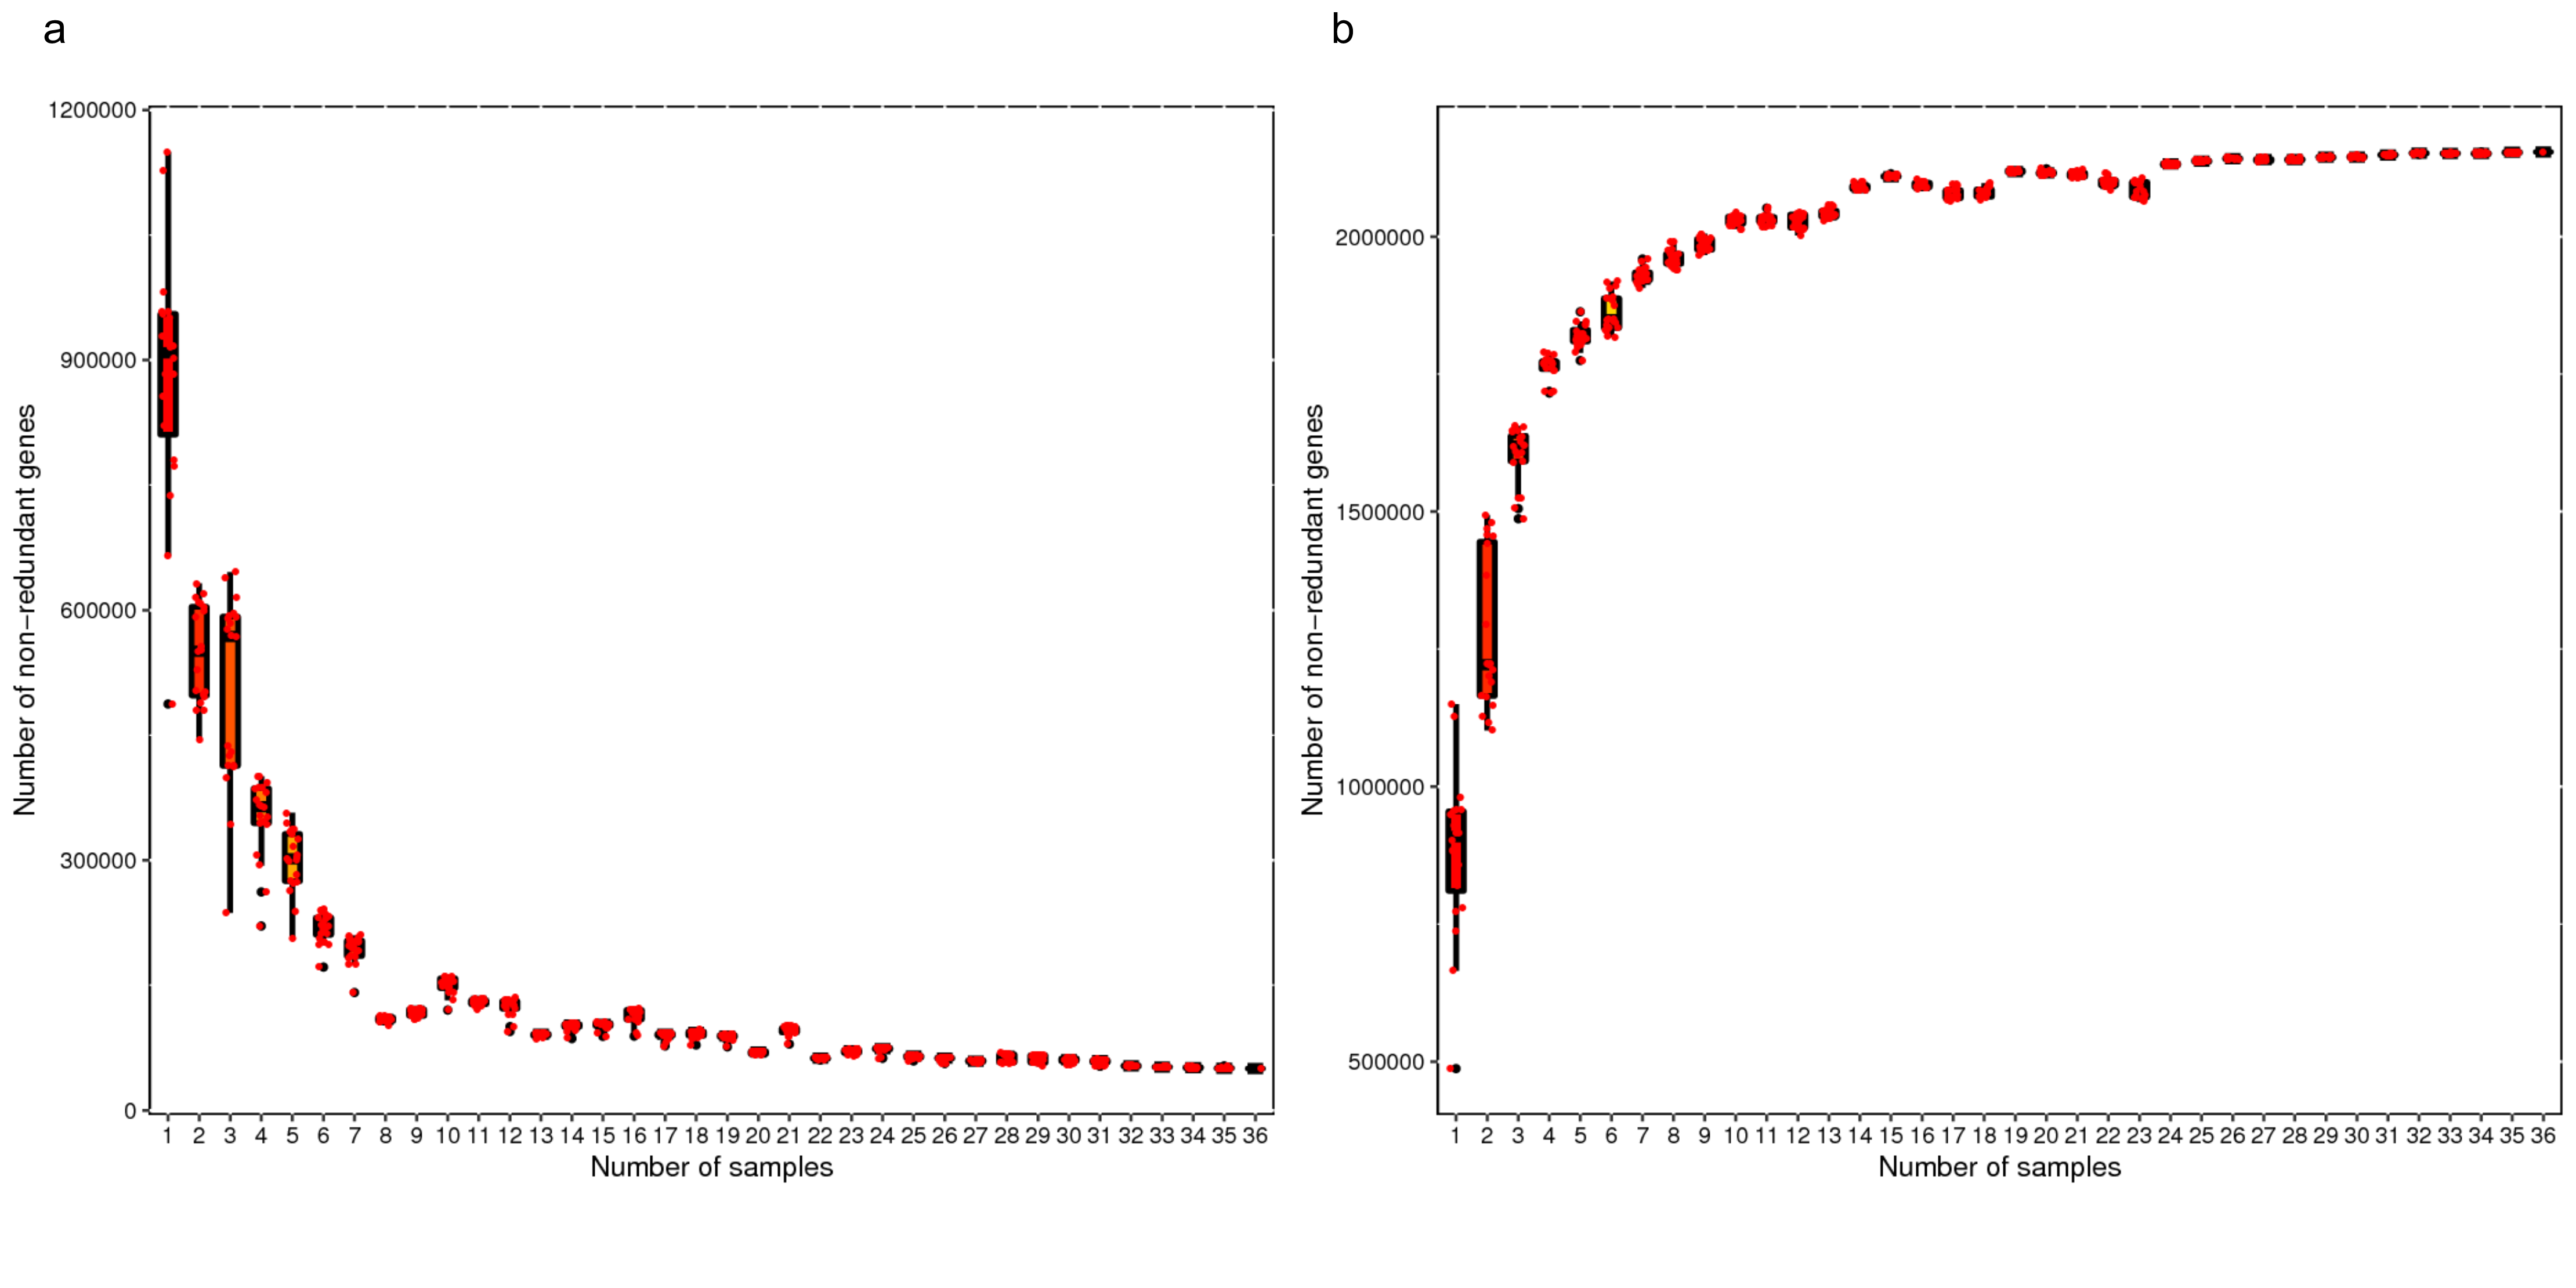
Rarefaction analysis based on the core and pan gene numbers of the samples was performed which both demonstrated a curve approaching saturation (Fig.S1). Based on taxonomical annotation, composition of the microbiota at the phylum level varied with a higher abundance of Bacteroidetes in CM, a higher abundance of Spirochaetes in RM, and a higher abundance of Actinobacteria in AGM_N (Fig.S2). Composition of the microbiota at the genus level also varied between different groups (Fig. 1&S3). Compared with CM and RM, significant decrease in the abundances of Streptococcus, Alistipes, Treponema, Bacteoides, Methanobrevibacter, Methanobrevibacter (P < 0.01), as well as significant increase in the abundances of Clostridium, Eubacterium, Blautia, Roseburia, Faecalibacterium, Dialister (P < 0.01) were demonstrated in AGM_N (Fig. 1&S3). Cluster analysis of the relative abundances of the microbiota species at the genus level by the Bray-Curtis distances was shown in Fig. 2.
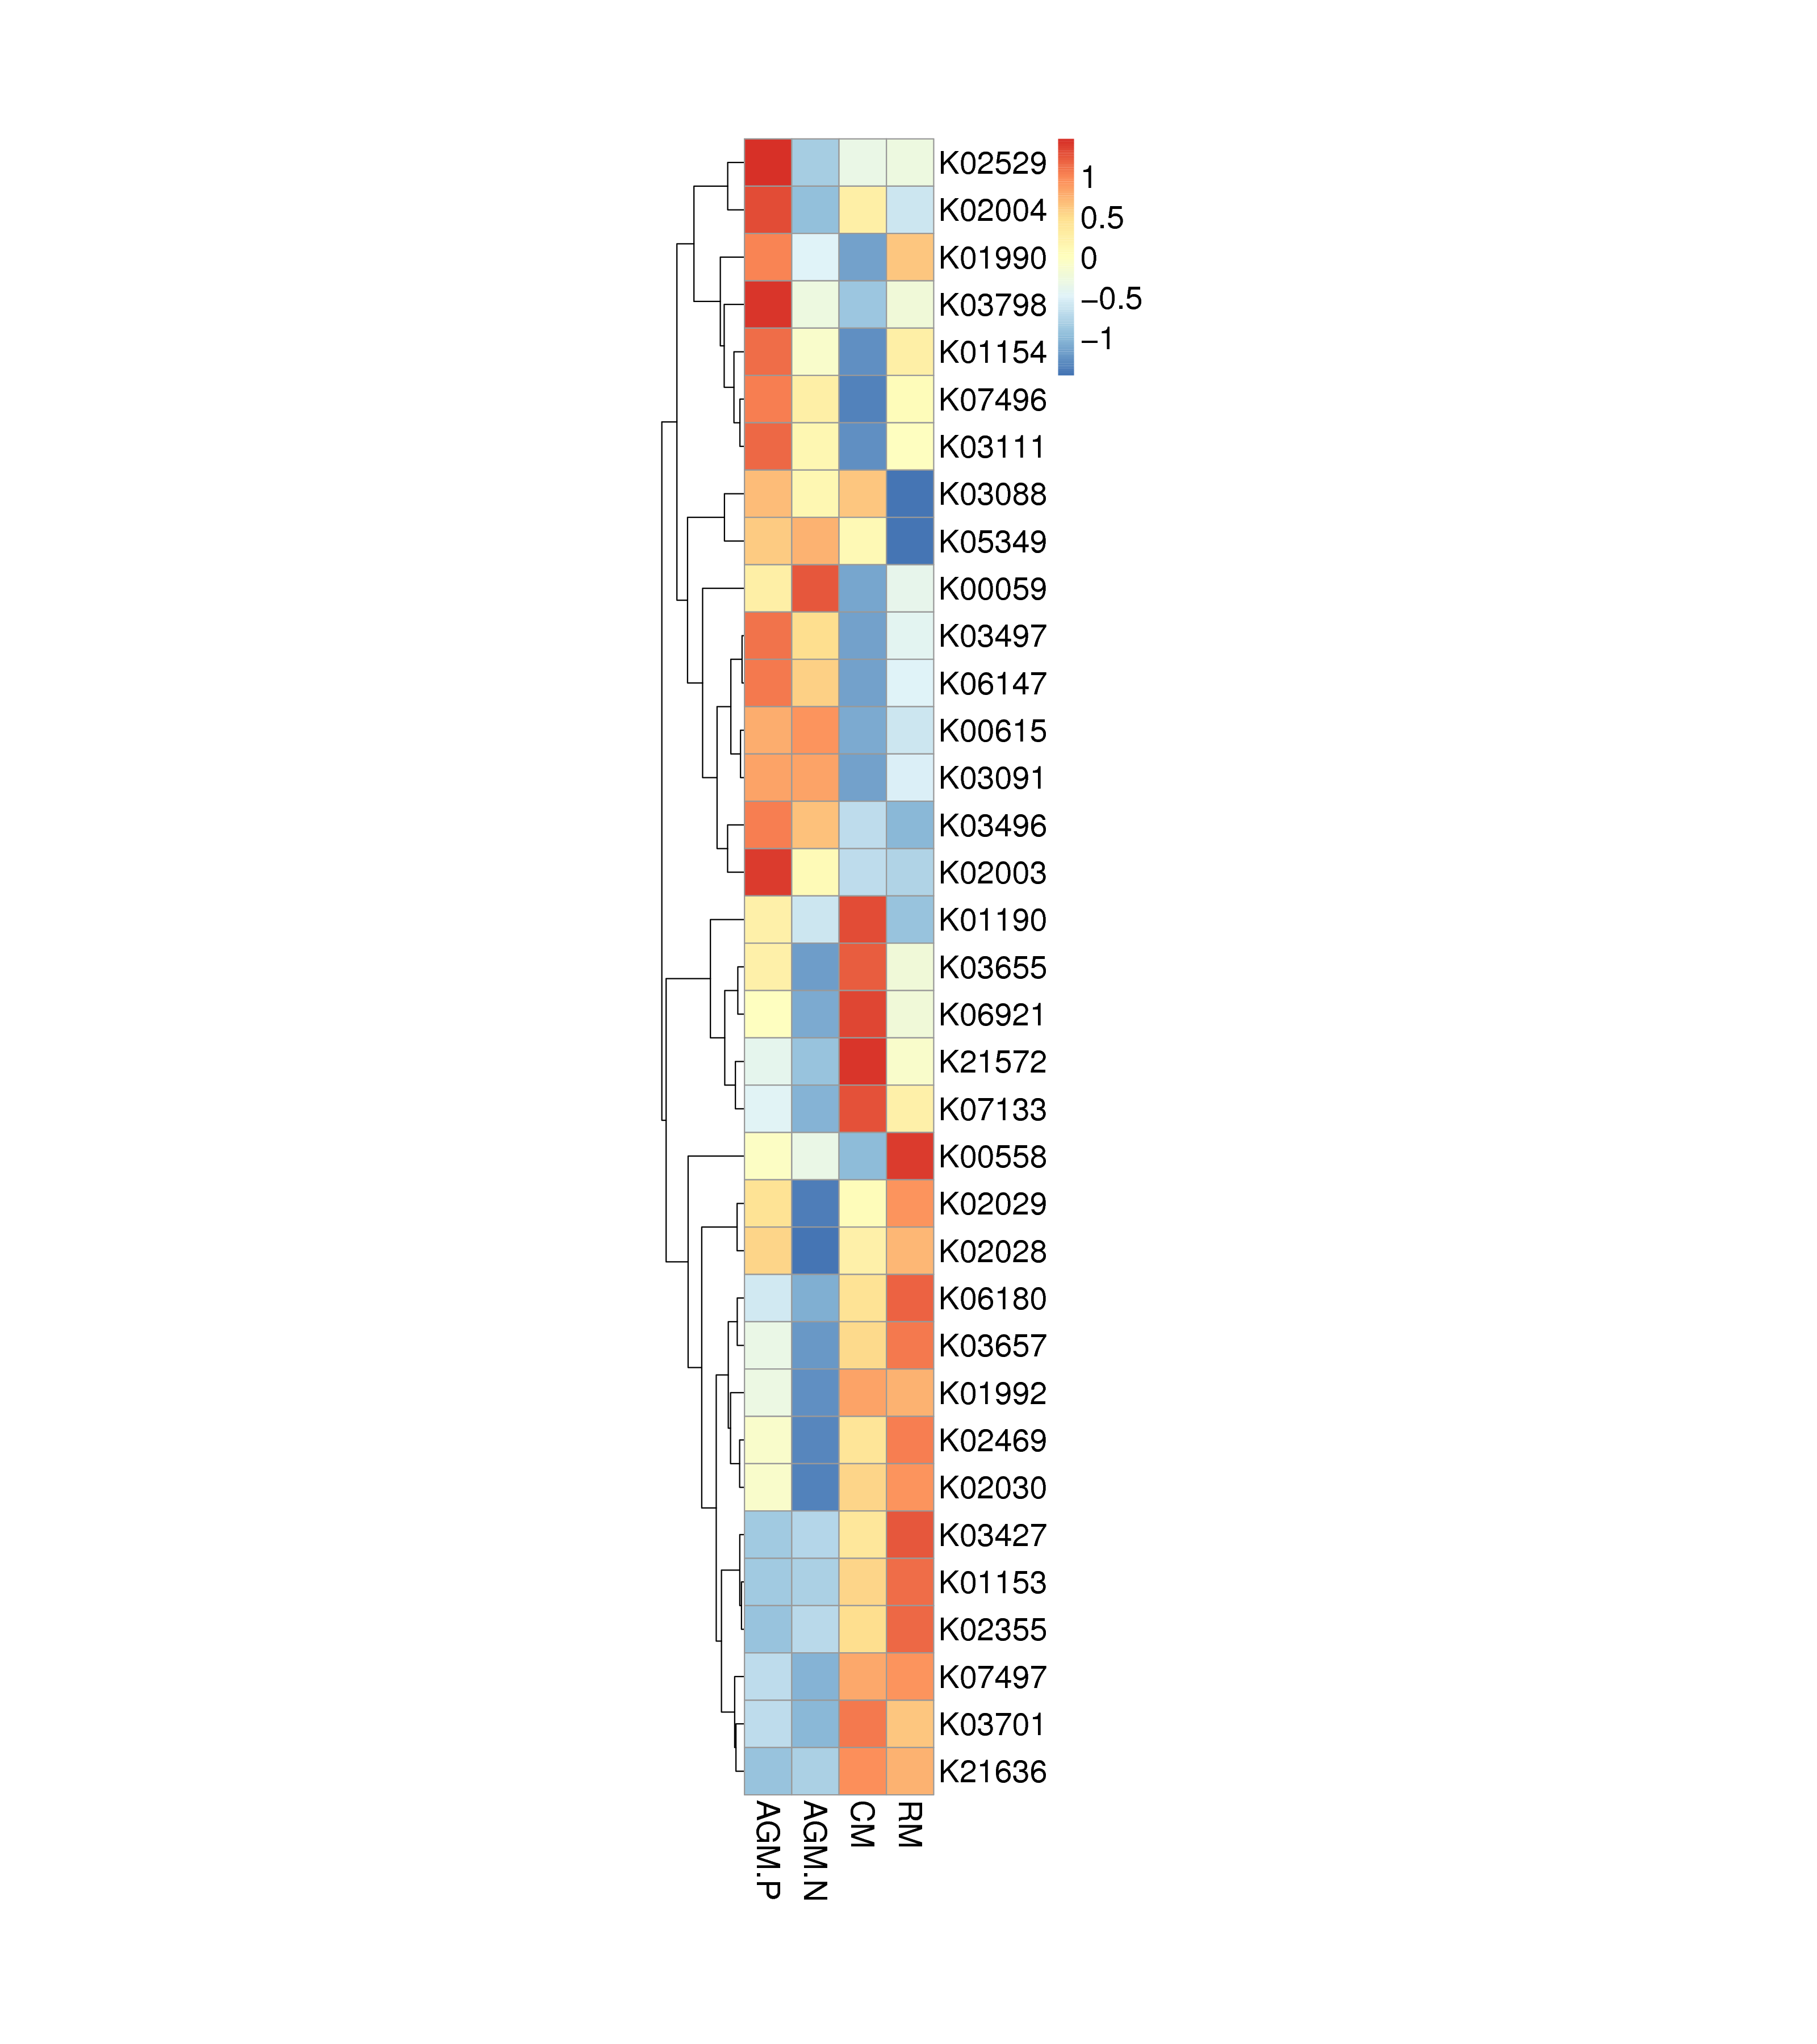
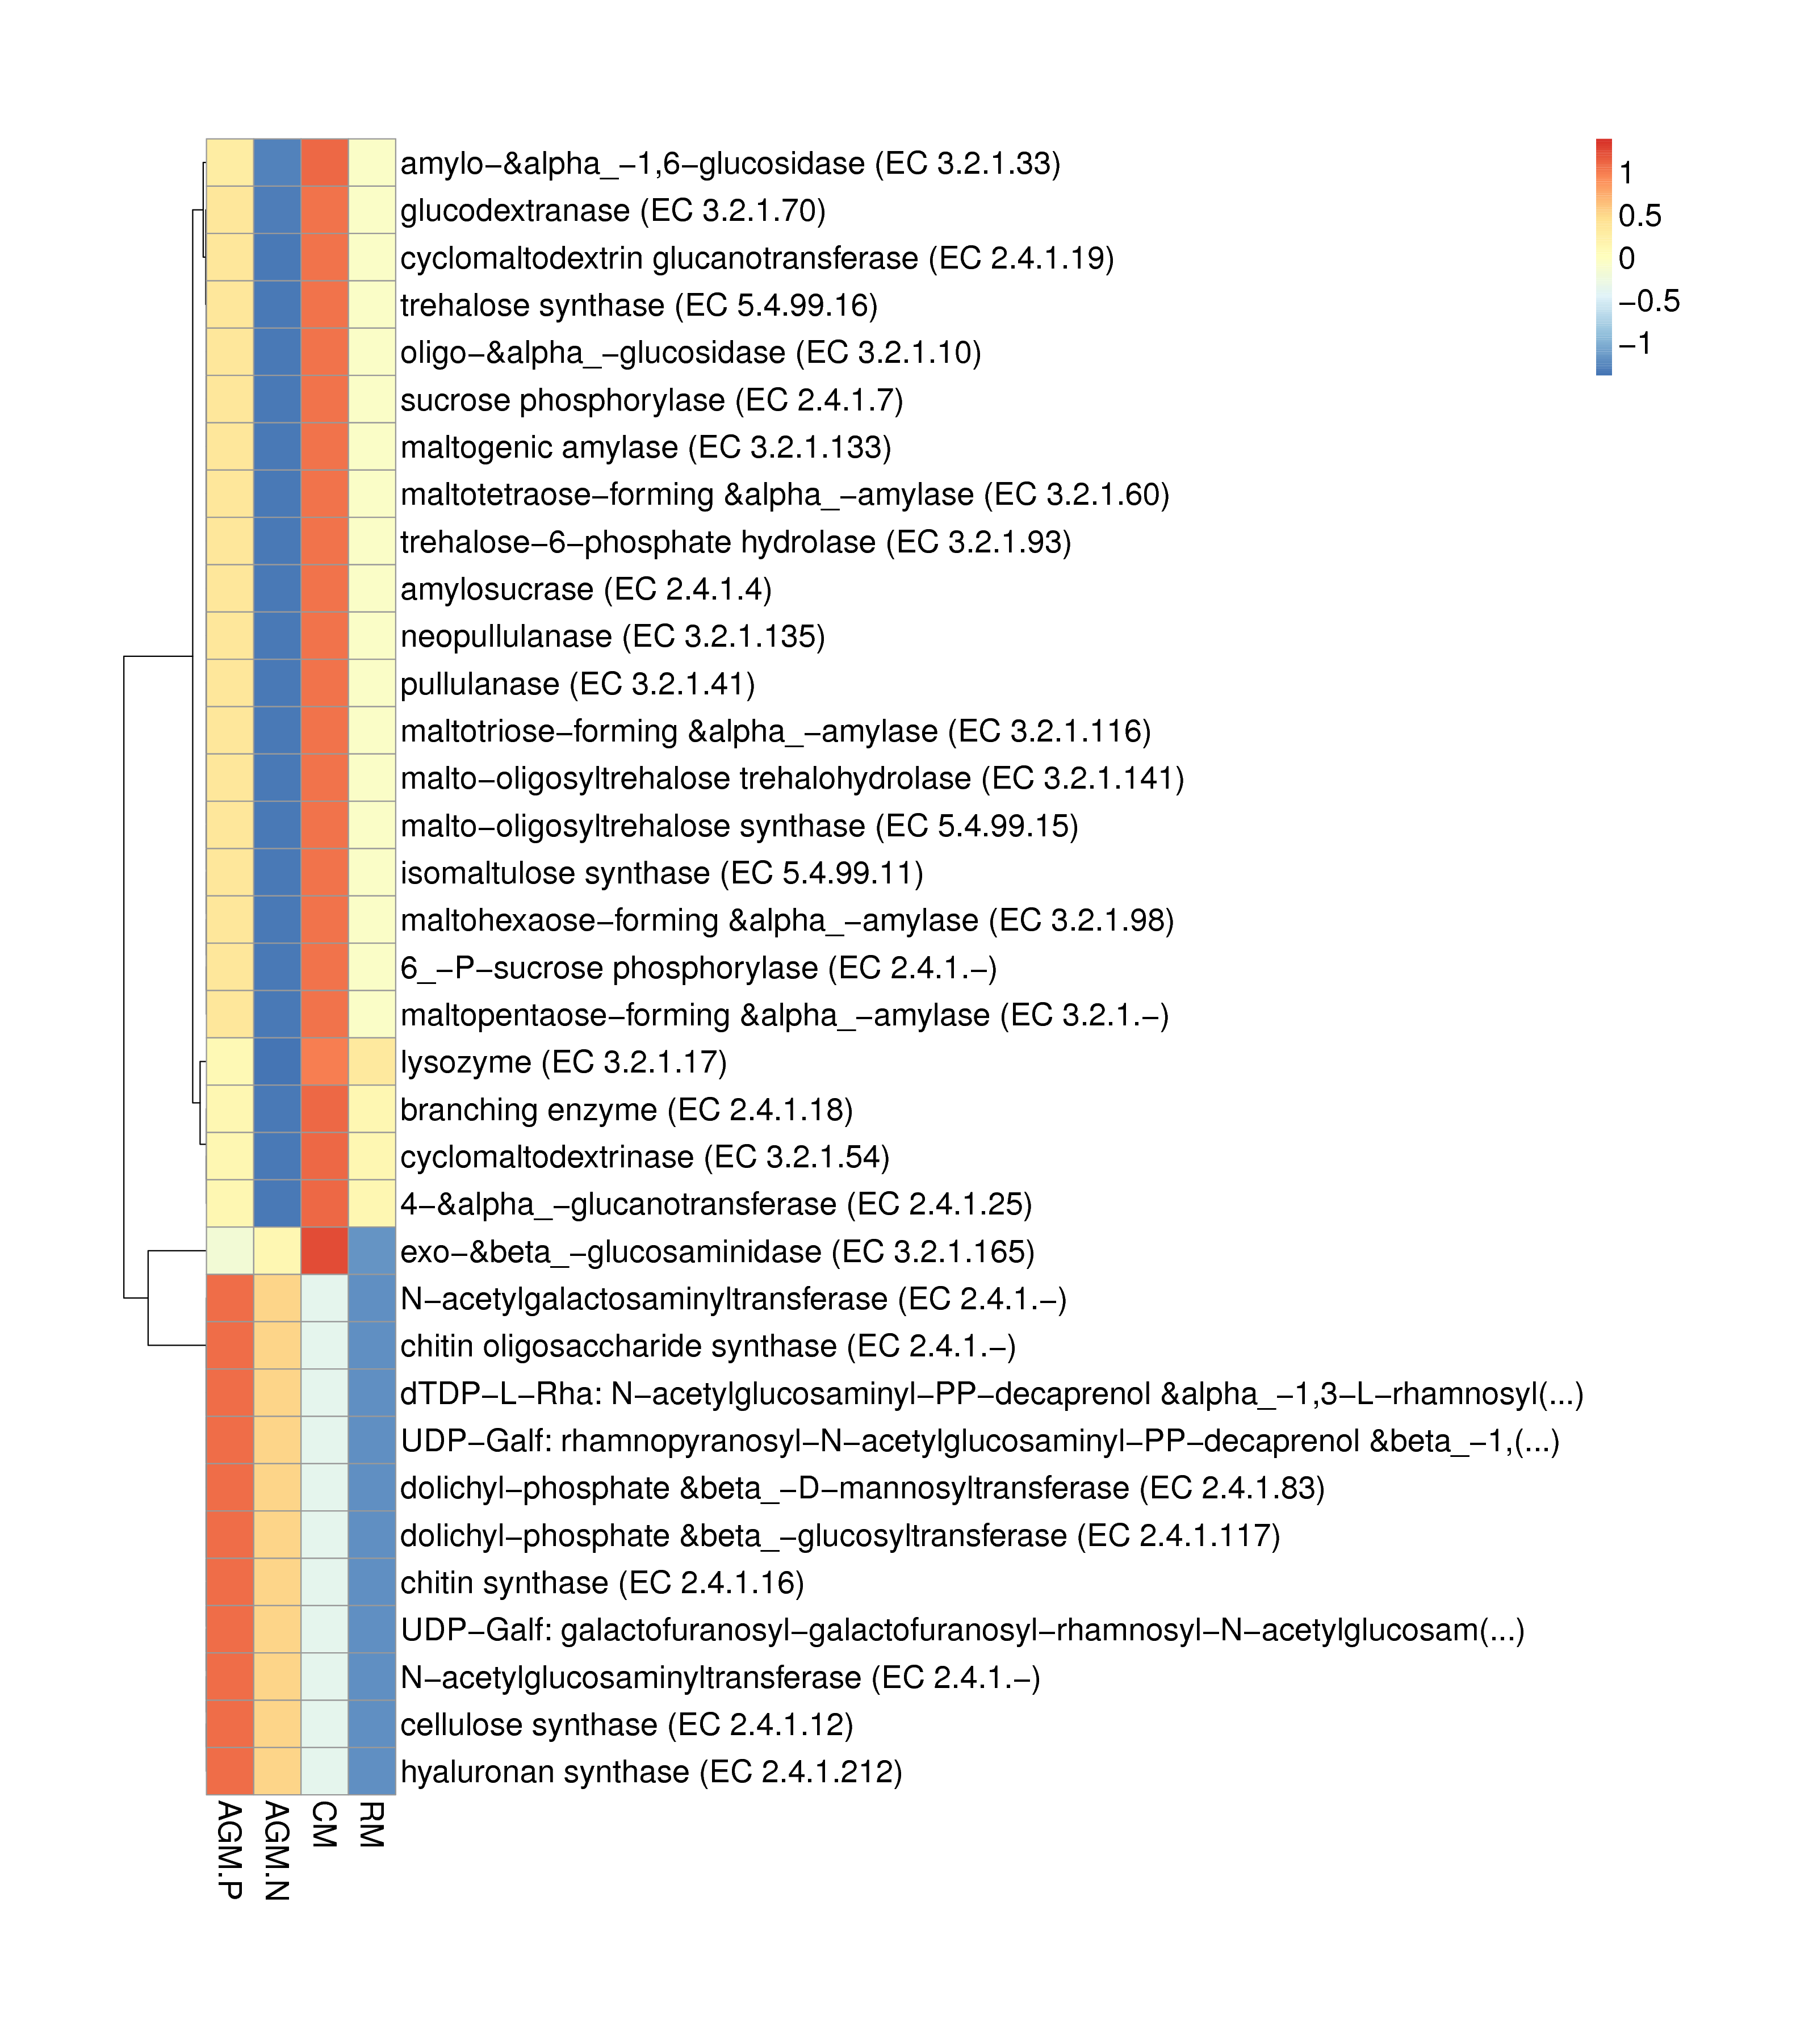
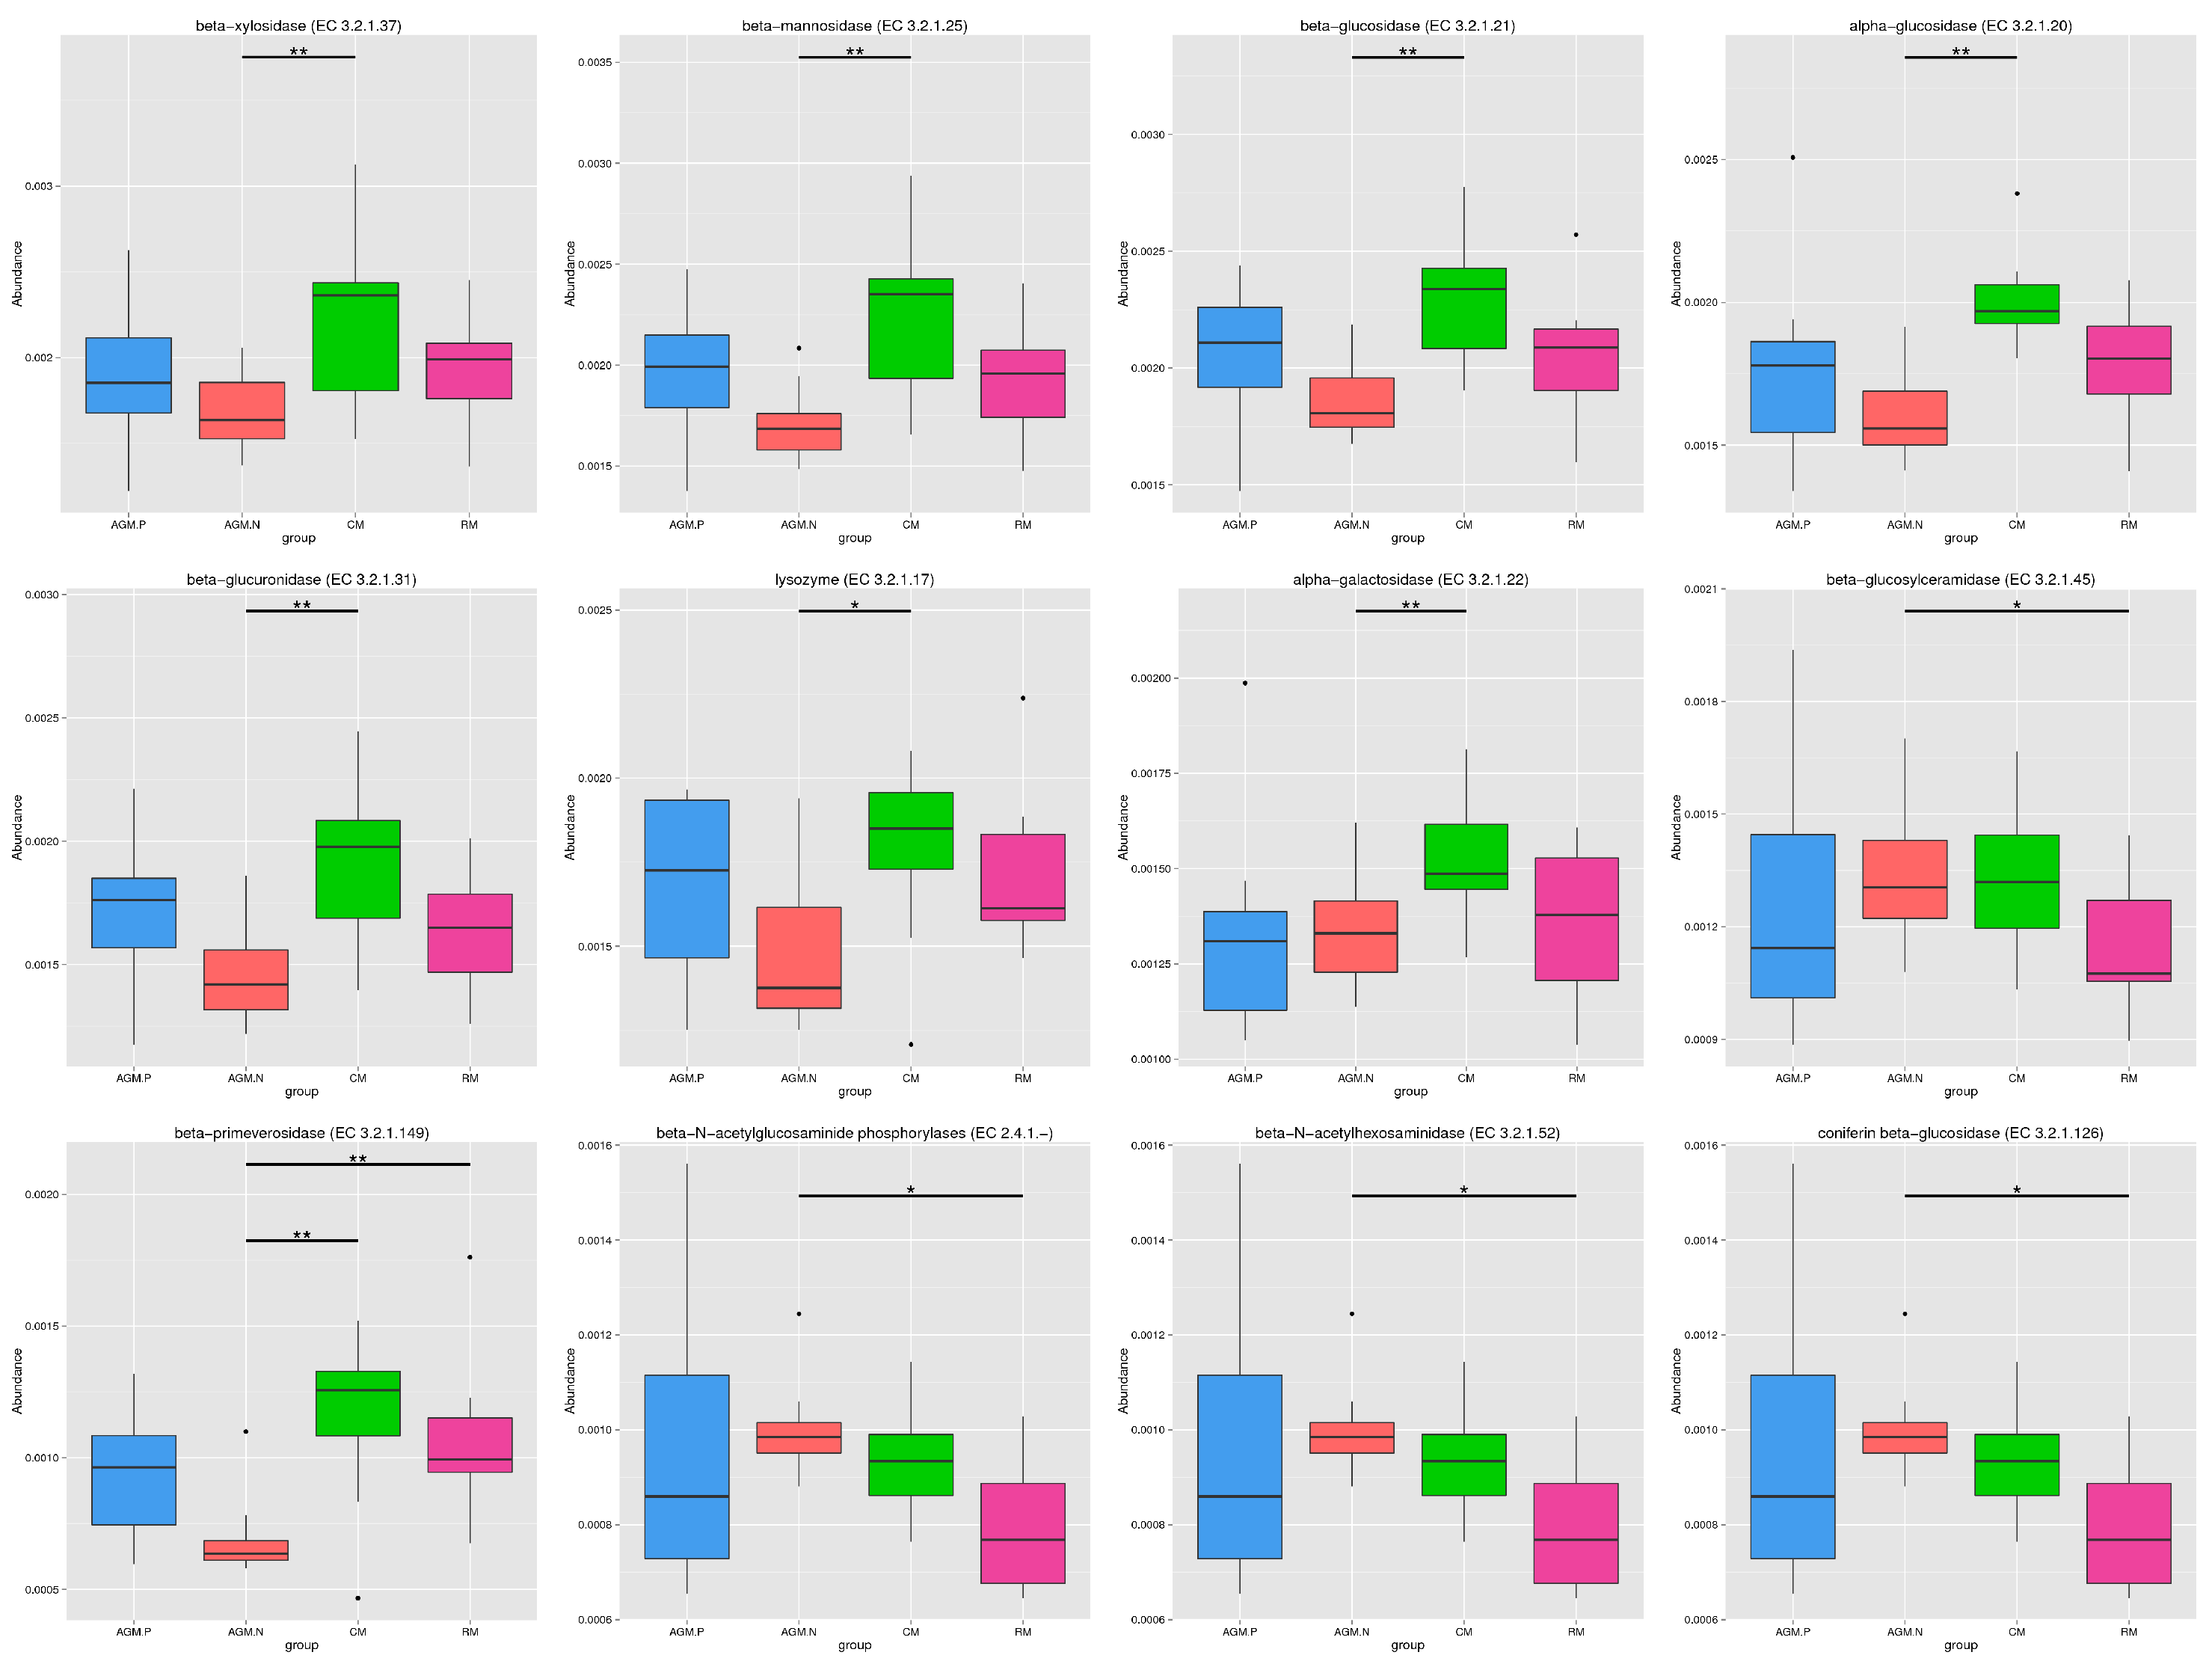
Principal component analysis based on the gene level (Fig. 3a) and KEGG profile (Fig. 3b) demonstrated that the gut microbiome of AGM_P and AGM_N can be clearly distinguished from that of CM and RM. And the CM gut microbiome is closer to the RM microbiome than the AGM microbiome (Fig. 3). The distribution of CAZy classes between different groups were shown in Fig. 4a. Compared with CM, the alpha-galactosidase (EC 3.2.1.22), which is involved in lipid metabolism, was significantly downregulated in AGM_N (P < 0.01) (Fig.S4&S5). Compared with RM, the beta-glucosylceramidase (EC 3.2.1.45), which is also involved in lipid metabolism, was significantly upregulated in AGM_N (P < 0.05) (Fig.S4&S5). The significantly enriched terms by KEGG Orthology between different groups were shown in which the 3-oxoacyl-[acyl-carrier protein] reductase (K00059) and beta-galactosidase (K01190) was related to fatty acid biosynthesis/metabolism and lipid metabolism, respectively (Fig.S6). Differences in the ARO (Antibiotic Resistance Ontology) distribution were shown in Fig. 4b.
Validation of the differential gut microbiota profile of AGM
The most studied microbial metabolites that influence immune system homeostasis are short-chain fatty acids (SCFAs), such as acetate, propionate and butyrate. Among SCFAs, butyrate has multiple regulatory roles at the gut level, exerting an anti-inflammatory effect on both intestinal epithelial cells and immune cells, and influence host gut health [34, 35]. Several bacteria, such as Coprococcus catus, Eubacterium rectale, Eubacterium hallii, Faecalibacterium prausnitzii, Roseburia spp, produce butyrate [36].
To validate the profiling data, further analysis of feces samples from 20 AGM_N and 20 CM via quantitative RT-PCR demonstrated that AGM_N possessed a lower abundance of Bifidobacteria (P < 0.01), a higher abundance of Prevotella (P > 0.05) the butyrate-producing Faecalibacterium prausnitzii (P < 0.01) and Eubacteria (P < 0.05) (Fig. 5). Compared with SIV- AGM, SIV + AGM possessed a higher abundance of Bifidobacteria (P < 0.05) and Prevotella (P > 0.05) (Fig. 5).
Comparison of the metabonomic profiles between AGM_N and CM
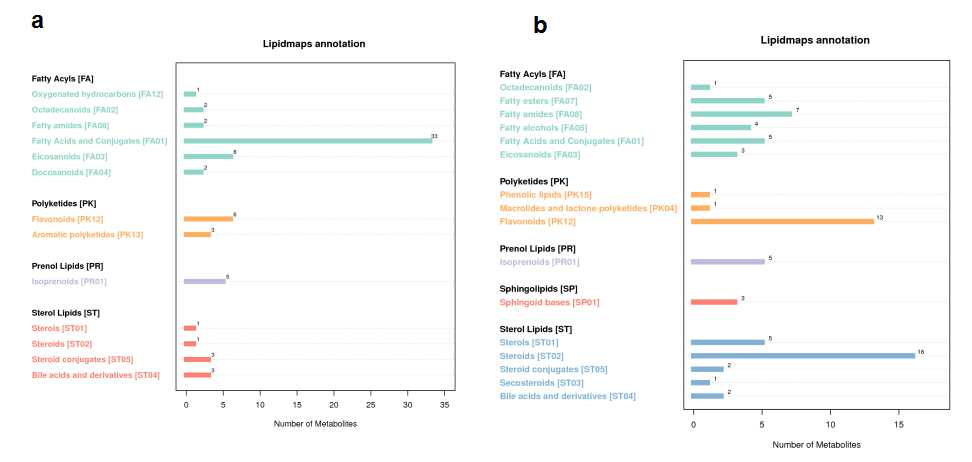
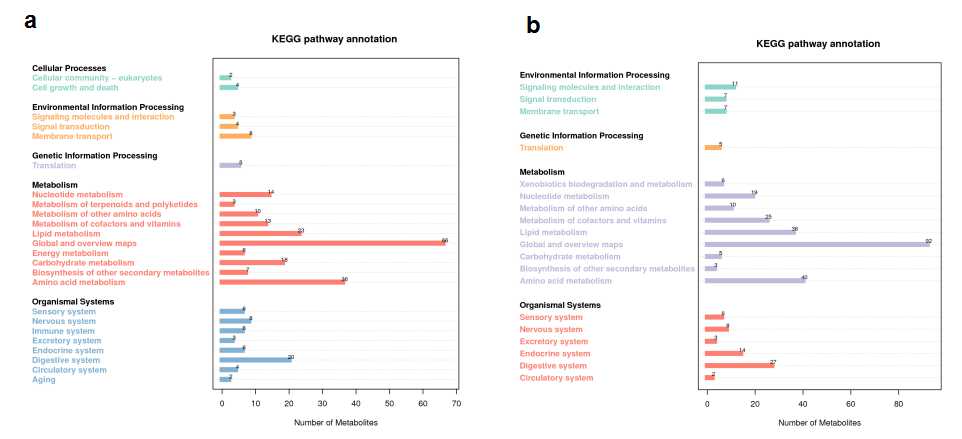
There were altogether 255 positive and 176 negtive metabolites identified with significantly different levels between AGM_N and CM group (Fig. 6, Table 2).The KEGG pathway annotation of the negtive metabolites and positive metabolites between AGM_N and CM demonstrated that the top 2 annotated KEGG pathways were amino acid metabolism and lipid metabolism (Fig.S7). The lipidmaps annotation of the negtive metabolites and positive metabolites between AGM_N and CM indicated that fatty acids and conjugates, flavonoids, steroids were the top 3 annotated lipids (Fig.S8). The most enriched terms of by KEGG Orthology between AGM_N and CM are biosynthesis of unsaturated fatty acids, carbon metabolism, biosynthesis of amino acids, galactose metabolism for the negtive metabolites as well as metabolic pathways, steroid hormone biosynthesis, vitamin digestion and absorption, glycerophospholipid metabolism for the positive metabolites (Fig. 7).
Table 2
Numbers of the metabolites at significantly different levels, either with positive ions or negative ions, were compared between AGM_P, AGM_N, CM.
| Compared samples | Number of total identified metabolites | Number of upregulated metabolites | Number of downregulated metabolites |
| AGM_N vs CM_pos | 255 | 94 | 161 |
| AGM_N vs CM_neg | 176 | 76 | 100 |
| AGM_P vs AGM_N_pos | 63 | 9 | 54 |
| AGM_P vs AGM_N_neg | 22 | 3 | 19 |
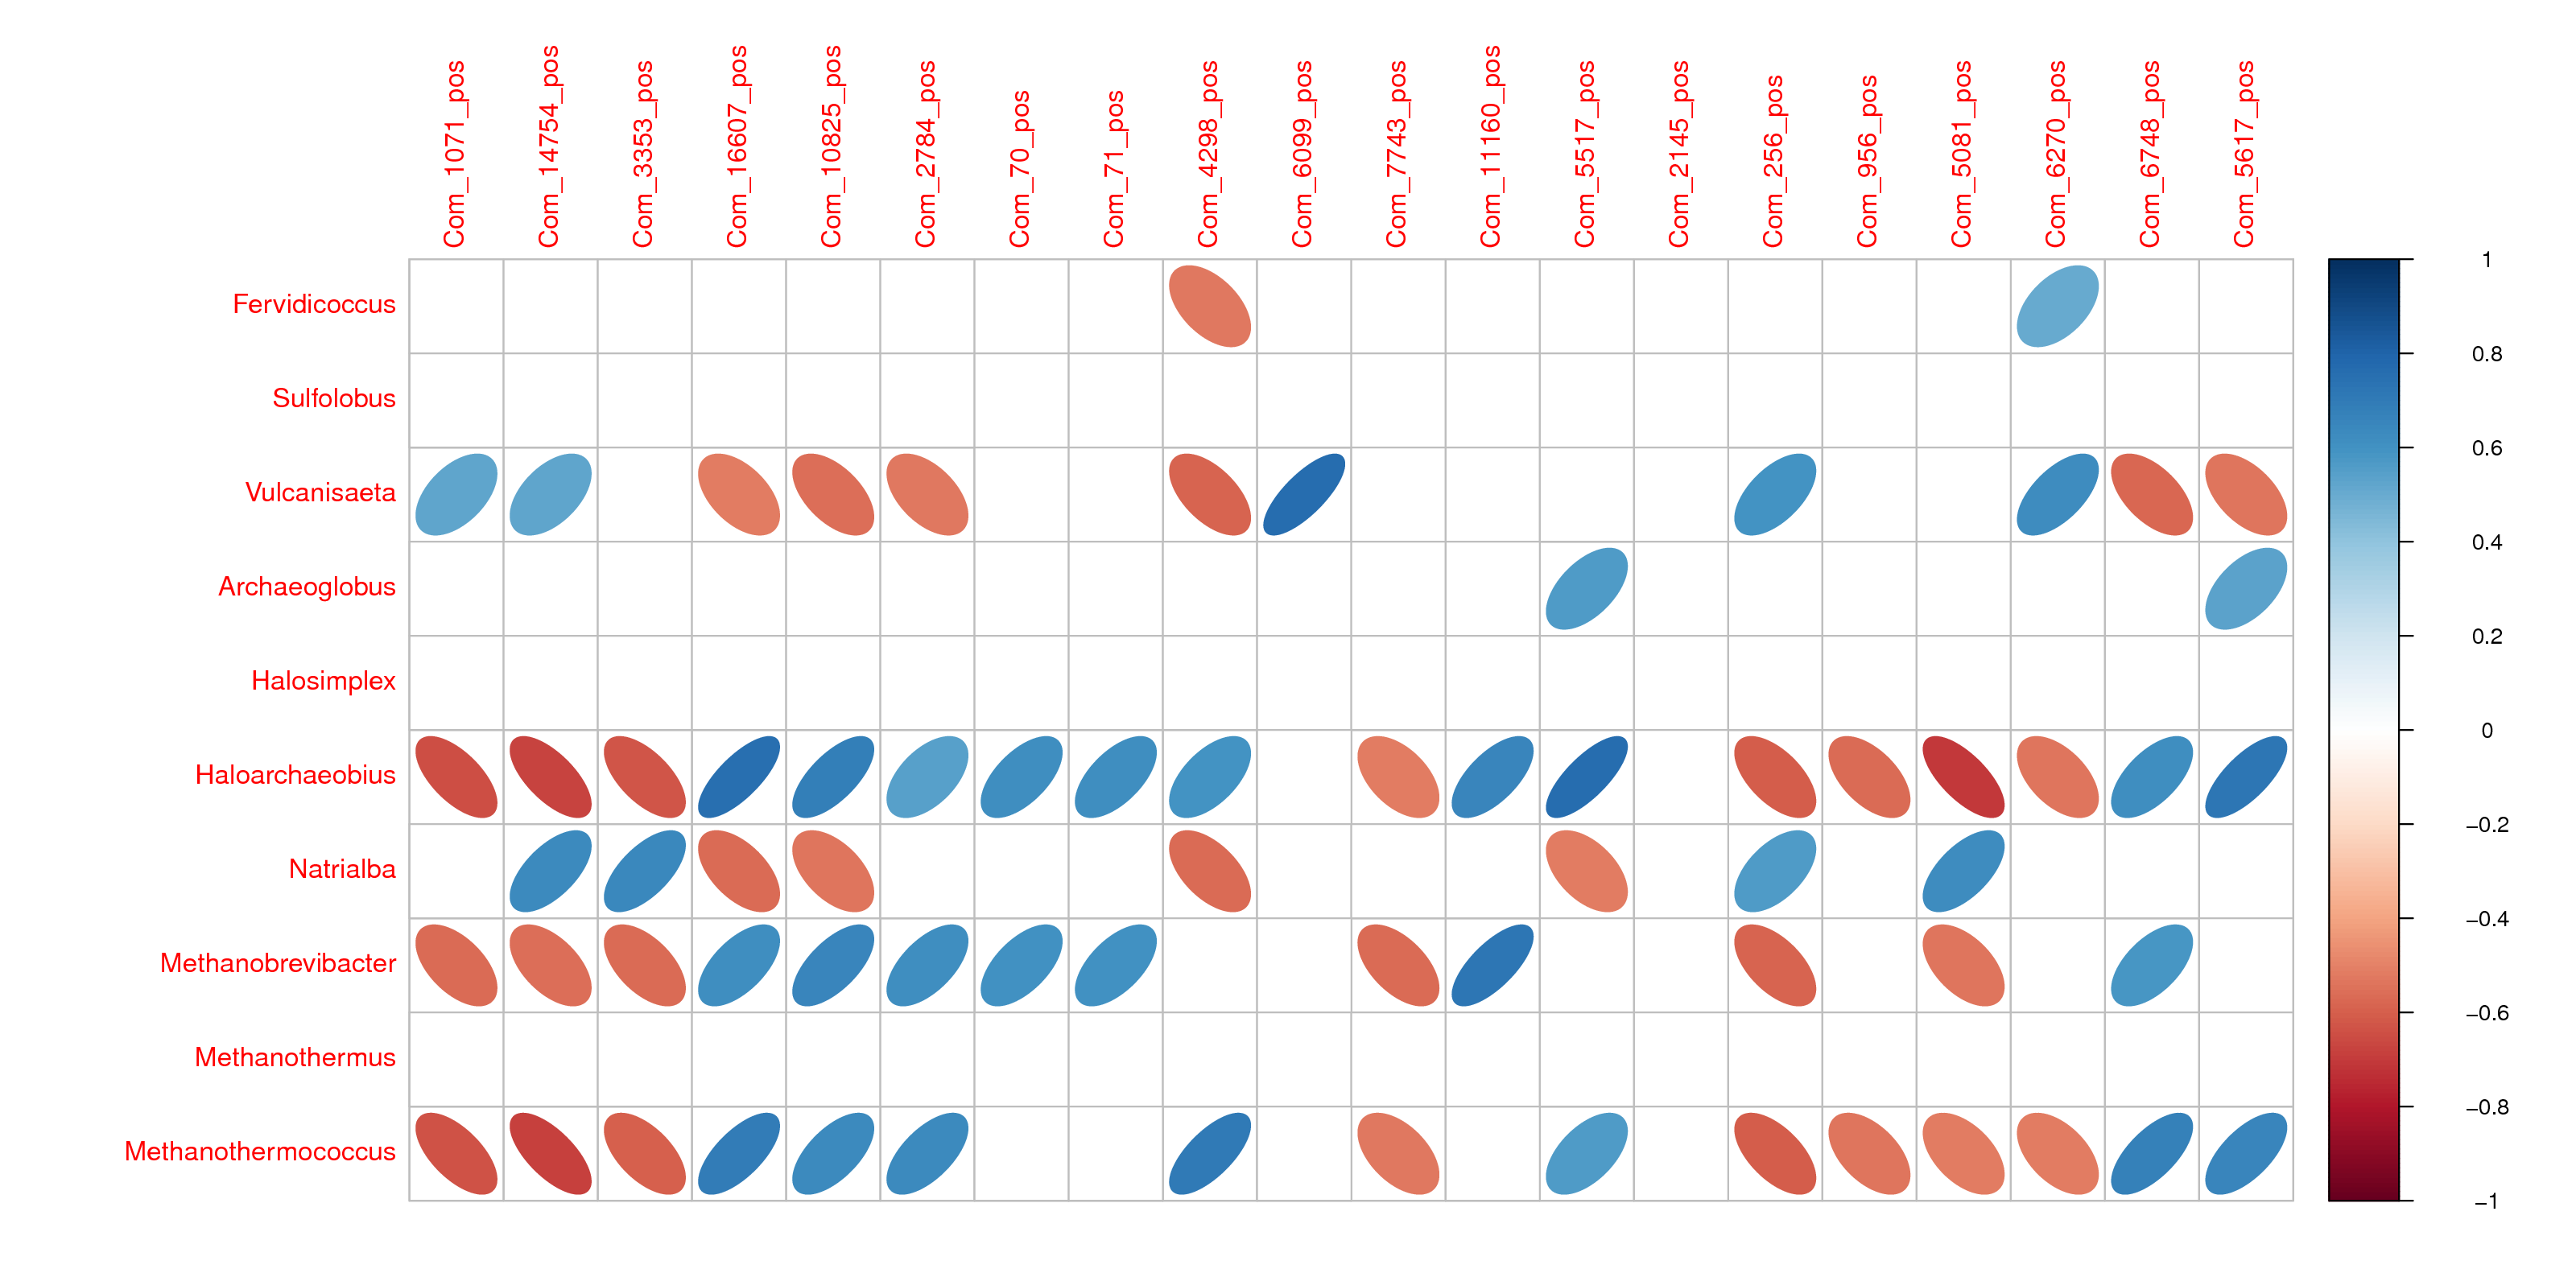
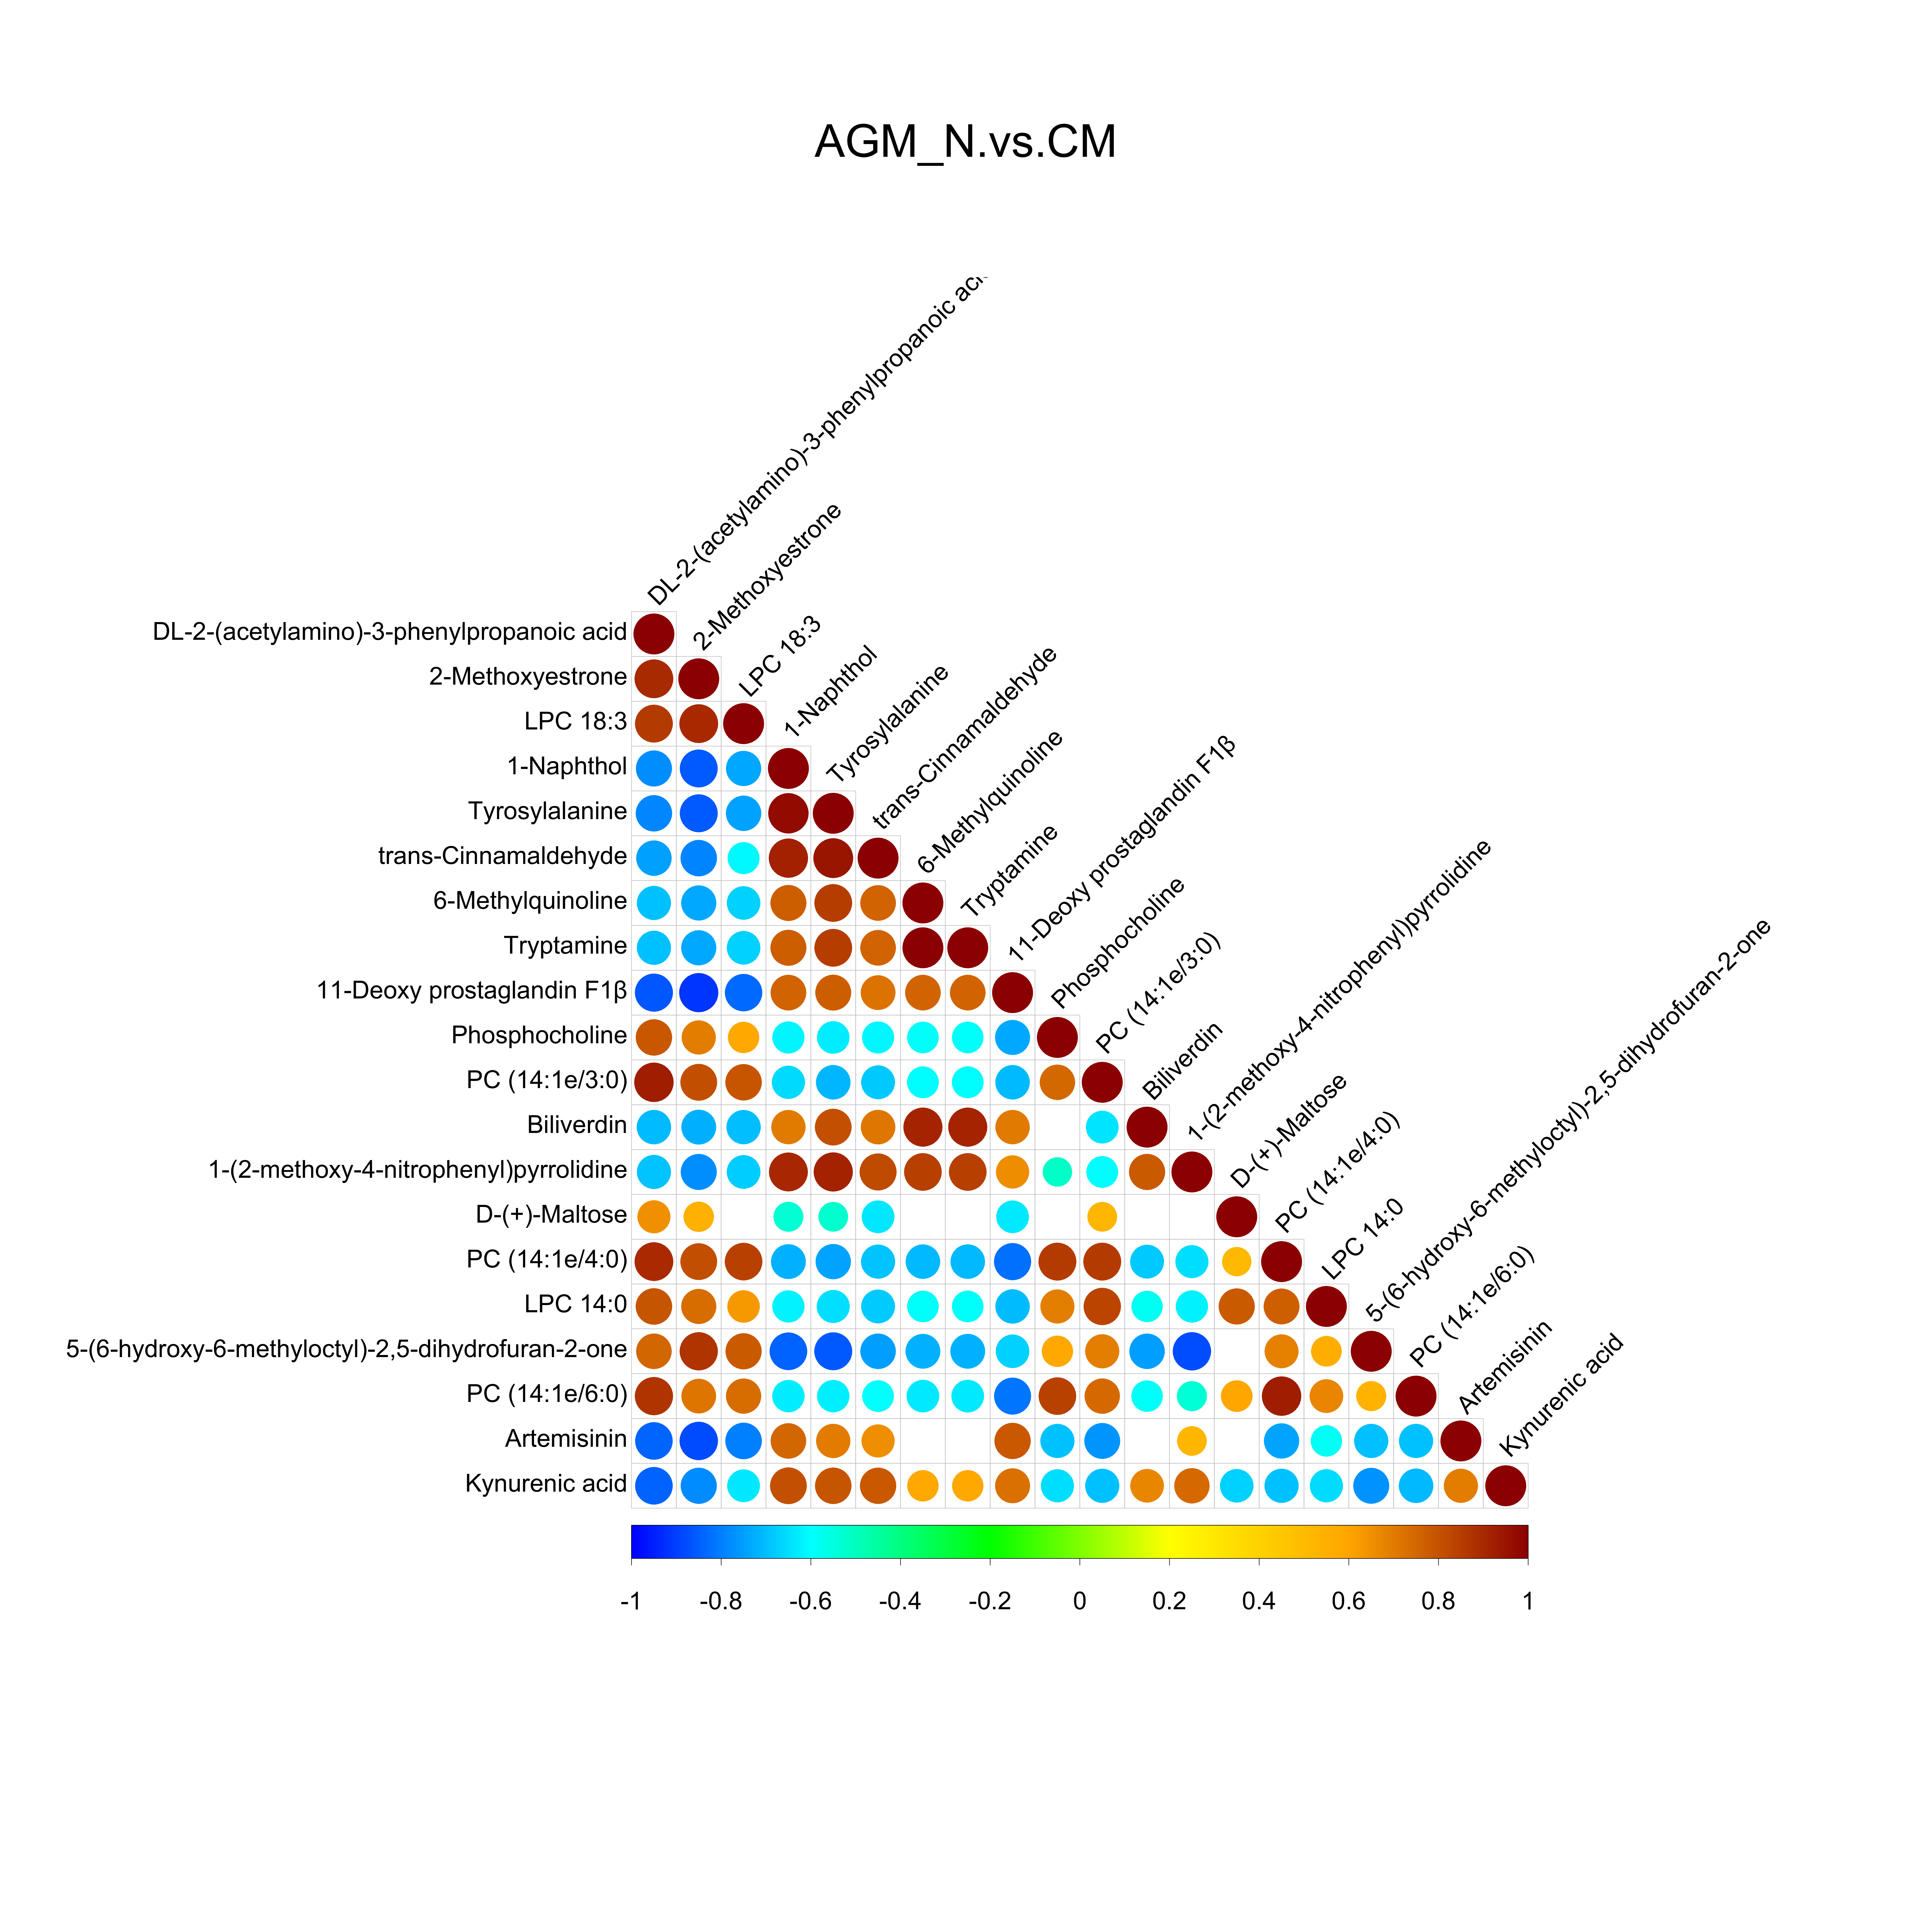
Next, correlation between metabolites, as well as correlation between metabolite and microbiota species, was analysed. Among the negtive metabolites, the gentisic acid (Com 1389), which is related to pyruvate metabolism and butanoate metabolism, was found to be at higher levels and positively correlated to LPC 16:0 (Com 1188), LPC 18:2 (Com 2871), LPG 16:0 (Com 349), LPG 15:0 (Com 282), LPG 17:0 (Com 1908), PG (3:0/15:0) (Com 1309) in AGM_N compared to CM (Fig. 8). Among the positive metabolites, LPC 18:3 (Com 3353), PC 14:1e/3:0 (Com 7743), PC 14:1e/4:0 (Com 256), LPC 14:0 (Com 956), PC 14:1e/6:0 (Com 6270) were found to be at higher levels in AGM_N compared to CM (Fig.S9). All the above metabolites were negatively correlated to the abundances of Haloarchaeobius, Methanobrevibacter, and Methanothermococcus in AGM_N (Fig. 9). These results indicated decreased capacity in lipid metabolism as well as increased capacity in butanoate metabolism in AGM_N compared with CM.
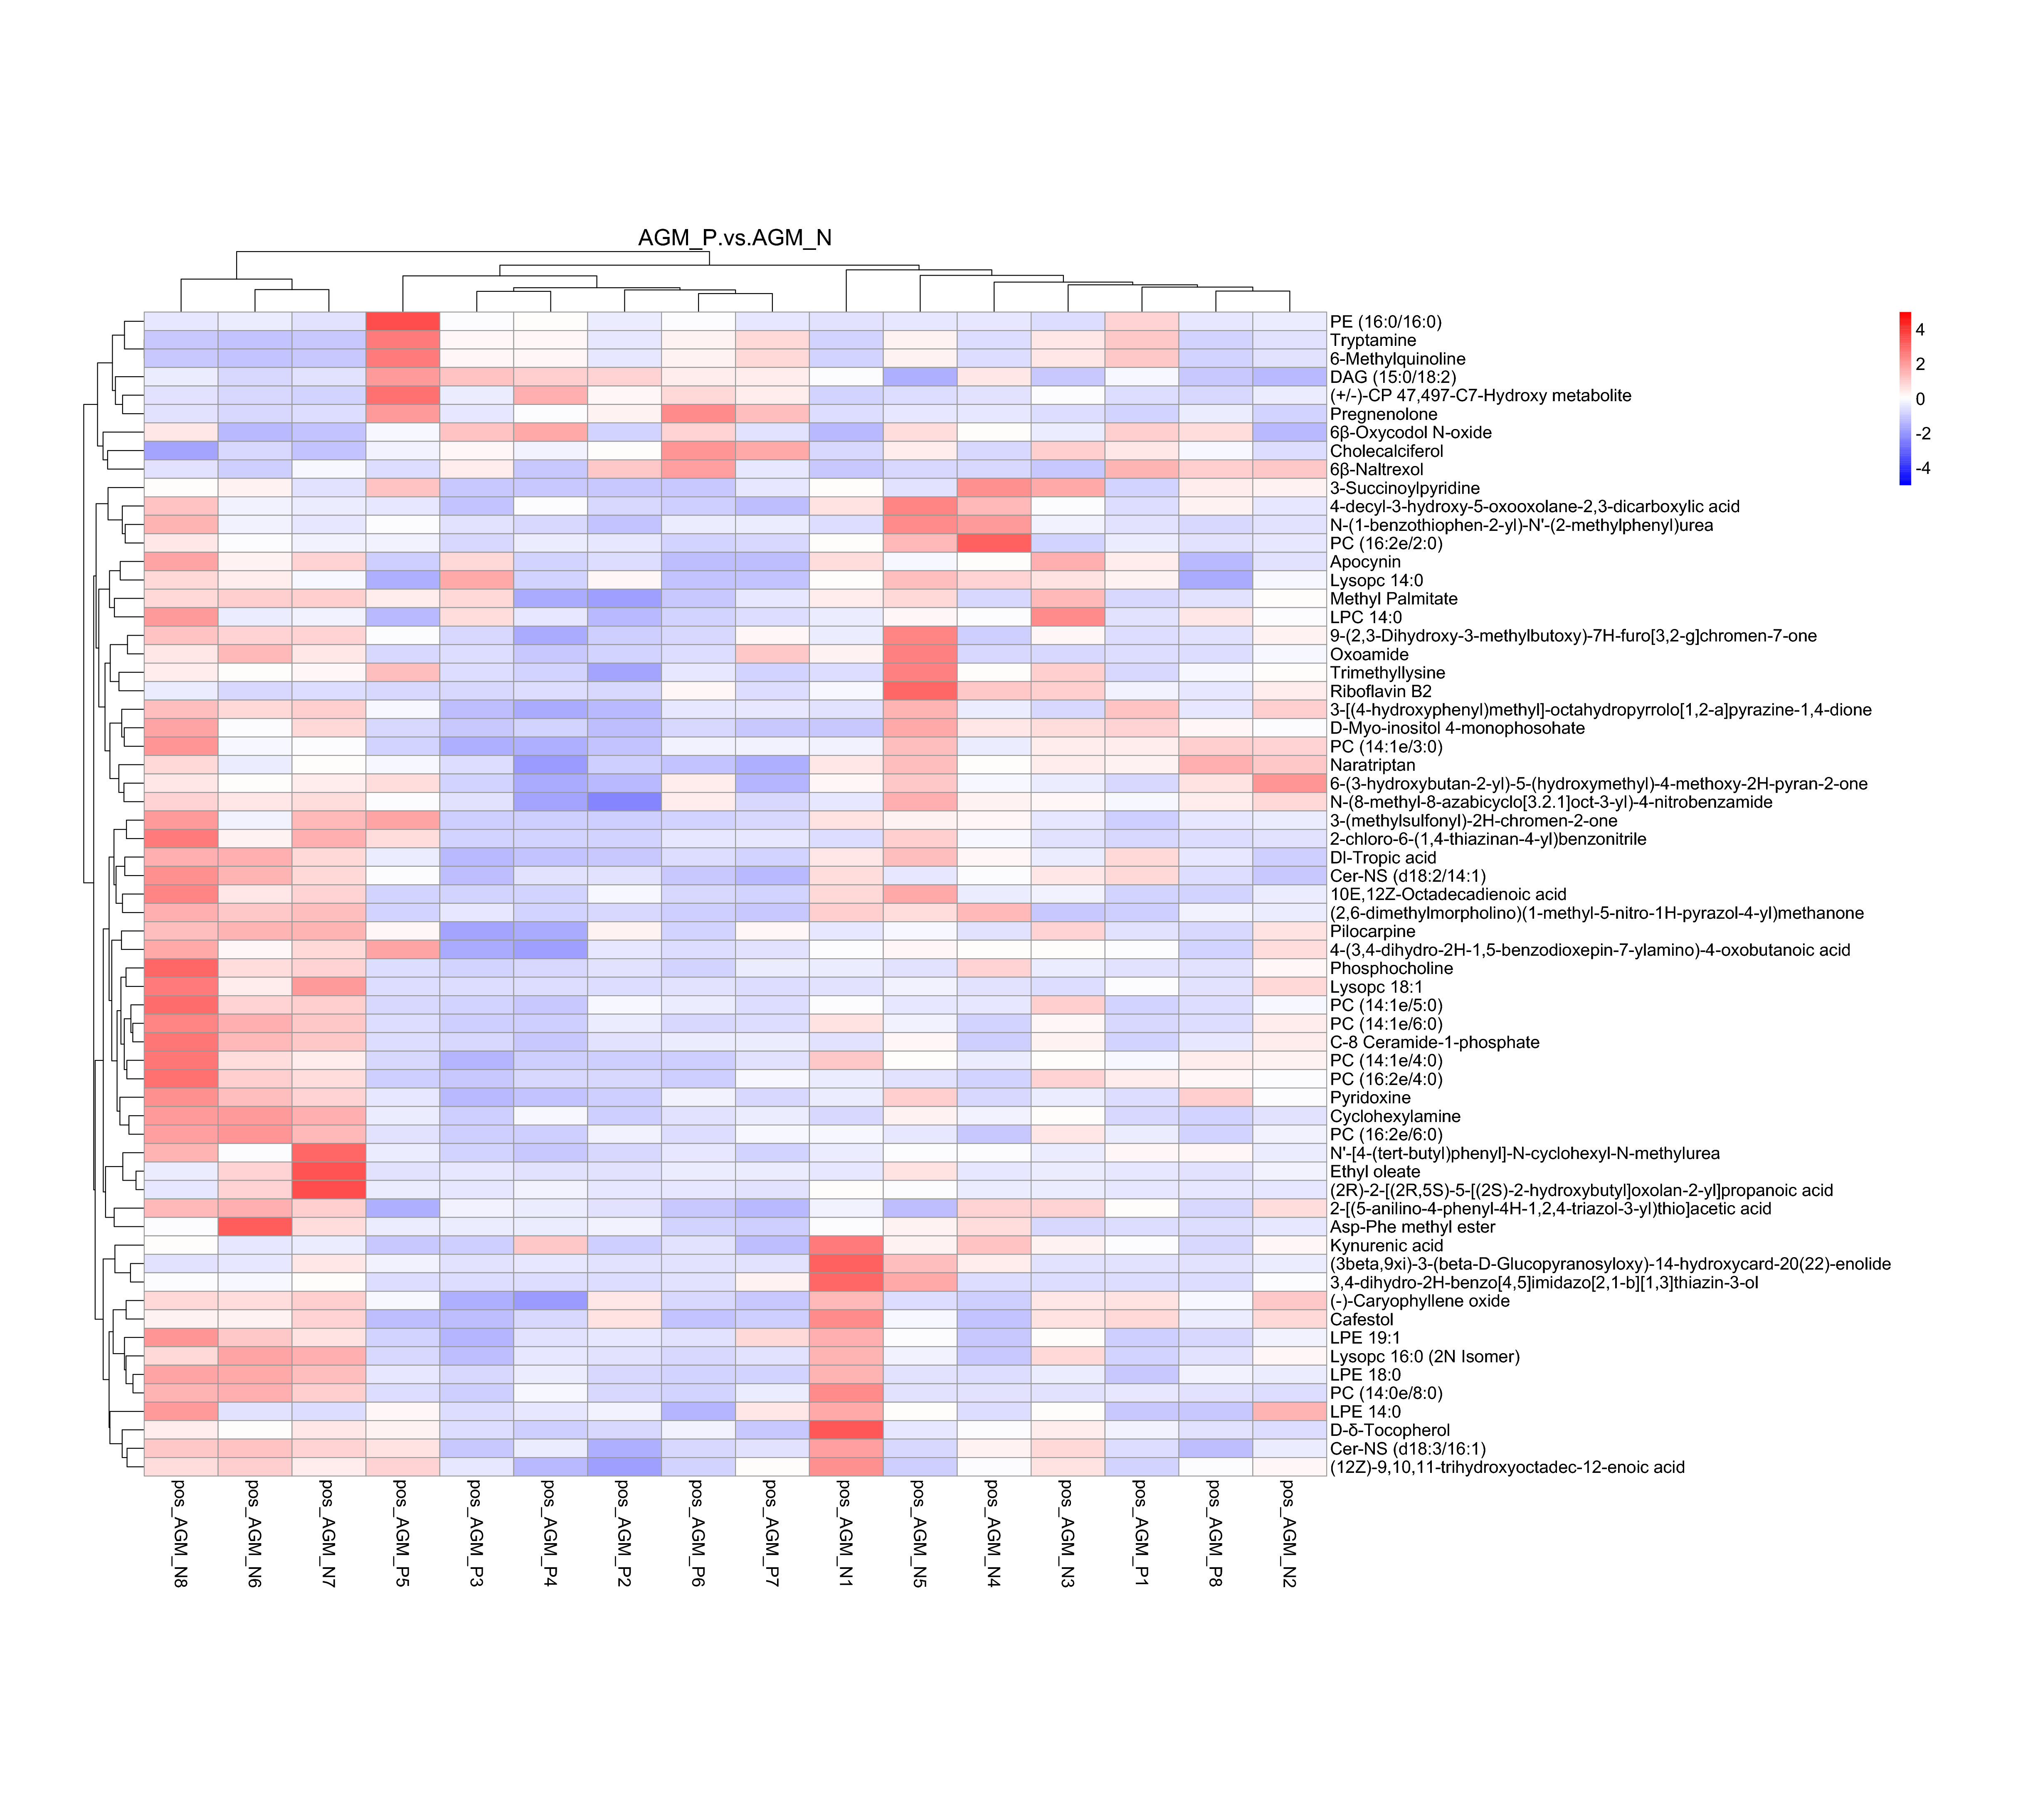
Comparison of the gut microbiota and metabonomic profiles between AGM_P and AGM_N
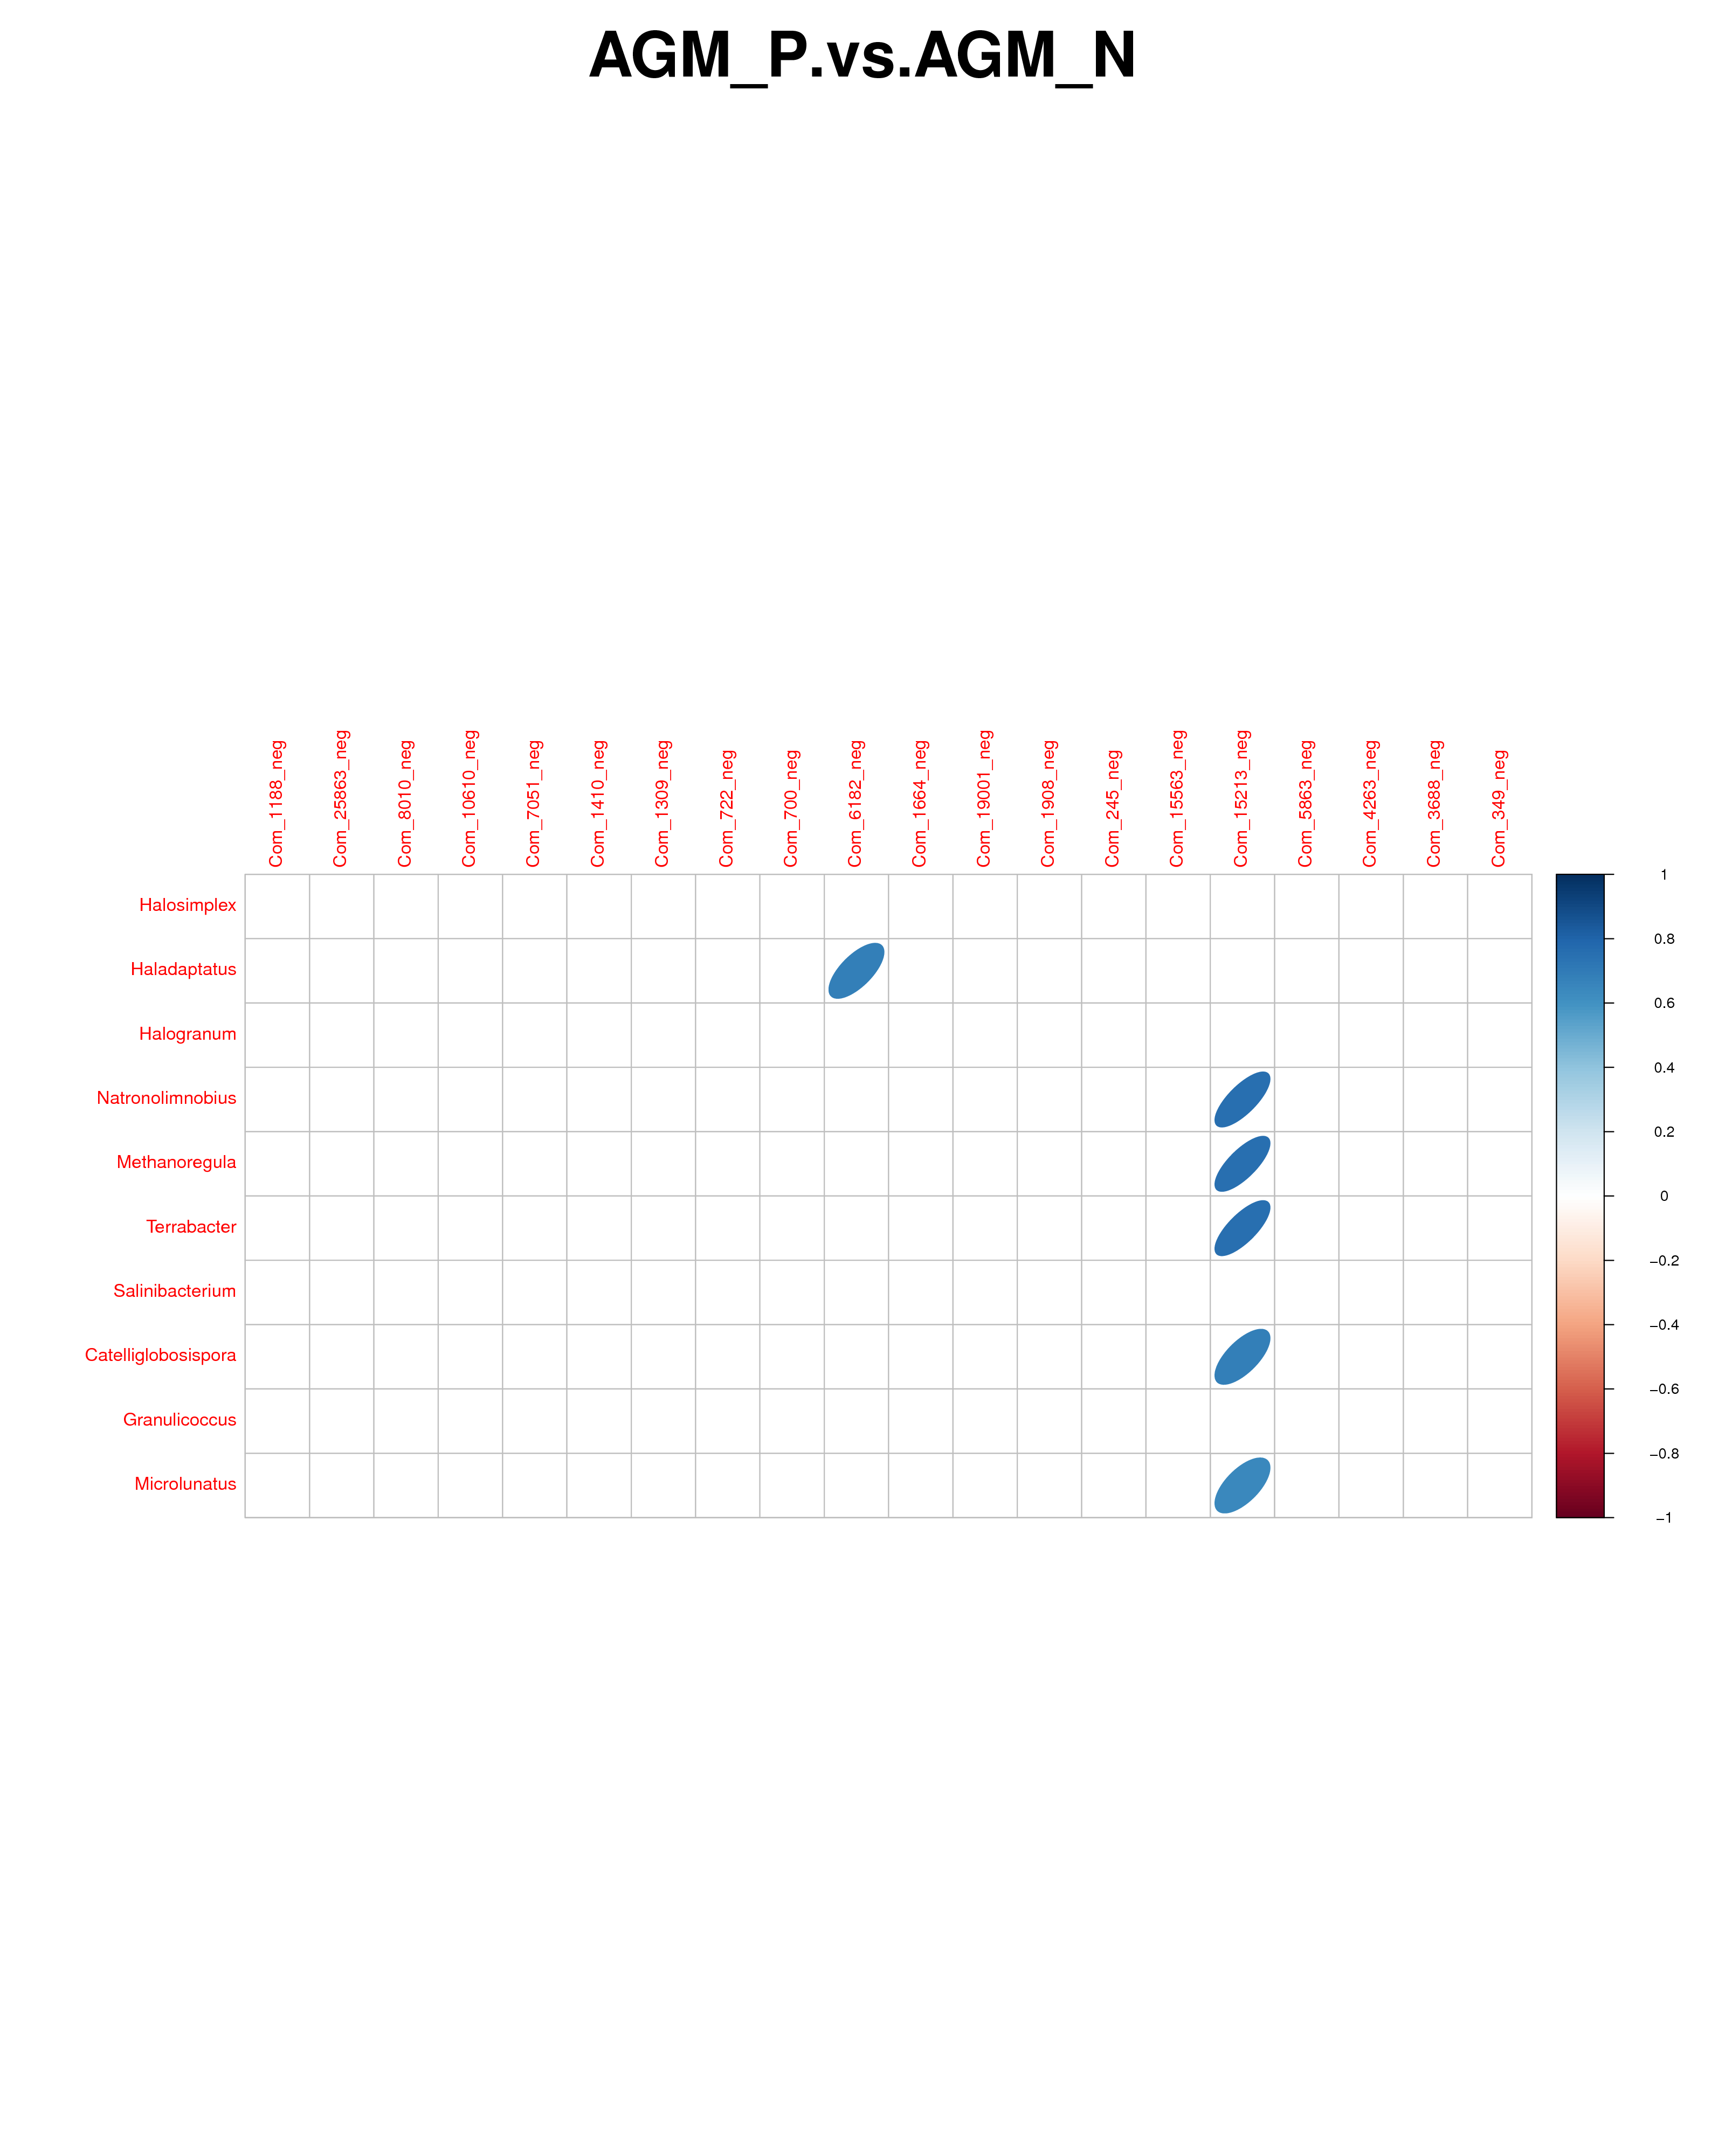
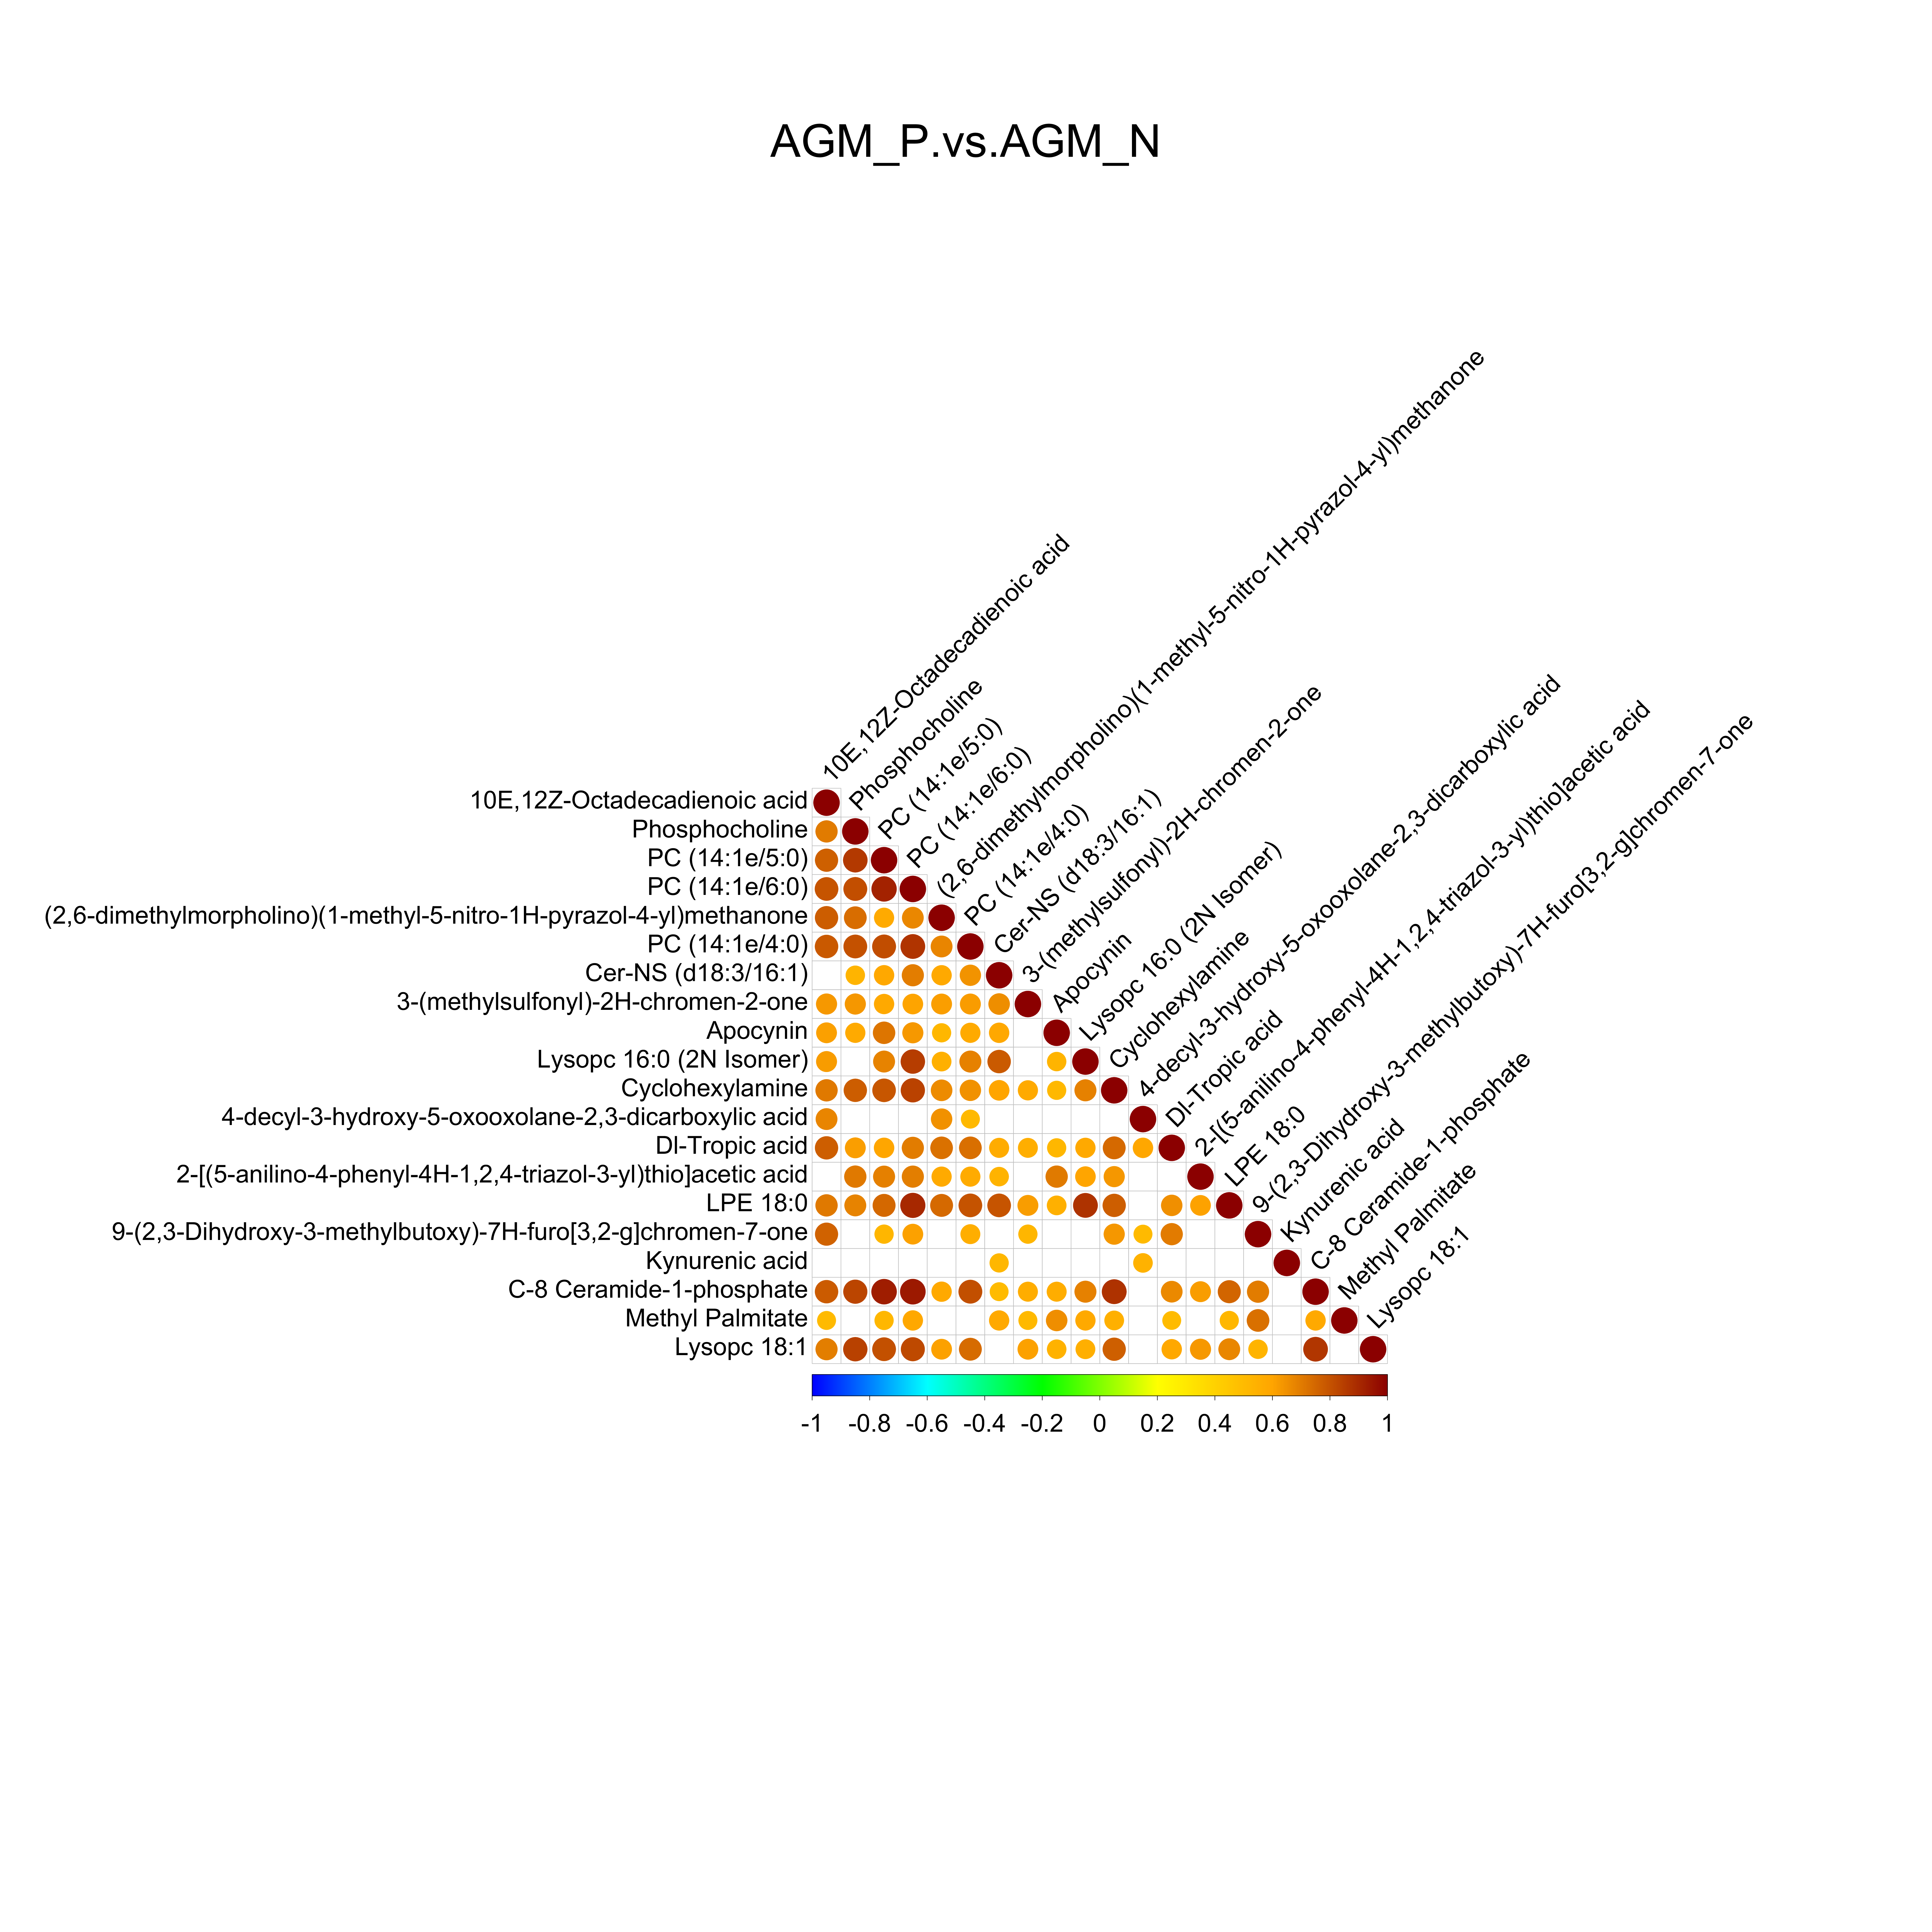
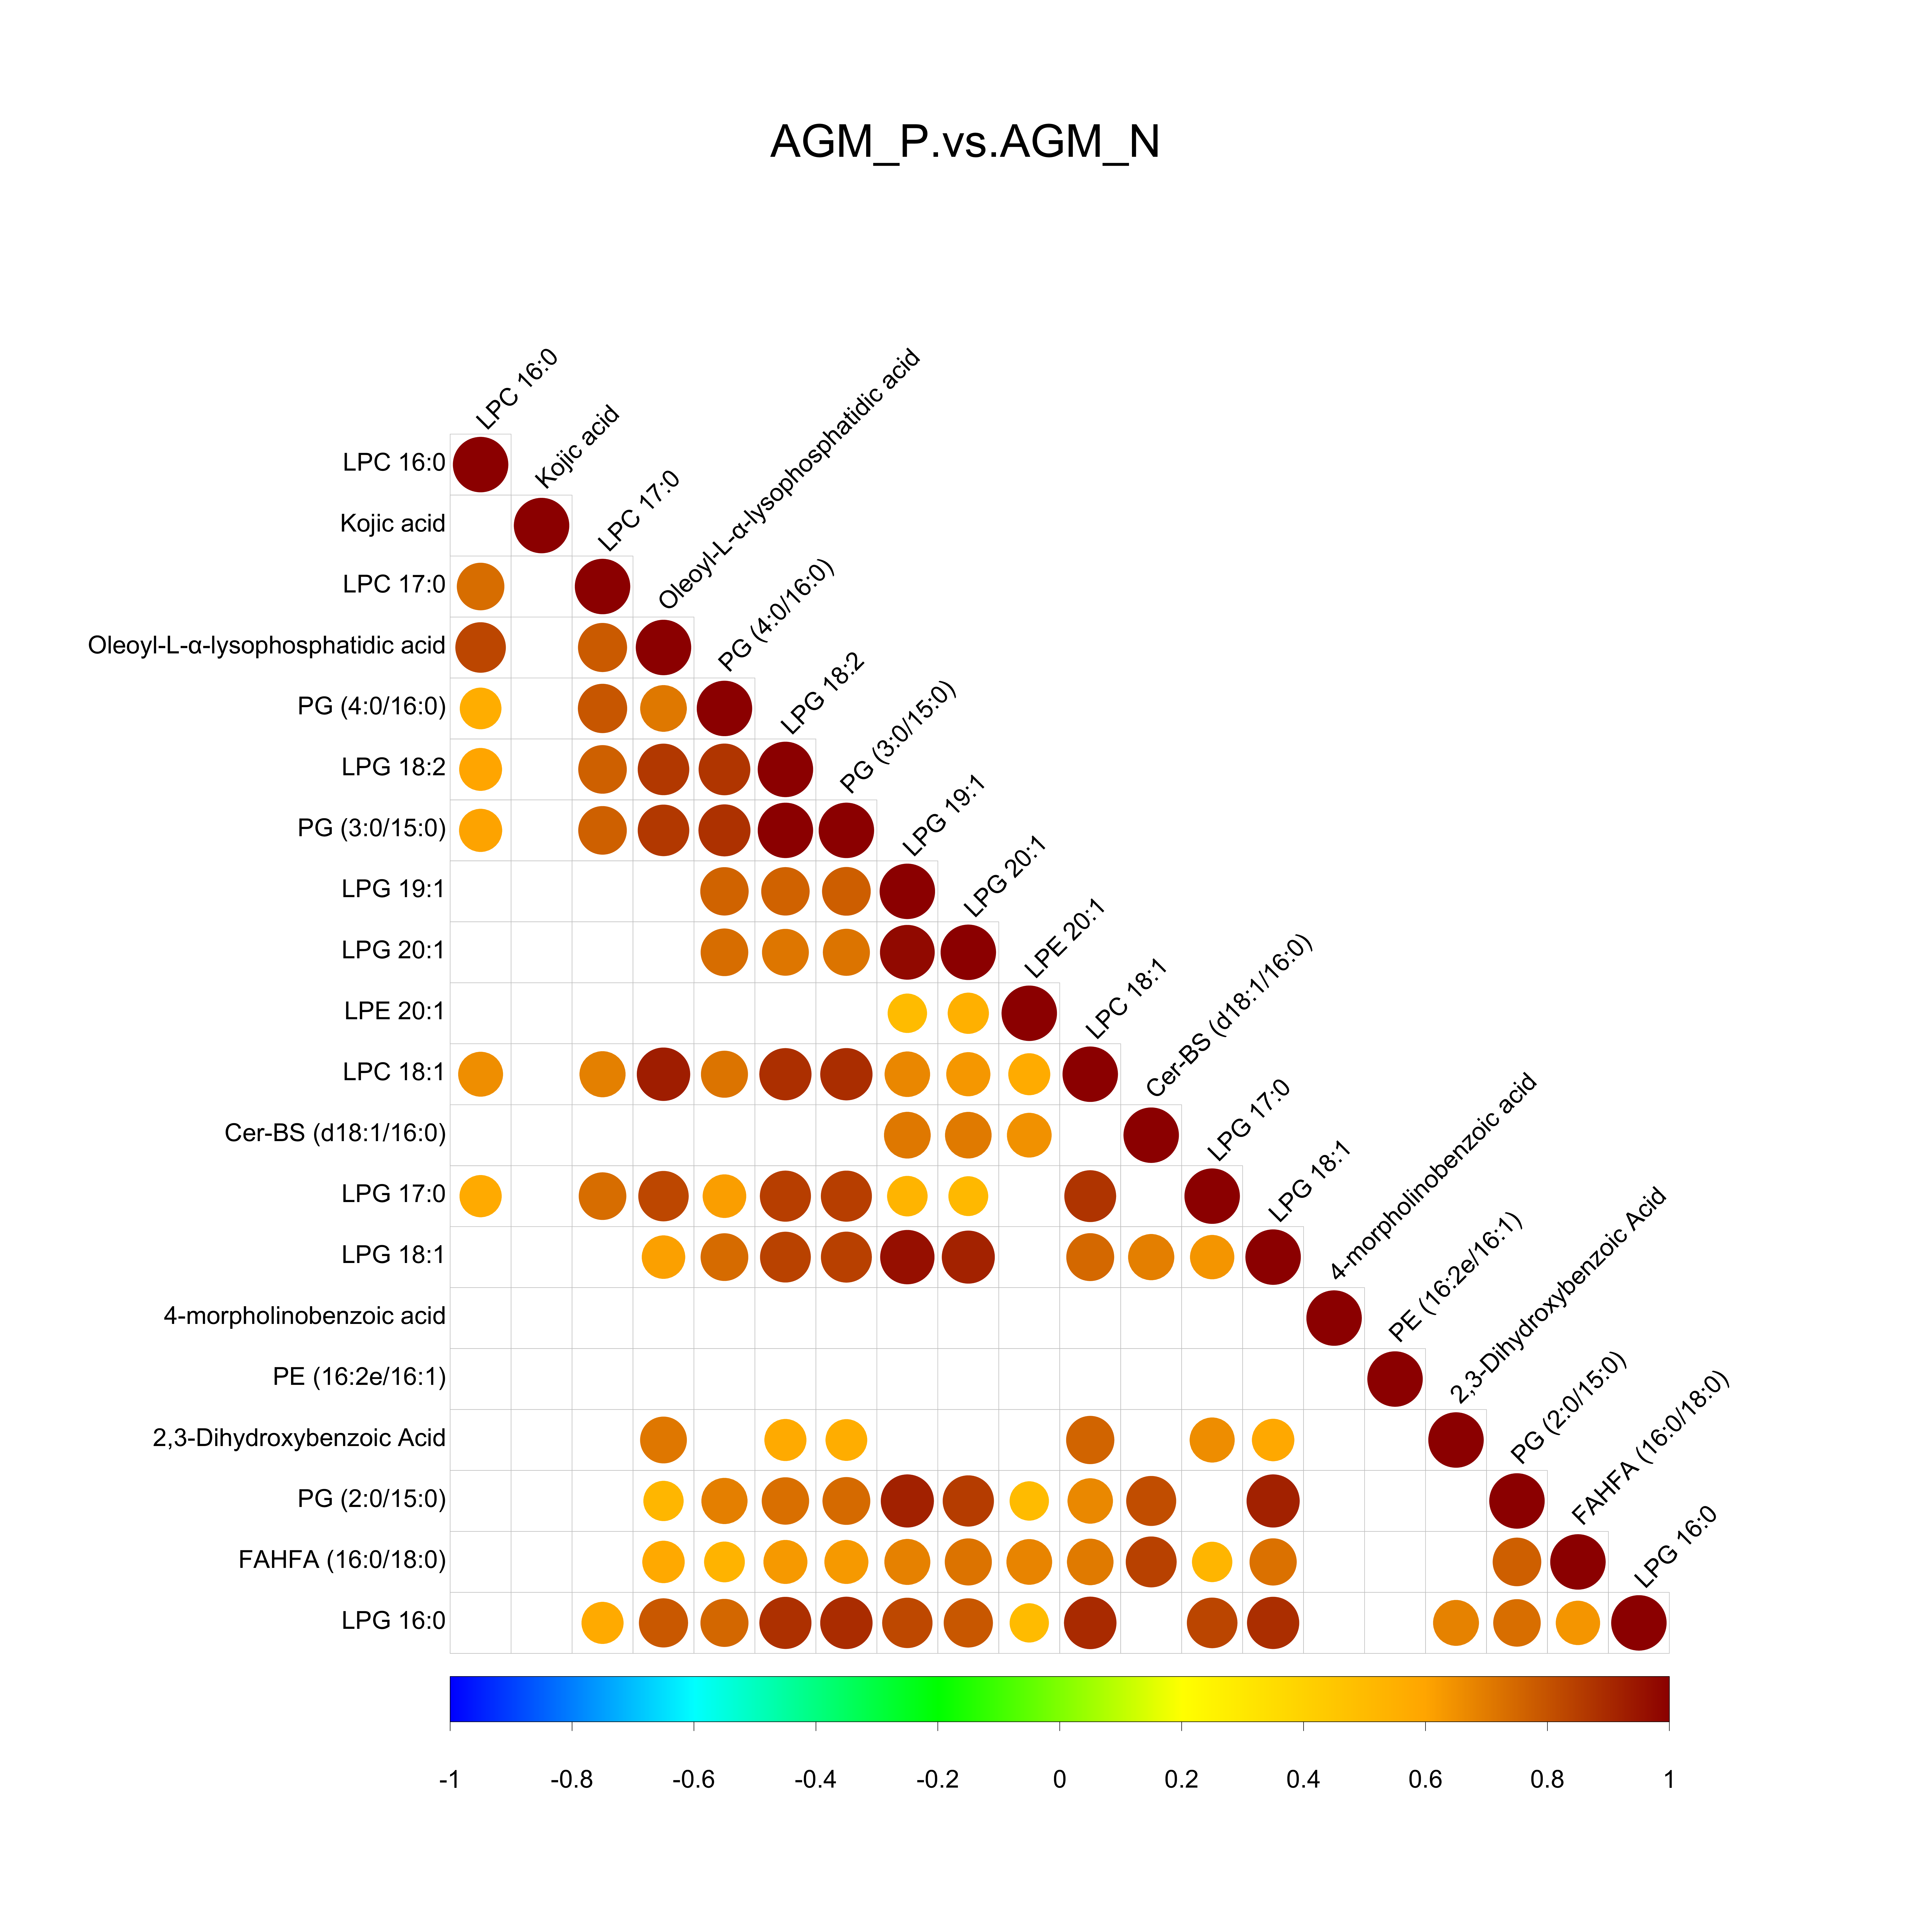
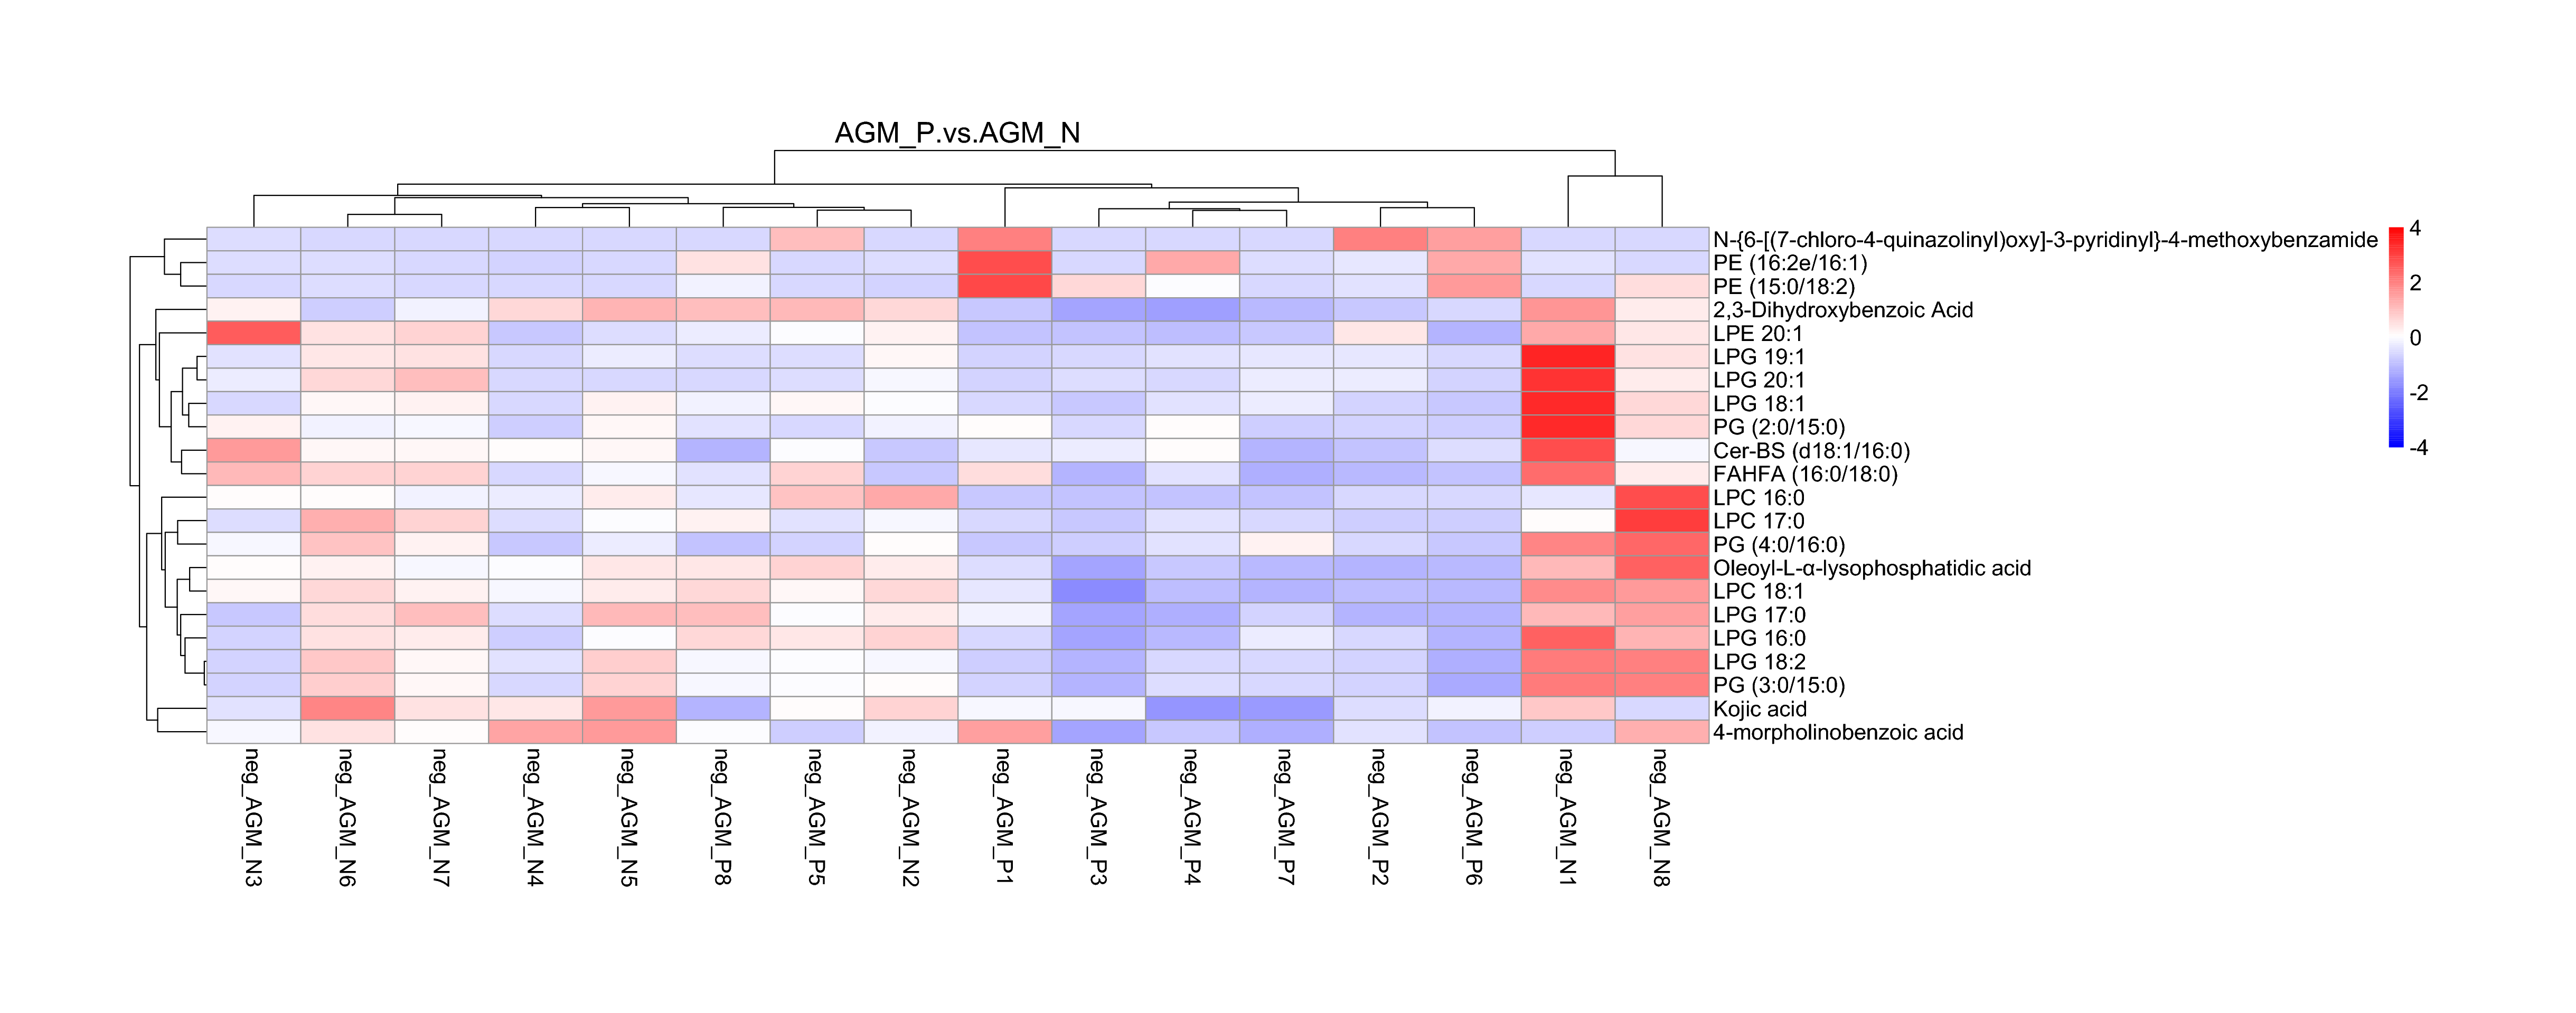
Clear changes in the gut microbiome composition have been reported between HIV-infected and uninfected individuals both in the early and chronic infection stage [37]. Although the fecal microbiota of healthy humans and macaques shares many similarities, there was not such strong clustering of bacterial communities associated with SIV infection as that in HIV infection [38]. Compared with CM, our data demonstrated an significant enrichment in Prevotella and Ruminococcaceae and decreased abundances of Bacteroides, Alistipes, Lactobacillus and Streptococcus in the gut microbiome composition of AGM_N, resembling a trend as found in early SIV infection [39] as well as in chronic HIV infection [41–43]. Compared with AGM_N, a trend in the increased abundances of Streptococcus and Roseburia were shown in AGM_P (Fig.S3). Compared with AGM_N, most of the lipid metabolites were found to be at lower levels in AGM_P and positively correlated to each other (Fig.S11, S12, S13, S14), indicating an increased capacity in lipid metabolism in AGM during chronic SIV infection. LPE 20:1 (Com 6182) and PE 16:2e/16:1 (Com 15213) were positively correlate to the microbiota species ,such as Methanoregula, in AGM_P (Fig.S15).