Human colorectal tissue and serum samples
The CRC tissues and paired adjacent normal tissues were collected from 24 CRC patients undergoing surgical resection (8 were used for Western blot analysis, 2 were used for the isolation of NFs and CAFs, 4 were used for tissue culture and another 10 were used for qPCR analysis). Serum samples from 40 CRC patients and 37 healthy donors were also collected at the Renmin Hospital of Wuhan University, Wuhan, China. Informed consents were signed by those patients and healthy donors before sample collection. All works were approved by the ethics review board of Renmin Hospital of Wuhan University (Wuhan, China) and carried out in compliance with the Declaration of Helsinki of the World Medical Association.
Oncomine database analysis
The Oncomine gene expression array database (www.oncomine.org) was used to assess mRNA levels of WNT4 in two CRC datasets, including Sabates-Bellver Colon (http://www.ncbi.nlm.nih.gov/geo/query/acc.cgi?acc=GSE8671) and Skrzypczak Colorectal (http://www.ncbi.nlm.nih.gov/geo/query/acc.cgi?acc=GSE20916). The Cancer Genome Atlas (TCGA; http://tcga-data.nci.nih.gov/tcga/) Colorectal and Jorissen Colorectal 3 (http://www.ncbi.nlm.nih.gov/geo/query/acc.cgi?acc=GSE14333) were applied to analyze survival rates and recurrence rates respectively. Samples with incomplete clinical information were excluded.
Antibodies and reagents
Antibodies were obtained from the following sources: rabbit anti-WNT4 polyclonal antibody (ab91226), rabbit anti-AXIN2 monoclonal antibody (ab109307), rabbit anti-fibronectin polyclonal antibody (ab2413) and rabbit anti-β-catenin monoclonal antibody (ab32572) were obtained from Abcam (Cambridge, MA, USA); rabbit anti-ZO-1 monoclonal antibody (#13663) and rabbit anti-E-cadherin monoclonal antibody (#3195) were obtained from Cell Signaling Technology (Beverly, MA, USA); anti-rabbit and anti-mouse HRP-conjugated secondary antibodies (#31460, #31430) were obtained from Invitrogen (Carlsbad, CA, USA). Anti-fluorescein isothiocyanate labeled phalloidin (P5282) and anti-α-SMA mouse monoclonal (A5228) antibodies were obtained from Sigma-Aldrich (St. Louis, MO, USA). Recombinant Human WNT4 Protein (6076-WN-005/CF) was obtained from R&D Systems (Minneapolis, MN, USA).
Cell culture
The CRC cell lines HCT 116, LoVo and SW480 were cultured in Dulbecco’s modified Eagle medium (DMEM, Gibco, Carlsbad, CA, USA) supplemented with 10% fetal bovine serum (FBS), 100 U/mL penicillin, and 100 mg/mL streptomycin. HUVECs were cultured in Ham’s F-12K (HyClone, Thermo Fisher Scientific, Waltham, MA, USA) supplemented with 10% FBS, 0.1 mg/mL heparin, 0.03-0.05 mg/ml endothelial cell growth supplement (ECGs). Cells were incubated in a humidified incubator containing 5% CO2 at 37°C.
Immunohistochemical staining
Indirect immunohistochemical staining was performed as follows. All sections were dewaxed and dehydrated, followed by antigen retrieval and blocking. Subsequently, sections were incubated with a primary antibody and HRP-conjugated secondary antibodies. A 3,3′-diaminobenzidine (DAB) kit was used for visualization, and hematoxylin was used to stain the nuclei. Finally, sections were dehydrated with alcohol and sealed with neutral resin.
Cell migration and invasion assay
The cell migration assay was performed using chambers (8.0 μm) in a 24-well plate. For migration assays, cells pretreated with 100 ng/mL WNT4 for 24 hours or not were added to the upper chamber, which contained serum-free DMEM; the lower compartment was filled with DMEM medium supplemented with 10% FBS. Cells were allowed to migrate for 12 h, and those that had migrated across the filter were fixed in methanol and stained with 0.1% crystal violet. The invasion potential of those cells were determined by using a trans-well chamber (8.0 μm), coated with Matrigel (Corning, Albany, NY, USA) in DMEM medium (1:4 v/v), and the lower compartment was filled with DMEM medium supplemented with 20% FBS. Cells were incubated for 24 h before invasive cells were fixed, stained, and counted. Results were analyzed by ImageJ.
ELISA
The WNT4 concentration in serum from healthy donors, CRC patients, and conditioned medium from fresh tissues were quantitatively determined by ELISA kits (CSB-EL026137HU, CUSABIO, Wuhan, China) according to the manufacturer's instructions. For ANG2, the protein concentrations in media from HUVEC cells were detected by a human ANG2 ELISA kit (Abcam, Cambridge, MA, USA).
Luciferase assay
A Dual-Luciferase Reporter Assay system was used to measure luciferase activities (Promega, Fitchburg, WI, USA). For TOP/FOP-Flash reporter assays, cells were divided into five groups: blank, WNT4 (100 ng/mL), DMSO, ICG-001, and ICG-001+ WNT4 (100 ng/mL). After transfection, WNT4 protein (100 ng/mL) was added 6 h before luciferase detection. The relative ratio of TOP-Flash firefly luciferase activity to pRL-TK Renilla luciferase activity was determined as the strength of the transcriptional activity.
Western blots
In brief, equal amounts of protein were separated using SDS–PAGE, and transferred onto PVDF membranes (Millipore, Burlington, MA, USA). After blocking with 5% non-fat milk in Tris-buffered saline with Tween 20 (TBST), membranes were incubated with primary antibodies at 4°C overnight and HRP-conjugated secondary antibodies at room temperature for 60 minutes. Then membrane were incubated with enhanced chemiluminescence (ECL) reagents, and signals were visualized by chemiluminescent a gel imaging system.
Immunofluorescence
For immunofluorescence assays, 12-well chambers were used. Each well was seeded with 1×10⁵ cells on the coverslip and fixed with 4% paraformaldehyde, treated with 0.2% Triton X-100 for 1 min and blocked with 1% bovine serum albumin (BSA). For paraffin embedded tissues, sections were dewaxed and dehydrated, followed by antigen retrieval and blocking. After incubation with primary antibodies and fluorescent-labeled secondary antibodies and Phalloidin, the cells on coverslips or tissue sections were stained with 4′,6-diamidino-2-phenylindole (DAPI). Fluorescent images were obtained using an upright Olympus fluorescence microscope (OLYMPUS BX53).
Cell transfection
Inhibition of WNT4 expression was performed by using specific siRNA constructs. The sequences of WNT4 siRNA-1, WNT4 siRNA-2 and normal control used in this study are presented in Supplementary Table 1. In brief, cells were transiently transfected with WNT4 siRNAs using Lipofectamine 2000 and were harvested for analysis of the knockdown efficiency at 48 h ours after transfection.
To establish stable WNT4-overexpressing cells, an overexpressing plasmid was constructed and packaged into a lentivirus system (WNT4-HA). Lentivirus-NC was used as the negative control (WNT4-vector). In addition, to generate cells with low expression of WNT4 (sh-WNT4) and ANG2 (sh-ANG2), short hairpin RNA (shRNA) sequences directed against WNT4 and ANG2 were transfected (Supplementary table 1), while a scramble construct was used as a control. Non-transfected cells were screened out by treatment with 10 μg/mL puromycin (Sigma Aldrich, St Louis, MO).
Quantitative real-time PCR
TRIzol reagents (Invitrogen) was used to extract RNA from cell lines or tissues according to the manufacturer’s instructions. RT-qPCR was performed to quantify the mRNA expression using SYBR Green PCR Master Mix (Takara, Ohtsu, Japan), and miRNA expression with the NCode miRNA RT-qPCR analysis (Takara, Ohtsu, Japan). Primer sequences are presented in Supplementary Table 2.
Tumor xenograft study
To generate a xenograft model, 1 × 10⁷ cells/200 μL were injected subcutaneously into the dorsal flank of each mouse (8-week-old, male, BALB/c-nu/nu). After 2 weeks, mice were sacrificed, and subcutaneous nodules were collected. For establishing the tumor metastasis model, 1 × 10⁶ cells/100 μL were injected into the tail vein of each mouse (8-week-old, male, BALB/c-nu/nu). After 4 weeks, mice were sacrificed, and the weights of mice livers were recorded.
After tumor weights were recorded, all tissues were fixed with 4% paraformaldehyde. Animal experiments were approved by the Committee on the Use of Live Animals in Teaching and Research (CULATR), Renmin Hospital of Wuhan University (No:11400700326686 and No:110011111003022). Animals care was in accordance with institution guidelines.
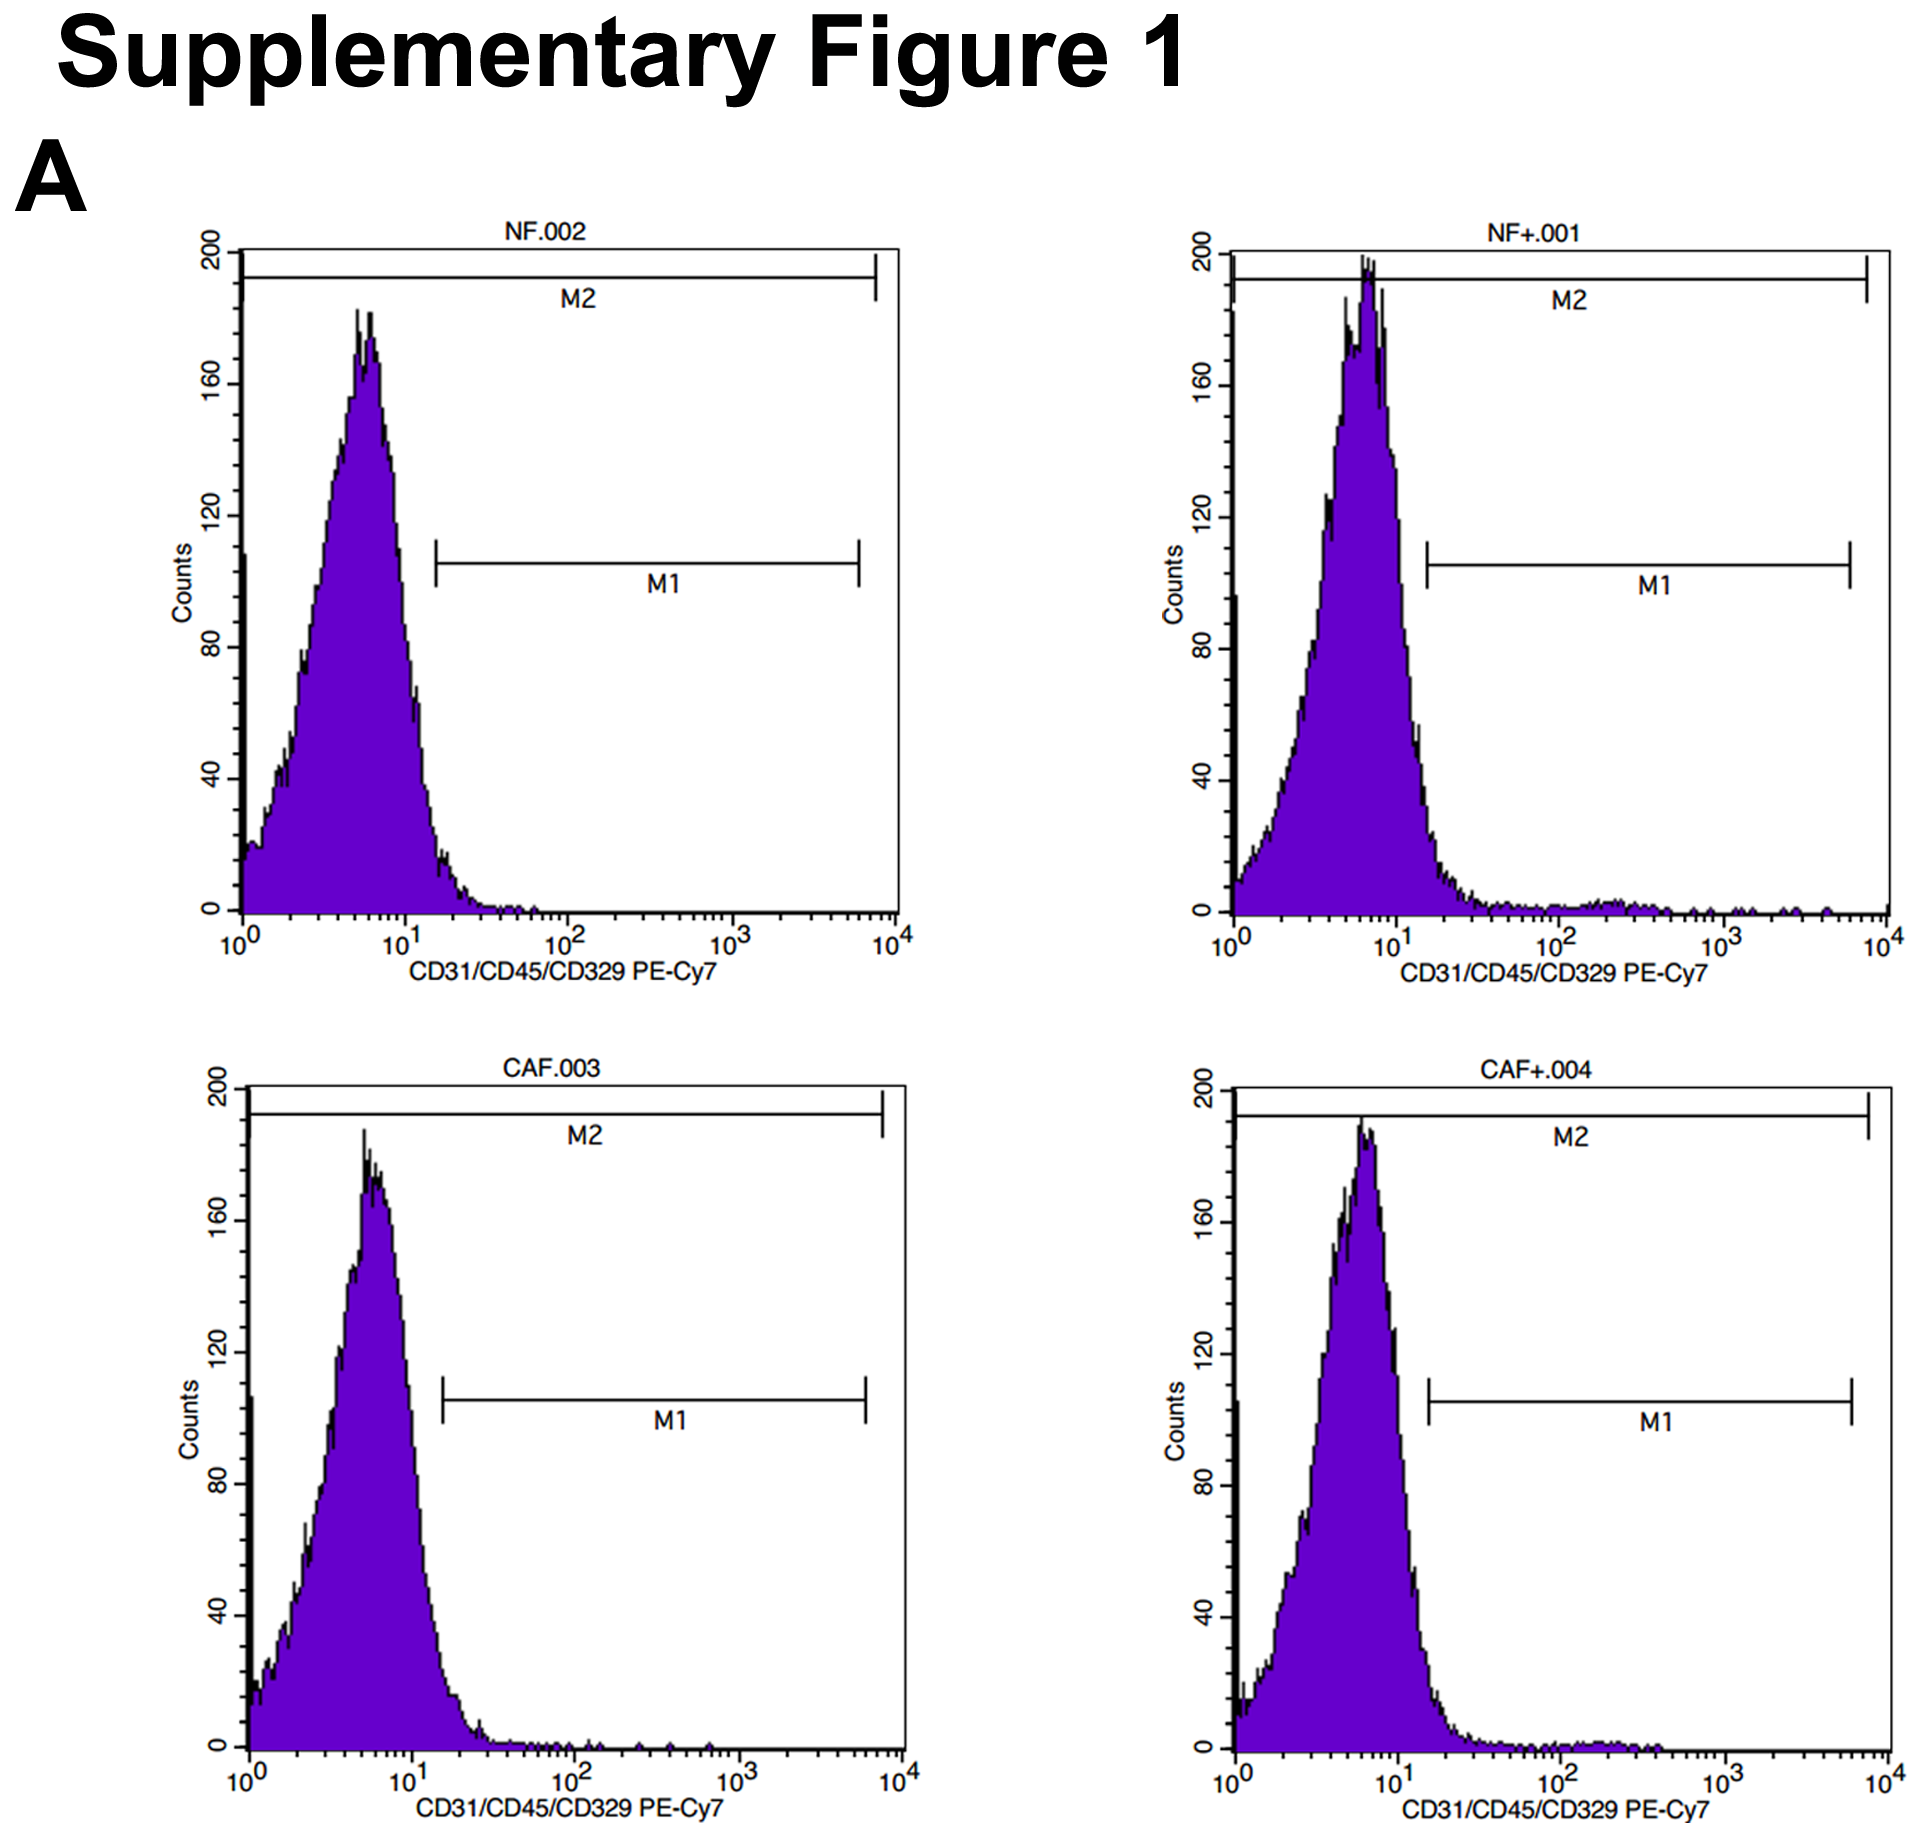
Isolation of NFs and CAFs from CRC and normal tissues
Fresh tissues were cut into small pieces (around 1 mm3) and subjected to enzymatic digestion in DMEM supplemented with 5% FBS following the instructions of the tumor dissociation kit (Miltenyi Biotec, Bergisch Gladbach, Germany). Next, cells were filtered through a 100-μm cell strainer (Thermo Fisher Scientific, MA, USA) and resuspended and cultured in fibroblast medium (FM). Flow cytometry using a CD31-Cy7 conjugated antibody, CD45-Cy7 conjugated antibody, and CD329-Cy7 conjugated antibody was performed to confirm the absence of endothelial, immune, and epithelial cell contamination in the primary fibroblasts.
Preparation of Conditioned Medium
Fresh human CRC and adjacent normal tissue samples were obtained directly from the operating room. Tissues were weighed and preserved in Falcon tubes containing 10 mL of DMEM with antibiotics (100 U/mL penicillin, and 100 mg/mL streptomycin) to avoid bacterial or fungal contamination. Tissues were cut into similar sized pieces and cultured with DMEM for 12 h. Then, collected conditioned medium (CM) was collected, and filtered through 40-μm cell strainers (Thermo Fisher Scientific, MA, USA) to obtain tissue-conditioned medium and stored at -80°C until further use.
After the SW480 cells (vector/WNT4-HA) grew to 70–80% confluency, then cells cultured in DMEM medium (no FBS) for 24h. CM was obtained and centrifuged (1000 rpm, 10 min), and the supernatant was filtered through a 0.22 μm filter (Beyotime Biotechnology, China) and stored at 4 °C for treating HUVECs.
Tube Formation Assay
The tube formation assay was performed following the manufacturer’s protocol (BD Biosciences, Franklin Lakes, NJ, USA, https://www.bdbiosciences.com). In brief, 50 μL of growth factor reduced Matrigel (BD Biosciences company, San Jose, CA, USA) was added to each well of a precooled 96-well plate and allowed to polymerize at 37 °C. Subsequently, HUVECs or transfected HUVECs (sh-ANG2/scramble ANG2) were treated with CM from SW480 cells (vector/WNT4-HA) and pretreated with ICG-001 (10μM) 12 hours before collection. Subsequently, cell (50 μL) at a density of 1 × 10⁵ cells/mL were seeded onto the matrix gel and incubated at 37 °C for 12h. Then, cells were viewed under a microscope (OLYMPUS IX71, Japan) and imaged. The tube length was measured by ImageJ software (https://imagej.nih.gov/ij/, MD, USA).
Suspended spheres formation
The protocol used for analyzing sphere formation was described previously [17]. In brief, primary fibroblasts were labeled with PKH-26 (red) and mixed with GFP-transfected tumor cells (Scramble or sh-WNT4, WNT4-vector, or WNT4-HA) at a ratio of 3:1 in an ultra-low attachment plate (Corning, Albany, NY, USA) with DMEM medium at 37°C overnight. Typical heterospheroids were observed and counted using an inverted Olympus fluorescence microscope (OLYMPUS IX71).
Collagen matrix contraction assay
Contraction of collagen gels was performed in 96-well plates as previously reported [18]. In brief, collagen gel (Corning, Albany, NY, USA), matrigel (Corning, Albany, NY, USA), FM, FBS, and suspended fibroblasts (with or without 400 ng/mL WNT4 pretreatment) were gently mixed. Then, 100 µl of the mixture was added to each well of a 96-well plate and allowed to solidify at 37°C for 30 min before complete medium was added. For inhibitory experiments, both gels and media were incubated with 10 μM ICG-001.
Statistical analysis
All experiments were performed at least in triplicate. Data are presented as the mean ± standard deviation (SD). Data of the relationship of WNT4, CA199, and CEA expression with clinicopathological parameters of CRC patients are presented as the mean ± standard error of mean (SEM). Comparisons between two groups were performed by Student’s t-tests or Mann–Whitney U tests for continuous variables. Survival probabilities and recurrence rates were estimated using Kaplan–Meier survival analysis and differences between Kaplan–Meier curves were compared by the log-rank test. All statistical tests were two-sided. SPSS v17.0 (Chicago, IL, USA) was used for statistical analyses. P <0.05 were considered statistically significant. *P < 0.05, **P < 0.01.