Yield
An optimization study was completed using the yield and gel strength of extracted jellyfish gelatin. The yield of gelatin, derived either at an experimental scale or at an industrial scale, directly affects cost, productivity, and financial feasibility (Park et al. 2013; Zhang and Regenstein, 2017). In this experiment, fifteen experimental runs were performed to study the individual and interactive effects of three independent variables: concentration of HCl (X1) from 0.06 to 0.23 M, extraction temperature (X2) from 53.18 to 86.82 oC, and extraction time (X3) from 7.9 to 28.09 h. The quadratic model of fitted responses of gelatin yield (Y1), obtained by Eq. 1 showed high significance at satisfactory levels of R2 (> 70%).
Gelatin yield (%,Y1) = 26.80 + 5.00X1 + 3.71X2 + 1.61X3 − 2.88 × 1 × 1–2.75 × 2 × 2–3.03 × 3 × 3 + 0.13 × 1 × 2 + 0.04 × 1 × 3–5.19 × 2 × 3 (1)
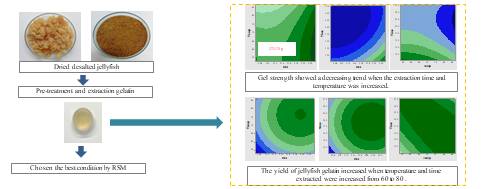
Extracted jellyfish gelatin yield varied significantly with conditions. The effect of the independent variables (X1 and X2, X1and X3, X2 and X3) on yield of the jellyfish gelatin are visualized in a 3D-view of response surface plots in Fig. 1A-1C. The results reveal that the highest actual yield of jellyfish gelatin was 34.30% for extraction using 0.20 M HCl at 80 oC for 12 h (JFG4) and the lowest actual yield was 5.50% with the condition of 0.06 M HCl at 70 oC for 18 h (JFG 9). In general, this experiment showed that the yield of jellyfish gelatin increased with higher acid concentrations, elevated temperatures, and extended extraction durations. The extraction optimization condition of 0.19 M HCl (X1), 81.40 oC (X2), and 8.1 hr (X3) gave a predicted gelatin yield of 25% and a gel strength of 280 g. Actual results showed a gelatin yield of 27.3% and gel strength of 284.14 g, verifying this prediction. The gelatin yield values fell within the correlation coefficient range of each predicted value.
In general, this experiment showed that the yield of jellyfish gelatin increased with higher acid concentrations, elevated temperatures, and extended extraction durations. The samples used were desalted jellyfish which had undergone the process of denaturation during salting with various salt chemicals (Klaiwong et al. 2014). Because of this, the collapsed jellyfish collagen protein needed to be swollen prior to using hydrochloric acid at high temperature (80 oC) for an extended period of time (12 h). Then, to extract gelatin, the disintegration of the swollen collagen and continued denaturation was needed. Note that the high acid concentration can disrupt peptides in the collagen molecule, causing denaturation of collagen and changes in gelatin production (Nalinanon et al. 2008). Also, Kim et al. (2020) reported that a high temperature effect can increase the extraction yield of collagen. This can be explained by noting that heat treatment can disrupt the hydrogen bond in collagen and denature the three-dimensional structure of collagen to form gelatin (Du et al. 2013). During the extraction, action of hydrochloric acid at elevate temperature or long duration time destroyed hydrogen bonds within the triple helix collagen structure and hydrolyzed peptide bonds, thereby causing the denaturation of collagen to soluble gelatin (Benjakul et al. 2009). Zhang and Regenstein (2017) highlighted the fact that the yield of gelatin samples varied depending on raw material and extraction conditions.
The result was improved extraction as per the works of Rodsuwan et al. (2016) and Chancharern et al. (2016), due to the differences in extraction step, type, and concentration of chemicals used. Rodsuwan et al. (2016) reported that the yield of type A jellyfish gelatin varied from 19.43–40.54%, and Chancharern et al. (2016) showed the highest yield of type A jellyfish gelatin of 39.47% via pre-treatment with sulfuric acid solution with pH 2, sodium hydroxide solution with pH 14, and extraction conditions of 75oC for 12 h. However, the lower yield of jellyfish gelatin could be due to the loss of small proteins through the series of washing steps.
Gel strength
Gel strength is a prominent physical property needed for grading the quality of gelatin. This strength is created by a gel network consisting mainly of hydrogen bonds with water molecules. Another measurement of strength is determined by what is called the bloom value, including low (< 150), medium (150–220), and high bloom (220–300) (Johnston-Bank, 1983). In this study, the gel strength was monitored from TPA curves instead which is closely related to sensory evaluation (Lau et al., 2000). Results showed the quadratic model of fitted responses of Y, gel strength (Y2) obtained by Eq. 2.
Gel strength (g, Y2) = 85.6 + 44.9X1 − 30.5X2 – 144.9X3 + 20.2 × 1 × 1–10.9 × 2 × 2 + 25.1 × 3 × 3 + 5.0 × 1 × 2–16.1 × 1 × 3 + 3.0 × 2 × 3 (2)
The response surface plots of gel strength as affected by of the independent variables (X1 and X2, X1 and X3, X2 and X3) are visualized in Fig. 2A-2C. Gel strength can be affected by several key factors, including the extraction procedure and type of raw materials used (Tümerkan et al. 2019). During this experiment, the commercial bovine gelatin (CBG) used as a positive control had a gel strength of 360 g. The maximum gel strength of extracted jellyfish gelatin (JFG1) was 323.74 g at the condition of 0.10 M HCl, 60 oC, and 12 h (JFG1) and the lowest gel strength was 8.79 g with the condition of 0.15 M HCl at 70 oC for 7.9 h (JFG 13). The predicted response value of gel strength was 280 g with optimization condition of 0.19 M HCl at 81.40 oC for 8.1 h. The predicted optimal conditions were verified and exhibited gel strength of 284.14 g. Gel strength showed a decreasing trend when the extraction temperature and time were increased. All jellyfish gelatin samples showed the ability to form weak gel. Note that high temperature causes hydrolysis and destroys the bonding of collagen bundle. In addition, the long duration time of acid extraction assists the denaturation process, thus generating a number of shortened peptide chains rather than long peptides chain and lowering the value of gel strength. Ahmad et al. (2010) mentioned that gel strength depends on the proportion of proline and hydroxyproline in the raw material used for gelatin extraction. The cross-linking of swollen peptide chains, corresponding to the gelling effect caused by gelatin protein, was also affected by the degree of protein degradation (Park et al. 2013). However, the shorter chain lengths of gelatin cannot form a strong gel due to the lower inter-junction zones (Intarasirisawat et al. 2007). The differences in the imino amino acids (proline and hydroxyproline) and molecular weight distribution of hydrolyzed protein could also influence the strength of gel (Gudmundsson, 2002). The quality of gel strength can be affected by several key factors such as extraction procedure and type of raw material (Tümerkan et al. 2019).
The extraction results of this experiment were dramatically improved compared to the results of other studies. The type A jellyfish gelatin reported by Rodsuwan et al. (2016) had a gel strength of 118 g, whereas Chancharern et al. (2016) reported this gel strength being in the range of 62.33–108.36 g. The differences between this study and those are due to the variation of pre-treatment, extraction condition of acids, temperature, and time. Extraction pH and differences in species also affect gel strength. In this study, maintaining an extraction pH of 6.5-7.0 resulted in minimally reduced networking strength of jellyfish gelatin, perhaps since the protein peptide chains were not significantly shortened. Regarding the species differences, Cho et al. (2005) reported that marine gelatin had lower gel strength than mammalian gelatin; examples include fishbone (230 g) (Sanaei et al., 2013), skins of brownbanded bamboo shark and blacktip shark (206–214 g) (Kittiphattanabawon et al. 2010), brownstripe red snapper (218.6 g) (Jongjareonrak et al. 2006), grey triggerfish (168.3 g) (Jellouli et al. 2011), and Atlantic salmon (108 g) (Arnesen and Gildbery, 2007). Based on the results, jellyfish gelatin can be classified as low or medium gel strength depending on the condition used for extraction.
Color of jellyfish gelatin gel
The color of gelatin gel affects food color quality and changes in its color depend on the reaction of resultants at the elevated temperature and duration time. Figure 3. shows the raw material salted jellyfish used (3A), dried desalted jellyfish (3B), and jellyfish gelatin at optimal condition (3C). The color of optimum extracted jellyfish gelatin showed its Hunterlab color values of L*, a*, and b* were 31.82 ± 0.03, 0.96 ± 0.25, and 10.40 ± 0.23, respectively, while commercial bovine gelatin powder showed the values of L*, a*, and b* to be 69.80 ± 0.05, 5.96 ± 0.15, and 29.48 ± 0.35, respectively. The raw material of salted jellyfish appeared initially in light yellow and the color of all dried gelatin powders had a light brown. In this study, no bleaching step applied during extraction. This increased color of the resulting jellyfish was developed by Maillard reaction, a non-enzymatic browning reaction of reducing sugar and amino acid, and it can develop as a result of high temperature and long duration time (Be Miller and Huber, 2008). This was similar to results of Rodsuwan et al. (2016) mentioned that hue angle value of type A jellyfish gelatin appeared in shades of yellow. Kittiphattanabawon et al. (2016) reported that clown featherback skin gelatin extracted at a higher temperature and longer time resulted in more yellowness.
Gelling temperature (Tg) and melting temperature (Tm)
Gel melting point is one of the crucial characteristics of gelatin gels, which is associated with the molecular weight of protein and interactions of amino acid and protein chain (Karim and Bhat 2009). Figure 4. compares the dynamic viscoelastic profile of three different gelatins during gelling and melting. In this experiment, the jellyfish gelatin extracted from the optimum condition (0.19 M HCl, 81.40 oC, and 8.1 h) having a gel strength of 284.14 g compared to fish and bovine gelatin. Results showed different gelling and melting points when different gelatin samples used. The gelling and melting temperature values of jellyfish gelatin were 6.6 oC and 19.1 oC, which were lower than those values of bovine and fish gelatin, which displayed a weaker gel than the other gelatins. During cooling, G′ values increased sharply due to an increase in the amount of energy that is elastically stored, which indicates the rapid formation of junction zones, thereby forming a gel network. The gelling and melting temperature values of jellyfish gelatin were also lower than the shortfin scad gelatin and sin croaker reported by Cheow et al. (2007), which the gelling temperatures of sin croaker and shortfin scad gelatins were 7.1 and 9.9 oC, and the melting temperatures of those samples were 17.7 and 23.8 oC. The lower gelling and melting temperature of gelatins are possibly related to the lower imino acid content (Karim and Bhat 2009). Boran et al. (2010), indicating that low gel strength relative melting temperature.
Moisture, protein, amino acid and ash content of jellyfish gelatin
The protein content of optimal condition jellyfish gelatin analyzed by the Kjeldahl method shows slightly higher protein content (84.32%) than that content of commercial bovine gelatin (CBG) (83.20%) and commercial fish gelatin (CFG) (72.85%). The differences in protein content were associated with different raw materials used for gelatin extraction. Examples are the skin of tuna (75.30%) (Tümerkan et al. 2019) and the skin of bigeye snapper (93.66%) (Benjakul et al. 2009). However, the high protein content did not always exhibit a good quality of gelatin gel. The understanding of amino acid, in terms of quantity and type of amino acid, has many advantages to explain the mechanism in gel formation. The chemistry of collagen, as well as gelatin, has a typical series of glycine, hydroxyproline, and proline. The imino amino acids indicating hydroxyproline and proline play a role in the formation of a gel network. Although optimal jellyfish gelatin showing the protein content higher than CBG, results appear approximately 50% of the total imino amino acids in dried jellyfish gelatin samples (9.19 g imino amino acid/ 100 g) sample compared to CBG (19.99 g imino acids/ 100 g sample) (data not shown). It has known that hydroxyproline composition is playing a unique role in stabilizing the triple helix. It is not surprising that the lack of prominent imino amino acids results in low gelling and melting points as well as gel strength, thereby exhibiting instability of the gel network at room temperature. The ash or inorganic salt content influences on gel quality of gelatin. Following the gelatin standards, the maximum ash content of gelatin is 3%. In this experiment, the ash contents of all jellyfish gelatin founded less than 1%. The ash could be inorganic salts remaining after several wash steps. Van den Bosch and Gielens (2003) presented that adding the salts in the gelatin process influence on both the (un) folding of the gelatin polypeptide chains and the hydrolytic activity of water.
Fourier transform infrared (FTIR) spectra
The FTIR spectra are used to monitor the secondary structure of gelatin and were noticeable in the amide region. The characteristic absorption pattern of amide I, amide II, amide III, amide A, and amide B at the wavenumber of 1651–1662, 1540–1560, 1230–1242, 3400–3440, 2939 cm− 1, respectively. The FTIR spectra of jellyfish gelatin present in Figures. 5A-5C. The analysis of amide I and amide II vibrations are the most analyzed for protein secondary structure prediction (Ee et al. 2019). The amide I vibration is related to a c = o stretching, and the absorption peak at amide I indicate changes of coil structure of gelatin (Ahmad et al. 2010). The low amplitude of frequency deals with the interaction of c = o with adjacent protein chains by a hydrogen bond. The amide II vibration is related to the CN stretch and NH bending of the peptide bond (Tümerkan et al. 2019).
The amide III referred to the peaks between C-N stretching and N-H deformation from amide linkages. The absorption comes from the CH2 group of glycine and proline. The high frequency of amplitude was due to the change of molecular structure from α-helical structure to random coil showing the denaturation of collagen to gelatin (Muyonga et al. 2004). The amide A is related to the stretching vibration of the free N-H group in the range of 3400–3440 cm− 1. The amide B is involved in asymmetric stretch vibration of = C-H- and -NH3+.
In this study, as the temperature of extraction increased from 60 oC to 80 oC, the amide I band shifted to a higher wavenumber. The lowest gel strength jellyfish gelatin found in JFG 9 samples extracted with 0.06 M HCl at 70 oC for 18 h (Fig. 5B), and JFG11 samples extracted with 0.15 M HCl at 53.18 oC for 18 h showed the lowest amplitude of the amide II band (Fig. 5C). The denaturation of collagen to gelatin by changing the triple helix state is in the amide III (1220–1320 cm− 1) (Friess and Lee 1996). In this present work, JFG1 samples displayed high gel strength (323.74 g) and showed a higher wavenumber at the amide III peak. The JFG1 and JFG2 samples found high absorption of Amide A at these wavenumbers 3400–3440 cm− 1. This harsher condition induced loss of the triple helix of collagen protein, and thereby enhanced disruption of the inter-chain interaction (Kaewruang et al. 2013). The result indicates that the application of a higher temperature of extraction directly disrupts hydrogen bonds in the collagen structure, causing induced changes in the secondary structure of the resulting gelatin. The denatured triple helix and disrupted the cross-linking occurs in the telopeptide region (Ee et al. 2019).
Electrophoretic analysis
Protein pattens of gelatin from jellyfish with extraction optimum condition (0.19 M, 81.40 oC and 8.1 h) compared with commercial bovine and fish gelatins are shown in Fig. 6. Different protein patterns appeared as different samples used. The protein patterns of jellyfish gelatin exhibited a greater number of peptides with molecular weight lower than α-chains, resulting in low functionalities such as low gelling and melting and low gel strength, compared to commercial gelatins. In this study, the gel concentration used was 7.5% which was different from most of electrophoresis research on gelatin. This could be the effect of salt concentration remain in the jellyfish gelatin sample, making the electrical pulse interaction between protein chain formed instability gel. This protein pattern was different from the SDS-PAGE gel of Klaiwong et al. (2014) that α1 and α2 bands exhibiting collagen protein at 135 kDa and 113 kDa were not appeared. This could be due to the hydrochloric acid extraction destroyed the collagen fibril to smaller protein chain.
Microstructure of gelatin gel
The microstructure of gelatin gel is related to the physical properties of the gel network. The scanning electron micrographs of three jellyfish gelatin gels (JFG1, JFG4, and JFG6) are presented in Fig. 7. The gel matrix directly contributed to the gel strength of jellyfish gelatin, and the network of all gelatin gels showed a coral-like structure. The JFG1, JFG4, and JFG6 samples were chosen based on the highest (323.74 g), medium (247.33 g), and lowest values of gel strength (182.83 g). The highest gel strength (JGF1) displayed a network with smaller voids in the gel (Fig. 7A, 7B). As the temperature of extraction was increased from 60 to 80 oC, pictures of larger voids and a disorderly network were clearly evident (Fig. 7E, 7F). The lower gel strength is caused by the coarser gel network and loosely arranged protein molecules during gelation, as affected by molecular weight distribution and size of peptide (Sinthusamran et al., 2014). However, the sizes of peptide obtained from each extraction condition must be further studied for a better explanation of jellyfish gelatin properties.