TiO2 decorated rGO (rGO-TiO2) have been synthesized by a base hydrothermal method in a one-pot process. TiO2 was obtained from titanium oxalate precursors that ti-oxalate was obtained from the reaction of TTIP with oxalic acid refer to reference [9]. Figure 1 shows that synthesized TiO2 material has a broadening peak indicating an amorphous crystal structure where the results were not the same as shown by Huang et al. (2016) [9] and Zhao et al. (2017) [10], which has high and narrow peaks. The appearance of dominant peaks is also seen in only two peaks, namely at 2θ = 25.33o and 48.36o. The 25.33o peak indicates the anatase [d101] of the TiO2 refer to [10], while the 48.36o peak indicates the anatase [d004] [9, 15]. The other anatase crystal planes (d) of [103], [200], [105], [211], [116], [220], [215] and [303] only appear in small peaks, which indicate that the TiO2 crystals have not yet grown perfectly so that the diffractogram pattern shows a low of crystallinity (peak broadening). The anatase phase is the metastable phase of TiO2 before it becomes rutile, where the anatase phase is thermodynamically stable at smaller particle sizes (< 11 nm) while rutile is stable at larger sizes (> 35 nm) [16].
The Diffractogram of TiO2 - rGO hybrid material shows different patterns for the addition of 2%, 4% and 10% GO. The diffraction pattern of TiO2 - rGO 2 shows two peaks at 2θ = 25.30o and 48.36o correspond to [101] and [004] of anatase phase TiO2 material. Then, the peaks at 2θ = 10.76o and 28.42o, respectively indicate peaks [001] of GO and [002] of rGO [8]. GO diffraction peaks indicates that the presence of TiO2 impacts the GO formation where at the reduction temperature of 300 oC without TiO2, rGO has formed perfectly as in Fig. 1. TiO2 material can increase the thermal resistance of GO so that at the same temperature, GOs are not converted to rGO. The diffractogram of TiO2 - rGO 4 and TiO2 - rGO 10 is different from TiO2 - rGO 2 diffraction patterns. The appearance of GO dominant peak at 2θ = 12.94o makes anatase TiO2 peaks smaller, while rGO [002] appears at 2θ = 28.95o. The peak of TiO2 [101] decreases with increasing GO addition that covers the existence of other peaks and it can also be known that TiO2 influences the formation of rGO, but also TiO2 growth is affected by GO, so the growth of TiO2 crystals is inhibited. Because the presence of GO is increasing and the amount of TiO2 is relatively fixed so GO cannot interact to TiO2 uniformly. At the same reduction temperature, more GO are converted to rGO for the addition of GO 2%.
The X-ray diffraction results are supported by FTIR characterization data that is shown in Fig. 2. The spectra of TiO2 have absorption at 468 cm− 1 and 908 cm− 1 wavenumbers which indicate the existence of stretching and binding vibrations of Ti-O-Ti and Ti-O [16, 17]. Then, the absorption at wave numbers of 1626 cm− 1 and 3383 cm− 1 show the stretching vibration of the hydroxyl functional group (OH) which is derived from the absorption of H2O molecules on the surface [18, 19]. Modification of TiO2 with rGO is known from the appearance in the FTIR spectra of TiO2 addition of 2, 4 and 10% GO. The three spectra showed relatively similar patterns of around 500 cm− 1 as Ti-O-Ti and Ti-O-C vibration [20], absorption around 3400 cm− 1 shows O-H vibrations. The bonding due to interactions between TiO2 and rGO is characterized by new absorption band that appears at around 1000 cm− 1 as the interaction of TiO2 with C atoms from rGO [19, 21].
The broadening absorption at the wavenumber of 3400 cm− 1 indicates the existence of the remaining O-H functional groups of irreducible rGO, which is useful as a site of interaction between rGO and TiO2 [19]. Absorption around the wavenumber of 1600 cm− 1 in the modified material spectra indicates the existence of vibrations from Ti-O-C bonds [22]. The results of X-ray diffraction characterization and FTIR spectrophotometry show that there is an interaction between TiO2 and rGO.
SEM imaging obtained the micrograph that is shown in Fig. 3. Figure 3 (a) shows that it has an agglomerated shape so that it appears micro-sized agglomeration of TiO2. Whereas the modification with 10% GO, Fig. 3 (b) shows that the graphene sheets (rGO) have micro-scale wrinkled layers which TiO2 grows on its surface. The growth TiO2 has a different morphology when growing alone (without rGO). TiO2 is not agglomerated but instead shaped a nanometer size rod-like. It shows that rGO is used as an anchor agent for TiO2 preventing agglomeration [19].
Surface area and pore analyzer characterization (Fig. 4) shows that materials of TiO2, TiO2 - rGO 2, TiO2 - rGO 4 and TiO2 - rGO 10 have relatively similar curve patterns that all curves based on the IUPAC classification have a type IV adsorption - desorption pattern [23] with hysteresis loops H2 [15, 24]. According to Lv et al. (2017), if the hysteresis area of the loops is increasing, become less mesoporous.
Table 1
Surface area specific and averages pore size of TiO2, TiO2 - rGO 2, TiO2 - rGO 4 and TiO2 - rGO 10.
| Material | BET Surface area (m2/g) | Averages pore size (nm) |
| TiO2 | 231.58 | 4.66 |
| TiO2 - rGO 2 | 216.35 | 5.98 |
| TiO2 - rGO 4 | 242.16 | 5.70 |
| TiO2 - rGO 10 | 248.58 | 6.36 |
In this study, the higher GO addition making the hysteresis area loops increase, then the mesoporous site increases. The BET active surface area from TiO2 material is 231.58 m2/ g (Table 1). The higher the active surface area, can improve the increasing ability to interact with reactants. The higher GO addition obtains a more considerable surface area value as well. Increasing surface area can also be caused by reduced aggregation of TiO2 [25]. The decrease in aggregation due to rGO as an anchor agent is following SEM data in Fig. 3.
The maximum pore size distribution is shifting as more GO are added which is caused by a decrease in the aggregation of TiO2 [24]. The pattern of broadening the pore size distribution (Fig. 5) also indicates the presence of mesoporous sites in the material that is by the adsorption-desorption data isothermal.
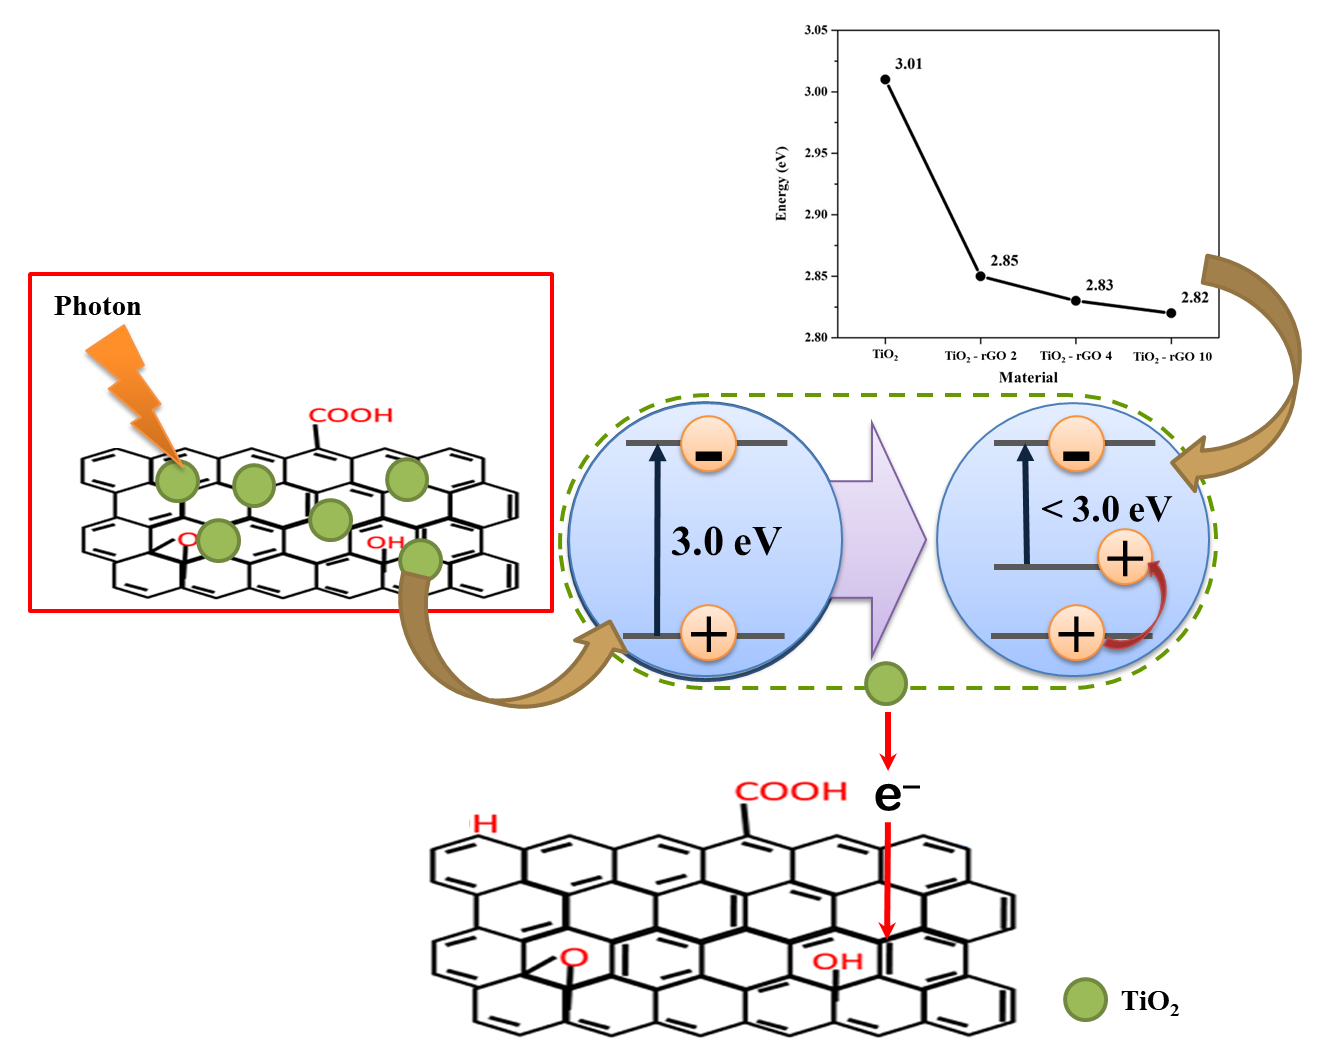
The bandgap energy indicates the minimum energy to excite electrons from the valence band to the conduction band for initiating catalysis reaction which the decrease in the bandgap shows the photocatalyst ability to work in visible light increases [18].
The bandgap energy measurement shows that TiO2, TiO2 - rGO 2, TiO2 - rGO 4 and TiO2 - rGO 10 materials have Eg values of respectively 3.01, 2.85, 2.83 and 2.82 eV. The Eg indicates that there has been a redshift (in the direction of visible light), as shown in Fig. 6. Testing of photodegradation performance of material modified against RhB was performed using the UV-Vis spectrophotometry method at a maximum λ of 554 nm. Measurements were performed in the range of 240 minutes by taking every 30 minutes. The initial 30 minutes measurement was performed with the lamp not turned on to achieve adsorption-desorption equilibrium [10, 20].
The tungsten lamp (300 W) was used as a source of visible light. Modification of TiO2 with rGO can improve photodegradation performance where the percentage of degradation reached 26.49%, 29.30% and 34.32% for 2%, 4% and 10% GO addition. The increase in the percentage of RhB degradation is due to several things, such as increased active surface area and more visible light absorption [18].
Table 2
Percentage of photodegradation under visible and UV light irradiation.
| Material | % Degradation a |
| Visible | UV |
| TiO2 | 20.11 | 71.98 |
| TiO2-rGO 2 | 26.49 | 79.39 |
| TiO2-rGO 4 | 29.30 | 81.66 |
| TiO2-rGO 10 | 34.32 | 86.81 |
| a: time of 240 minutes |
| The electron transport in TiO2-rGO causes the activation energy of electron excitation to decreases with Ti-O-C interaction, so the number of electron-holes photogenerated is increasing. Then, the excited electron does not directly recombine with the hole because of the presence of rGO that the electron will be transferred to the surface of rGO which has electronic conductivity properties. |
The photodegradation performance of the modified material was also carried out under UV irradiation, shown in Fig. 7 (b). The degradation percentage of the modified material also increases to 86.81% for the addition of 10% GO (Table 2). This enhancement shows that rGO can impact an increase of TiO2 photodegradation activity.
The stability of photodegradation activity is shown in the graph in Fig. 8. Figure 8 shows that the photocatalyst is still working well after being used for five cycles, as evidenced by an insignificant decrease. The TiO2-rGO 10 material even shows only a decrease of 6.58% after using five cycles. The ability of photocatalyst activity and good stability shows that modification with rGO can improve the photocatalytic properties of TiO2 where both materials work together to produce a good photodegradation performance [26] [27].