Phenotyping correlations in the progeny population
We phenotyped 34 lines for 17 plant traits in three trait categories (Table 1), namely Biotic Stress: P. infestans resistance in leaves (PIR), tuber blight caused by P. infestans (TBS), Dickeya response (DR, suseptibility), Lesions after Alternaria infection in leaves (LAI), Alternaria infection volume (AIV) in tubers, degree of HR-like lesions (HRL); Tuber: Number of tubers (NoT), Tuber greening in field (TGF), Visible tubers close to soil surface (VT), Yield per plant 2013 (YP13), Yield per plant 2014 (YP14); Leaf/Shoot/Flower: Senescence level in the late season (SLS), Growth rate (GR), Height (H), Level of necrotic leaves in the late season (NLL), Leaf texture (LT), Flowering time (FT). Among the 17 traits, three were categorical and the rest were quantitative (Table 1). The progeny lines show clear difference in scoring values for most traits and scoring values of the parents are often different from the average values of the traits in the segregating progeny lines (Table 1). The phenotype data for all traits underlying the analysis is included as Additional file 1 Table S1.
In order to relate phenotypes to each other, Spearman correlation was calculated based on trait values (Table 2). As could be expected, several growth phenotypes such as tuber yield (2013 and 2014; linear regression of R2=0.31 between seasons), height and growth rate are positively correlated with each other. These trait correlations are well-known in different potato growing systems (e.g. [12, 13]). The growth-related traits were negatively coupled to flowering time and senescence, which if late led to less tuber yield, reflecting the necessity for not too late development for high yielding cultivars in Nordic climates, which have relatively short growth seasons. Similarly, necrotic lesion development in field and HR-like response in the lab were negatively correlated with yield. The degree of HR-like lesions observed in the lab were clearly positively correlated with an increased number of necrotic spots observed in the field.
Of the disease traits measured, Alternaria infection in tubers correlated positively with yield, growth rate and height, whereas less Alternaria infection was correlated with later senescence in the field, and late flowering time as reported earlier [14].
P. infestans susceptibility did not correlate with any of the other measured traits, and this reflect the 1:1 presence or absence of this single dominant resistance gene recently identified by us to drive the late blight resistance in this progeny population [10]. Interestingly, a number of transcripts changing in abundance were identified as possible effects of the presence of the R-gene, discussed below.
Transcriptome assembly and annotation
In total, 875.6 million paired-end reads were sequenced from the 34 segregating potato lines. The average read count per line was approximately 25 million reads. After read quality control, only cleaned reads with a quality score higher than 20 and read length longer than 20 bp were considered for the analysis.
Sequence variations between genotypes can affect read alignment. Therefore, we generated a master transcriptome based on sequence data from all lines and the two parents to map all reads back to. In order to build a master transcriptome, all the sequenced samples from the 34 lines were pooled. The de novo assembly of the master transcriptome yielded a total of 212,536 contigs with a minimum length of 201 bp, a N50 value of 1,177 bp and an average length of 724 bp. To ensure quality of the assembly, reads were mapped back to the master transcriptome and a satisfactory average of 83% successfully mapped reads per sample was achieved (Table S2. The assembly was further evaluated for sequence completeness through BUSCO, which identified 1258 out of 1440 ultra-conserved core proteins as ‘complete’ in the transcriptome assembly, corresponding to 87% complete genes. 68 sequences were identified as ‘fragmented’ b BUSCO (Additional file 2 Table S3). This is slightly lower completeness than has been reported for potato transcriptomes, however it should be remembered that
the master transciptome originates from leaf tissue only and excludes roots, possibly leading to a lower completeness. The master transcriptome was annotated against the ITAG and PGSC genome annotations and the Uniprot database by BLASTX. A total of 185,189 (87.13%) ITAG annotations, 178,635 (84.04%) PGSC annotations and 122,104 (57.45%) Uniprot annotations were associated to assembled transcripts. All the transcripts were matched against sequenced potato genome by BLASTN to identify genomic locations of assembled transcripts. A detailed summary of Uniprot, ITAG, PGSC and Gene Ontology (GO) annotation along with transcripts identifiers can be found in Additional file 2 Table S4.
Transcript abundance and differential gene expression analysis
Transcriptome abundance estimation was performed to find common transcripts among all 34 progeny and two parent lines. Common transcripts were identified from normalized read count with FPKM value greater than or equal to 1 and it revealed that 21,708 (10.25%) transcripts were expressed in all 34 progeny lines and both parents, Desirée and SW93-1015. As expected, highly abundant transcripts were related to plant photosynthesis and central metabolism. A list of commonly expressed transcripts along with their functional annotation is given as Additional file 3 Table S5. 5,484 transcripts with annotations were differentially expressed between lines (FDR <0.05, 2-fold change). A list of differentially expressed transcripts is given in Additional file 3 Table S6. A principle component analysis (PCA) of the transcriptome data was done, which shows a distinction between the parents as well as that several lines are different compared to the parents (Additional file 4, Figure S1a), and numbers of differential gene expression in progeny lines in comparison to parents are shown in Figure S1b together with the method to calculate these in Methods S1 (Additional file 4, Figure S1b and Methods S1). GO analysis did not show clear overrepresentation of certain categories (data not shown).
Gene expression analysis for categorical traits
Phenotype of three traits were categorical: Phytophthora infestans resistance (PIR; resistance or susceptible), Leaf texture (LT; soft or stiff), and Flowering time (FT; early or late). In addition to the correlation analysis, we therefore performed a differential gene expression analysis for categorical traits by DESeq2 (p<0.05) using the trait categories as replicates. However, significantly differentially expressed genes were found only for P. infestans resistance. A total of 83 transcripts were differentially expressed between resistant and susceptible lines (p<0.05; Fold Change>2; Additional file 5 Table S7, see below).
Phenotype and transcriptome correlations to identify trait-associated transcripts
For transcriptome-to-phenotype association, we only selected transcripts with an expression count (FPKM) more than five in at least eight of the 34 progeny lines and the two parents. A total of 18,542 transcripts fell within these selection criteria. This stringent threshold led to a considerable loss of transcripts identified by Trinity (212,536). To test the effect of the high loss of transcripts we matched the Trinity-identified transcripts, 212,536 and 18,542, respectively, to the PGSC genome (BLAST, e-value<1e-05), and found that these represented 28,933 and 10,926 unique PGSC transcripts, respectively. The true number of transcripts present in the leaf tissue probably lies somewhere in between these two numbers, but we decided to maintain the threshold chosen in order to avoid false positives. Previously ca 22,000 transcripts were detected in the leaf transcriptome in Phureja [15].
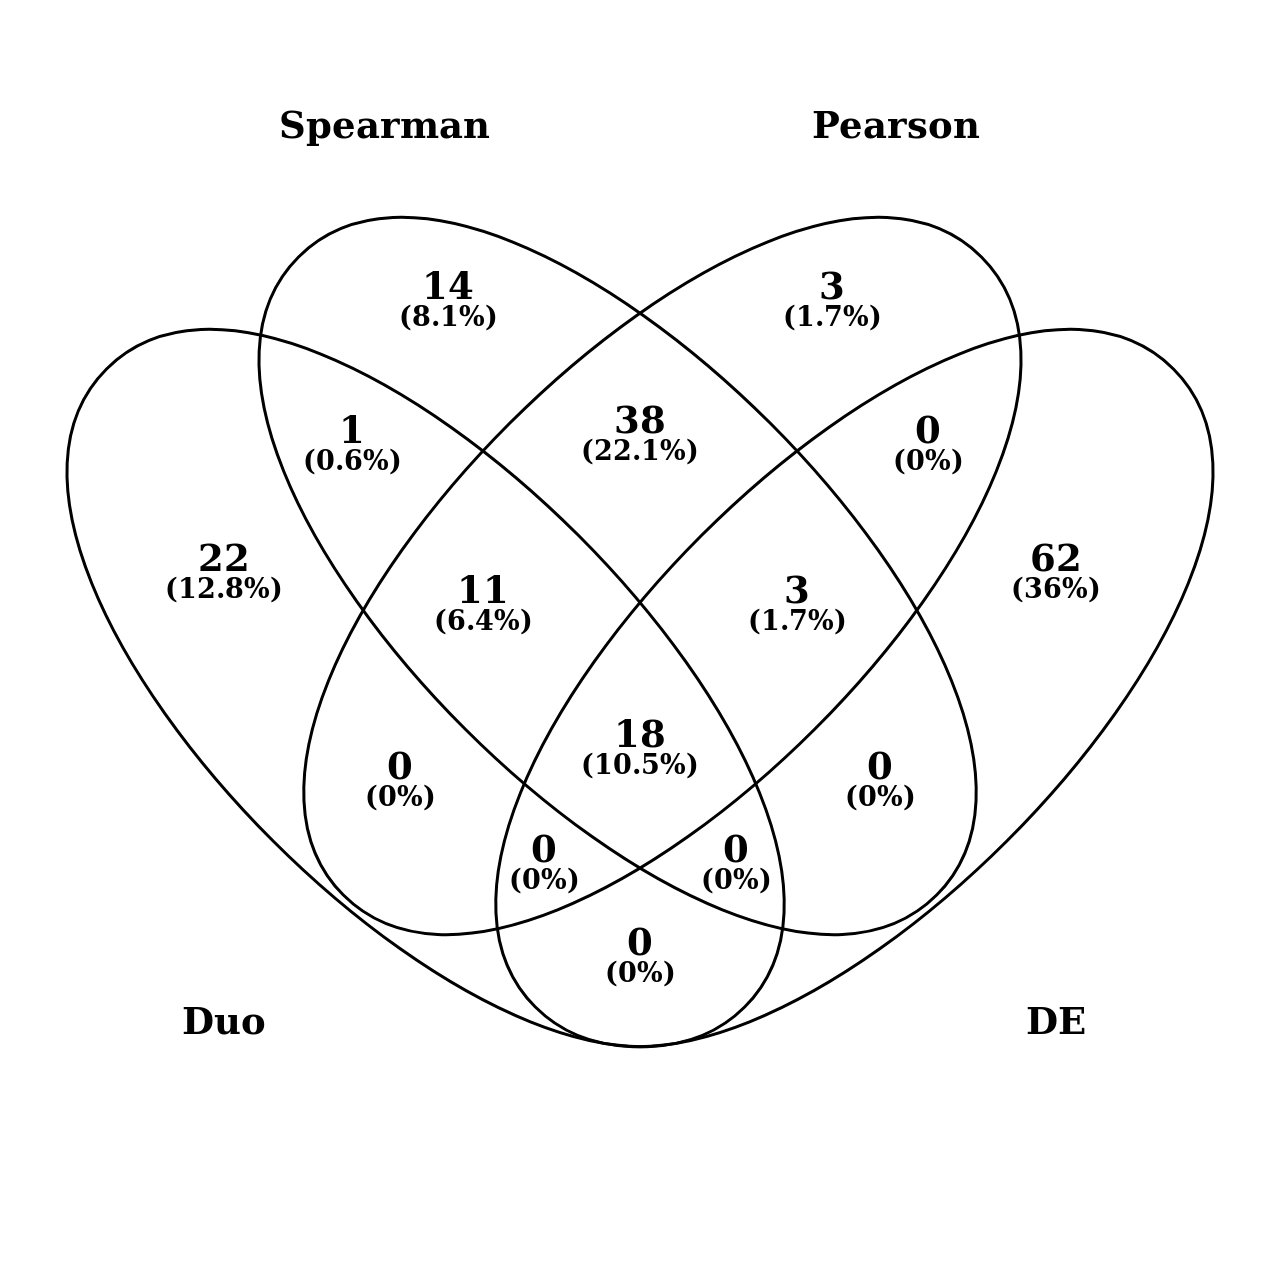
In order to explore gene expression and phenotype relationships, expression data and the phenotypic data were combined and scaled through mean and standard deviation. Pearson correlation coefficient (PCC), Spearman correlation coefficient (SCC) coefficient and DUO metric were calculated between transcript expression and trait values across all 34 progeny lines and the two parents. Among 18,542 transcripts subject for transcriptome-to-phenotype association, we identified 1685, 2185 and 273 transcripts related to traits by Pearson (r=≤-0.5 or ≥0.5), Spearman (r=≤-0.5 or ≥0.5) and DUO (≥0.65), respectively. The number of transcripts identified from Pearson, Spearman and DUO, for each trait and common transcripts between methods, and among all three methods, are given in Table 3 and Figure 1. The top 20 associated transcripts for each trait and PCC and SCC correlation are given in Additional file 6, Table S8 and S9.
Differences between DUO and Pearson/Spearman
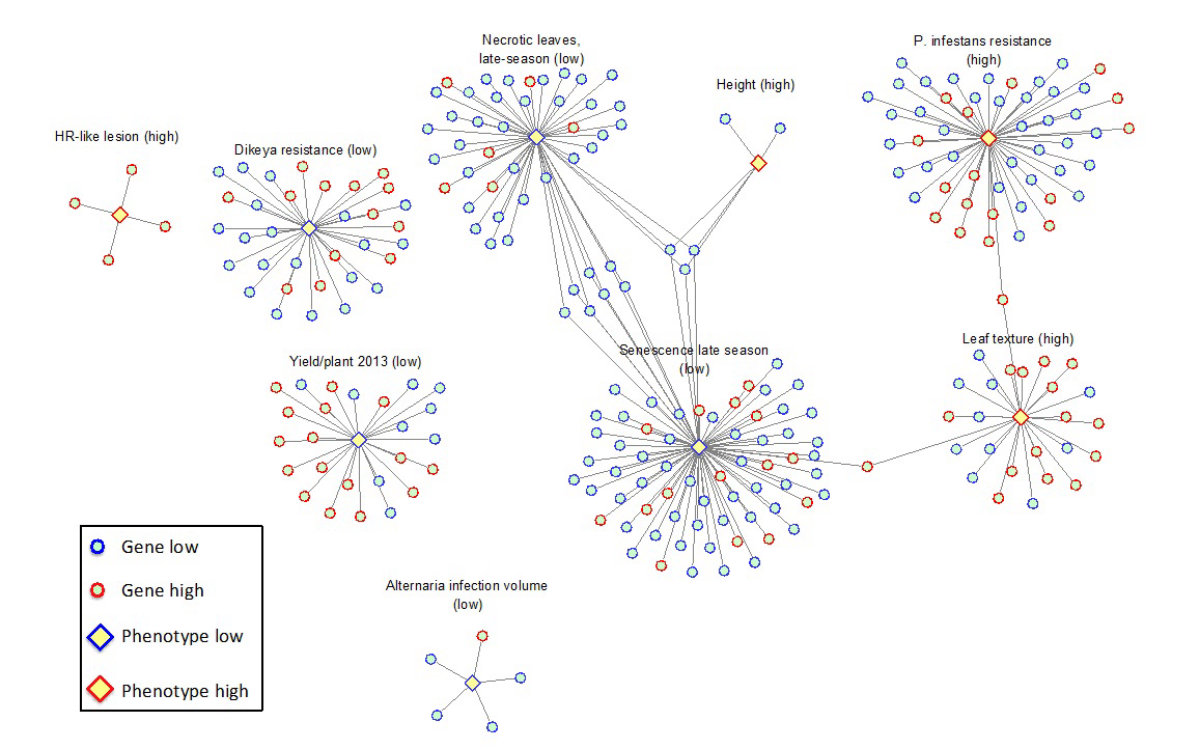
To link transcripts to traits, first Pearson correlation and Spearman's rank correlation coefficients were applied since they complement each other as the relationship between traits and transcripts can be expected to exhibit both linear and non-linear relationships. As can be seen in Table 3, most associated transcripts show a clear overlap between the methods. However, for some traits such as Tuber blight score there is a clear discrepancy. For a given transcript-trait pair, the DUO similarity metric measures the co-occurrence of extreme values between those two objects. DUO is unique in that it returns separate values for each type of correlation (e.g. high values of the first with low values of the second) thereby reducing errors induced by heterogeneity in the samples. Though the DUO metric finds lower numbers of associations than Pearson and Spearman, it does discover trait-transcript associations missed by those metrics (for example see Figure 2) and can thus be seen as complementary in nature. In Additional File 7 Figure S2 the correlation network (p≥0.65) based on DUO shows that some transcripts correlate with more than one trait, such as late senescence (SNS) and few necrotic lesions in field (NLN). More tests with empirical data and biological validations of gene-to-trait relations are needed, however, to better benchmark the methods against each other.
Identified trait-associated transcripts
Biotic factors
The population was tested with three different pathogens, which are common problems in European potato cultivation: Phytophthora infestans causing late blight, Alternaria solani causing early blight and Dickeya solani causing blackleg disease.
We identify several transcripts associated to the P. infestans leaf resistance (late blight) with DUO as well as Pearson and Spearman correlations (see below). Transcripts are regulated both positively and negatively with resistance. Interestingly, these can be seen as effects of the identified Rpi-ABPT (closest sequence identity with DMG400032576) gene in this population [10], and indicate that this receptor has some kind of basal role without challenge by P. infestans or other stresses as the transcriptomes were generated from plants in optimal conditions in controlled environments.
Low levels of the Rpi-ABPT gene transcripts were detected in some, but not all resistant lines, and this transcript did therefore not pass the threshold to be included in the association analyses (see Methods and Material; data not shown). The regulated genes also associates to the study of secreted peptides in this population, where all peptides used to predict resistance were less abundant in the resistant combination even without any disease [11]. This data also adds to the discussion about cost and trade-offs of resistance [16].
In the differential expression analysis by DESeq2 only up-regulated transcripts as a consequence of leaf blight resistance passed the threshold (adjusted p<0.05; Fold Change>2), in total 56 unique genes from different chromosomes (Additional file 5 table S6). As can be seen in Additional file 8 Figure S3 there is a substantial number of transcripts only detected by differential expression analysis. It should be noted that in the differentially expression analysis all detected transcripts were included, and the majority of transcripts only identified by in this analysis had low expression levels and consequently did not pass the threshold to be included in the association analyses (see above and Materials and Methods). Among differentially expressed genes were several related to disease resistance, whereof three fall in the large TIR-NBS-LRR resistance gene family (DMG400007743, DMG400032576 and DMG400011529) and other into smaller families unique to potato according to PLAZA4.0, such as Late blight resistance protein (DMG400046318) and Plant disease resistant protein (DMG400044298). Yet another NBS-LRR family member annotated as NRC1 (DMG400007462) was detected by Pearson correlation as negatively correlated with P. infestans resistance. Other noteworthy transcripts only identified by differential expression analysis are a Rhicadhesin receptor (DMG400037420), an Erwinia induced protein 2 (DMG400023621) and several members of Zinc knuckle family proteins (DMG400036915, DMG400022758, DMG400028865). Not much is known about their role in resistance, but the Zinc knuckle family has previously been shown to be expanded in Solanum species with high level of P. infestans resistance [17].
Few transcription factors were associated to leaf blight resistance. However, a TCP transcription factor (DMG400016363) was less expressed in lines with leaf resistance towards P. infestans, indicating that this transcription factor can be a putative susceptibility factor. This is a diverse group of transcription factors, many of which are involved in organ development but also in plant defence and in effector-triggered immunity (ETI) [18]. In fact, in a protein-protein interaction network of effectors and Arabidopsis immune proteins, no less than three of the identified immune interactors belonged to the TCP family. These were found to be directly targeted by effectors from both bacterium Pseudomonas syringae and the obligate biotrophic oomycete Hyaloperonospora arabidopsidis (Hpa), and single mutants of all these three TCPs lead to disease susceptibility of two normally avirulent Hpa isolates [19]. Apart from the TCP transcription factor DUO picks up a negatively associated MADS transcription factor (DMG400000008) with weak similarity to MADS-box transcription factor 50 (OsMADS50) in rice.
Three of the most highly correlated transcripts with P. infestans leaf resistance were an Arabinogalactan protein (DMG402032565), a Sodium/potassium/calcium exchanger (DMG400006339) and an Associate of C-myc transcript (DMG400025428) with unknown function, all of which were detected by the differentially expression analysis as well. A transcript encoding a chromodomain remodeling complex (DMG400006925) was clearly positively regulated with resistance and highly similar to AtBAF60 (AT5G14170), which was recently shown to mediate repression of seedling growth [20].
Flavonoids are generally associated to plant defence and a flavonoid 3-hydroxylase (DMG400006354) was found to be negatively regulated with leaf resistance also by differential expression analysis. Furthermore, DUO identified a Leucoanthocyanidin dioxygenase (DMG400003091), which is similar to the AtSRG1 (SENESCENCE-RELATED GENE 1) involved in flavonoid biosynthesis.
In this progeny population, tuber blight resistance was not linked to foliar blight resistance [11, 21], and there were only two transcripts, which correlated with P. infestans resistance in both leaves and tubers. The two transcripts, actin-depolymerizing factor 2 (DMG400027752) and FGFR1 oncogene partner (DMG400032551), are involved in cellular organisation were positively correlated to resistance. The latter is weakly similar to Arabidopsis AtTON1A, which mutant exhibit abnormal cell growth and patterns of division in epidermal and cortical cells [22].
However, a weak correlation existed between Alternaria tuber and tuber blight resistance (Table 2) but only one transcript encoding a gene of unknown function with a Rhodanese-like domain (DMP400033223) was correlating with both traits. For tuber resistance three WRKY transcription factors (DMG400020608; DMG400009530; DMG400028520) and a VAMP protein SEC22 (DMG400016420) linked to the enriched GO terms biotic stimulus and chitin response, were all negatively correlated with tuber blight resistance (Additional file 6).
d. solani susceptibility seems to be a quantitative trait in potato and no single gene resistance has so far been identified, which makes this trait especially interesting to study by expression correlation. Still, DUO, which should efficiently identify binary differences, found a number of putative receptors and transcripts associated to signalling. For example a transcript (DMG401017405) highly expressed in resistant lines, and which has homology to a gene encoding a GPCR-type G protein in Arabidopsis (AT4G27630). This protein is membrane-bound and reported to bind the phytohormone ABA, but does not show transcriptional regulation by abiotic stress [23]. A receptor serine-threonine protein kinase (DMG400017596) highly homologous to CDG1 kinases was also highly expressed with increased resistance. Contrarily, a transcript with low expression in resistant lines was an Arabidopsis nitrate transporter homolog (DMG400013815). An Arabidopsis protein has been reported to act as a sentinel of nitrogen availability, and to be associated with increased susceptibility to infections by bacteria Pseudomonas [24]. Three other transcripts associated by DUO with low expression in Dickeya resistant lines were a disease resistance protein in the CC-NBS-LRR class (DMG400018462), a Cf-2.1-like receptor (DMG400006655) and a reticuline oxidases (DMG400021111). The latter is regularly appearing as part of induced resistance responses in potato [25]. Much fewer transcripts were associated to D. solani resistance by Pearson and Spearman, but a Permease I homolog (DMG400024588) overlapped between the methods and was more lowly expressed in more resistant lines.
Only a handful of transcripts were matched to Alternaria leaf infections with DUO. However, GO analysis of transcripts identified by Pearson correlations showed an enrichment of transcripts linked to Systemic acquired resistance as well as jasmonic and ethylene responses (Additional file 9). Among these was a Jar1 homolog (DMG400033879), for which lines with higher expression show increased resistance. Jar1 catalyzes the formation of jasmonyl-isoleucine (JA-Ile) conjugate, which in its turn promote the interaction between JAZ1 and COI1 in the jasmonate signalling pathway. Similarly, an EIN3 transcription factor (DMG400005915) was generally more lowly expressed in more resistant lines. EIN3 interacts with MYC2, MYC3 and MYC4 to regulate plant defense. This indicates that these hormone pathways are varying depending on resistance level even in the absence of the pathogen.
Development and yield traits
To investigate the development and yield-related traits, we related the subset of 84 transcripts associated by DUO to these traits to Arabidopsis homologous genes (Additional file 10, Table S10). Indeed, several of the Arabidopsis homologs are related to growth and development, and several families of transcription factors are represented, and this is also true for the GO analysis (Additional file 9). However, transcripts related to the yield data of 2013 and 2014 did not show enrichment of specific GO terms.
Photosystem II CP47 chlorophyll apoprotein (DMG400046303) positively correlated according to Pearson and Spearman with yield, as was the gene encoding a Photosystem Q(B) protein (DMG400004211), also active in the light reactions. Contrary, transcript levels of UBX-domain protein UBX2 (DMG400029482) and an Acyl-CoA synthetase (DMG400020593) were negatively correlated to yield in both years. In Arabidopsis, the knock-out of a member of the UBX family led to increased growth rates [26].
For the highly correlated traits height and growth rate, the GO term “regulation of timing of transition from vegetative to reproductive phase” was overrepresented (Additional file 9). Associated to this term was a MADS box transcription factor (DMG400022748) and Flowering locus T (DMG400016179), which were negatively and positively correlated to the traits, respectively. Highly negatively correlated with height and growth rate was a GLABRA2 expression modulator (DMG400023632), which homolog in Arabidopsis regulates cell division and is part of the ABA signalling pathway [27]. High expression of this gene was also linked to less necrotic leaves in the late season. Furthermore, a putative squamosa promoter binding protein (DMG400022824), which is a transcription factor in Arabidopsis involved in regulation of flowering [28], was highly negatively correlated with height and growth rate, but positively related to early senescence.
Number of tubers showed many highly positively and negatively correlated transcripts. There was a GO enrichment for sugar-meditated signalling pathway (Additional file 9). Examples were a positively correlating mannitol transporter (DMG400011964) and a hexose transporter (DMG400009994), highly similar to Arabidopsis TMT2 (AT1G45249). Negatively correlating was an ABRE binding factor (DMG400008011), which is a transcription factor involved in ABA signalling. Also related to ABA signalling was a NAC domain transcription factor (DMG400009245; AT1G01720).
The leaf texture trait were associated with several transporters, such as an ammonium transporter 1 (DMG400028710), and cell wall proteins such as a polygalacturonase (DMG400002931).
Late flowering was associated to the increased expression of a gene encoding a Tuftelin interacting protein, which is highly similar to AtNTR1 (AT1G17070). A mutation in this Arabidopsis gene alters the circadian period [29]. Associated with late senescence was also a zinc finger protein (DMG401017733), which homolog in Arabidopsis is suppressing late flowering time [30]. Early senescence was also associated to higher expression of a Serine/threonine-protein kinase PBS1 homolog (DMG400004594). PBS1 is well described in Arabidopsis and is involved in PAMP-triggered immunity (PTI) [31].
Verification of marker transcripts by qPCR
To verify some of our putative transcript biomarkers expression analysed in a separate progeny population derived from an independent crossing using the same parents. Four lines with contrasting resistance and susceptibility for either early blight), Dickeya or tuber blight was chosen. The expression of five of these putative transcript biomarkers are shown in Figure 3 and all showed a trend with differences in expression between the pairs of more resistant and more susceptible lines as could be expected.
Thus, at least when crossing the same parents these results confirmed Glycerol-3-phosphate dehydrogenase (DMG400012712) and Aldo/keto reductase (DMG404006439) as biomarkers identified by DUO for early blight also in this progeny population. Furthermore, an AP2 domain class transcription factor (DMG400000681) and Protein GPR89A (DMG401017405) could be confirmed for Dickeya resistance, the latter of which was identified by DUO. Finally, the expression of a peroxidase (DMG400032199) was as expected in the separate progeny population for tuber blight disease.