This section explains the methodology used for this research, including the dataset used, the analysis process, the newly identified integrated input factors, the evaluation with machine learning models and the evaluation method. Fig. 1 illustrates the conceptual framework of our research.
Dataset
Data are retrieved from two official sources. The dengue fever incident and confirmed cases has published weekly on Ministry of Health Malaysia (MOH) portal and the report of location and number of dengue confirmed case is available and accessible on weekly basis from [12]. In order to access each of the files, the following link provides the access. However, the report number based on the weeks must be stated explicitly.
http://www.moh.gov.my/index.php/database_stores/attach_download/337/report number
For example to retrieve the report no. 234 (week10, 2012):
http://www.moh.gov.my/index.php/database_stores/attach_download/337/234
Besides that, this report can also be obtained via a simple search in any search engine by using the following search terms together with required week number and year:
“SITUASI SEMASA DEMAM DENGGI DI MALAYSIA Bagi Minggu week number/year”
English Translation:
Situation of Dengue Fever in Malaysia for week number/year
Moreover, the climatic data are obtained from Malaysian Meteorological Department (MMD) [50]. However, this data is available upon reasonable request from the authors.
Data were collected from two sources. We obtained weekly data on dengue confirmed cases based on two federal territories, namely, Kuala Lumpur (Wilayah Persekutuan Kuala Lumpur) and Putrajaya, from January 2010 to December 2013. The weather data of Kuala Lumpur and Putrajaya were retrieved from Malaysian Meteorological Department (MMD) for the period of January 2010 to December 2013 [50]. Thus, 209 weeks of confirmed dengue cases and meteorological data were evaluated in this study. However, approximately 8% of the data were missing in the MMD datasheets for the study period. Thus, we obtained the missing data for this period from the US Weather Channel Interactive (https://weather.com), which also provides Malaysian meteorological data. The data were fitted simultaneously with the Putrajaya–Cyberjaya Station in Malaysia. Only minimum temperature, maximum temperature, average temperature, minimum humidity and rainfall were selected because many studies have emphasised that these factors are the most important risk factors for dengue outbreak prediction models, as shown in Table 1. Figure 2 illustrates two plots of data from January 2010 to December 2013.
The data are combined and cleaned accordingly. The preprocessed data are analysed, and new detailed factors are identified. The factors are then integrated and fed as integrated inputs to different machine learning models and evaluated. The following sections provide a detailed description of each process involved in this framework.
Analysis
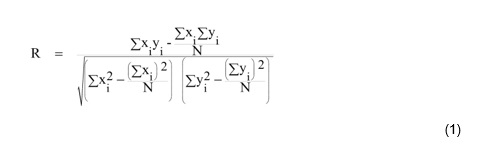
Weather data from MMD provide daily weather information, and the incidence of dengue cases is published weekly by MOH. Thus, data were normalised and classified into two levels namely, ‘low risk’ and ‘high risk’, on a weekly basis [51] Weather and meteorological factors play important roles in the incidence of dengue fever. Thus, the dataset was analysed, and the relationship between the incidence of dengue cases and weather information was determined every week using the Pearson correlation coefficient (PCC) [52].
Identification of Significant Factors
The most significant climate factors were identified based on the correlation analysis of the dataset, as shown in Table 2. The analysis result indicated that the highest correlation exists between minimum temperature and dengue incidence, followed by cumulative rainfall and the incidence of dengue cases determined in different weeks.
Minimum temperature and daily rainfall are the most significant dengue weather-based risk factors [36,53,54,55,56]. The average minimum temperature can be calculated as follows (Equation 2):
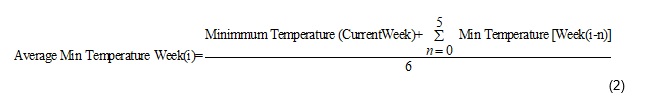
where i is the number of weeks from which the average minimum temperature and [Week(i−n)] is the minimum temperature of the prior weeks to the current week plus minimum temperature of current week [n=0]. To find average, the result divided by 6 [5 weeks before plus current week].
Table 2: Correlation between Dengue Incidence Cases and Climate Factors
|
Temperature
|
Mean relative Humidity
|
Rainfall
|
|
Minimum Temperature
|
Mean Temperature
|
Maximum Temperature
|
|
0.447
|
0.339
|
0.316
|
-0.176
|
-0.020
|
The cumulative rainfall for week i can be calculated using Equation 3, as follows:
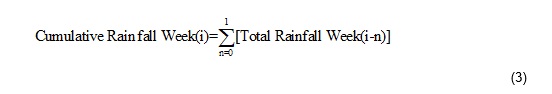
where i is the desired week from which the total rainfall will be calculated, cumulative rainfall week (i) is the final calculation and week (i−n) is the week prior to week (n ).
Table 3 provides the PCCs between the weather variables and the incidence of dengue cases. The underlined and highlighted high positive numbers showed the highest correlation and coefficients between weather parameters and the incidence of dengue fever. Table 3 presents the results for 7 weeks prior to the current week and the optimum value for the average minimum temperature (0.499).
Table 3: Pearson Correlation Coefficient (PCC) between Climatic Factors and Incidence of Dengue Cases
|
|
Average Minimum Temperature
|
Cumulative Rainfall
|
|
Current Week
|
0.447
|
–0.0201
|
|
1 Week Prior
|
0.465
|
0.0065
|
|
2 Week Prior
|
0.480
|
0.0071
|
|
3 Week Prior
|
0.494
|
–0.0005
|
|
4 Week Prior
|
0.498
|
–0.0123
|
|
5 Week Prior
|
0.499
|
–0.0139
|
|
6 Week Prior
|
0.489
|
–0.0045
|
|
7 Week Prior
|
0.476
|
0.0020
|
The highest value for cumulative rainfall (0.0071) was obtained for 2 weeks prior to the current week (Table 3).
Thus, the average minimum temperature of Week 5 (plus the current week) and the cumulative rainfall for Week 2 (prior to the current week) exhibit high correlation with dengue cases in accordance with the correlation analysis. The two factors will be regarded as TRF and used as input parameters for dengue outbreak risk level prediction. The combination of factors is shown in Fig. 3.
The cumulative rainfall for 2 weeks prior to the current week is identified as a significant factor because it coincides with the life cycle of an Aedes aegypti mosquito, i.e. approximately 2 weeks. Thus, this shows that there is a possibility that it may happen right after an A. aegypti mosquito completes its life cycle and becomes an adult [38, 53, 54, 55, 56, 57, 58].
Prediction using machine learning models
Once significant factors have been identified, the research proceeded towards predicting the risk incidence level of dengue fever. We considered high risk as existence of dengue outbreak and low risk as no outbreak. To predict this level, we tested five machine learning models using input factors with and without TRF. Table 4 provides the detailed input factors and descriptions.
Table 4: List of Input Factors used in prediction model with identified factors (TRF) and without TRF
|
Input Factors without TRF
|
Input Factors with TRF
|
|
Type
|
Parameter Description
|
Type
|
Parameter Description
|
|
Weather Factors
|
Minimum temperature (°C)
|
Weather Factors
|
|
|
Mean temperature (°C)
|
Mean temperature (°C)
|
|
Maximum temperature (°C)
|
Maximum temperature (°C)
|
|
Mean relative humidity (%)
|
Mean relative humidity (%)
|
|
Cumulative of rainfall (mm)
|
|
|
|
TRF Factors
|
Average of minimum temperature
5 weeks plus current week (°C)
|
|
|
Cumulative of rainfall for
2 weeks prior to the current week (mm)
|
On the basis of the high accuracies obtained [21, 59], we selected Bayes network (BN) models, support vector machine (SVM), RBF tree, decision table and naive Bayes to evaluate the factors using WEKA version 3.8.0 [60]. We used the cross-validation (10-fold) technique to evaluate the models.
Evaluation Metrics
We can evaluate the performance of classifiers on the basis of several accuracy measures and parameters. Moreover, some accuracy and error measures are used to determine the distance between the predicted and the actual known values [61]. In this study, we used the root-mean-square error (RMSE) to demonstrate the error rate [52, 62, 63].