3.1 Negative correlation of FKBP4 and TMEM173 in breast cancer
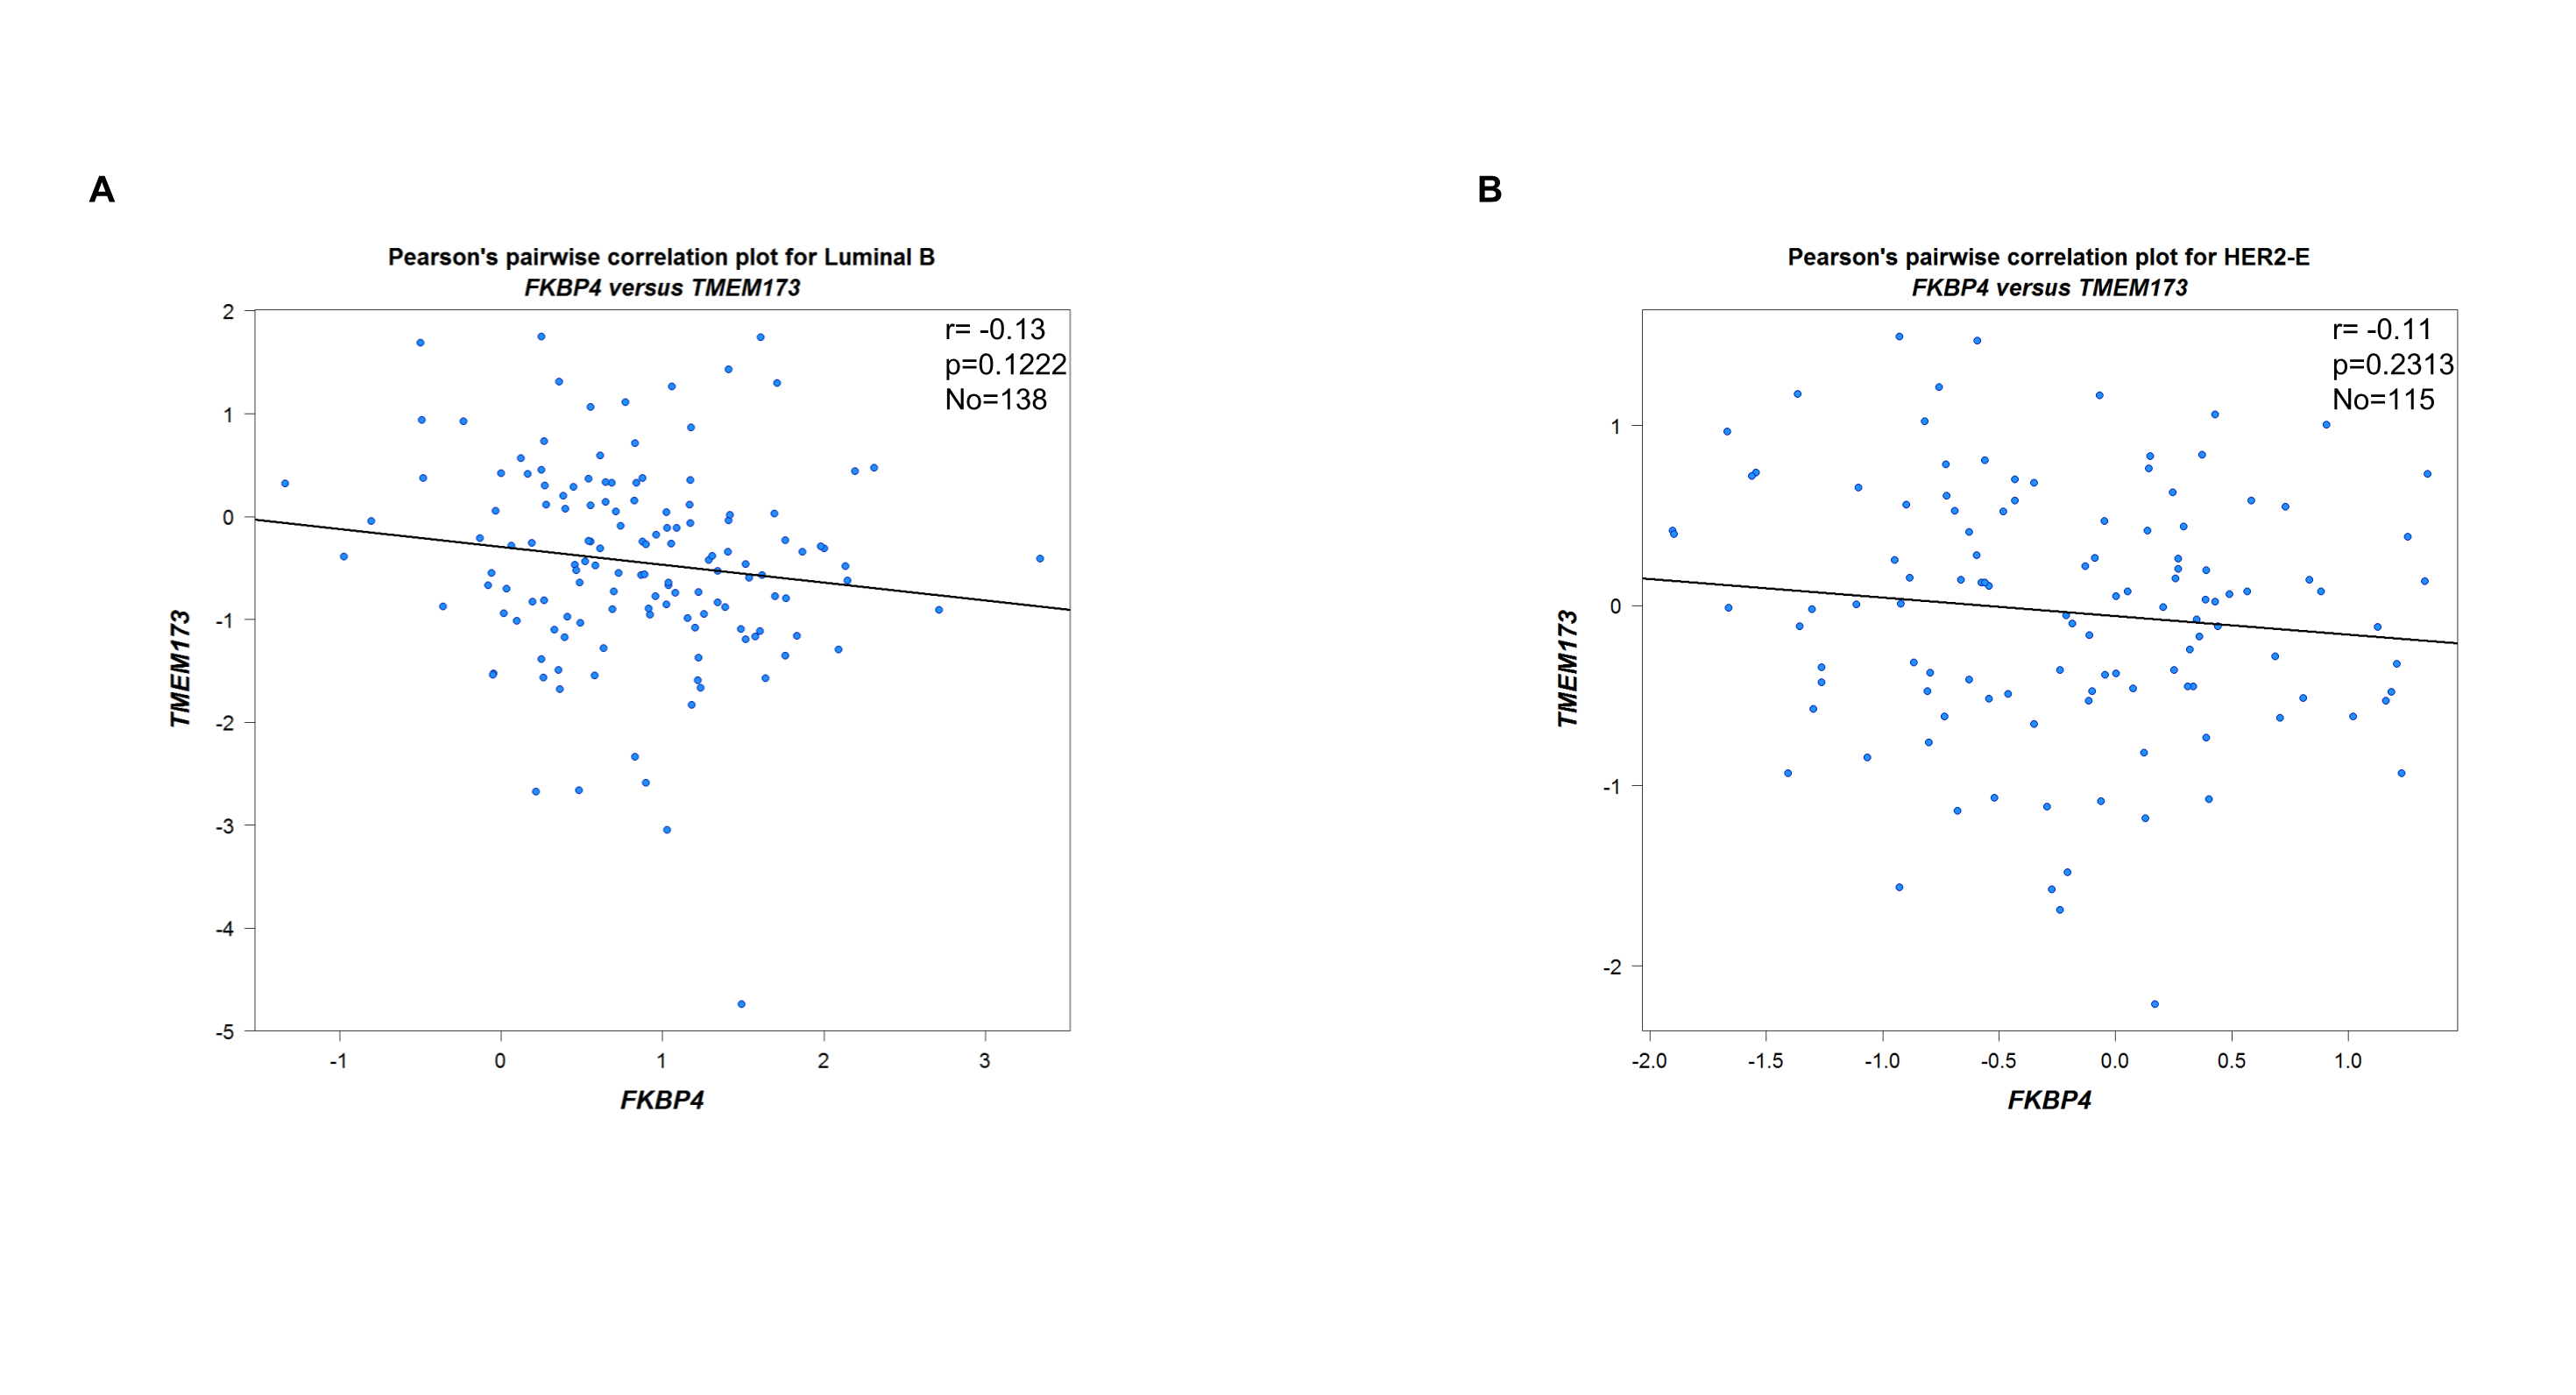
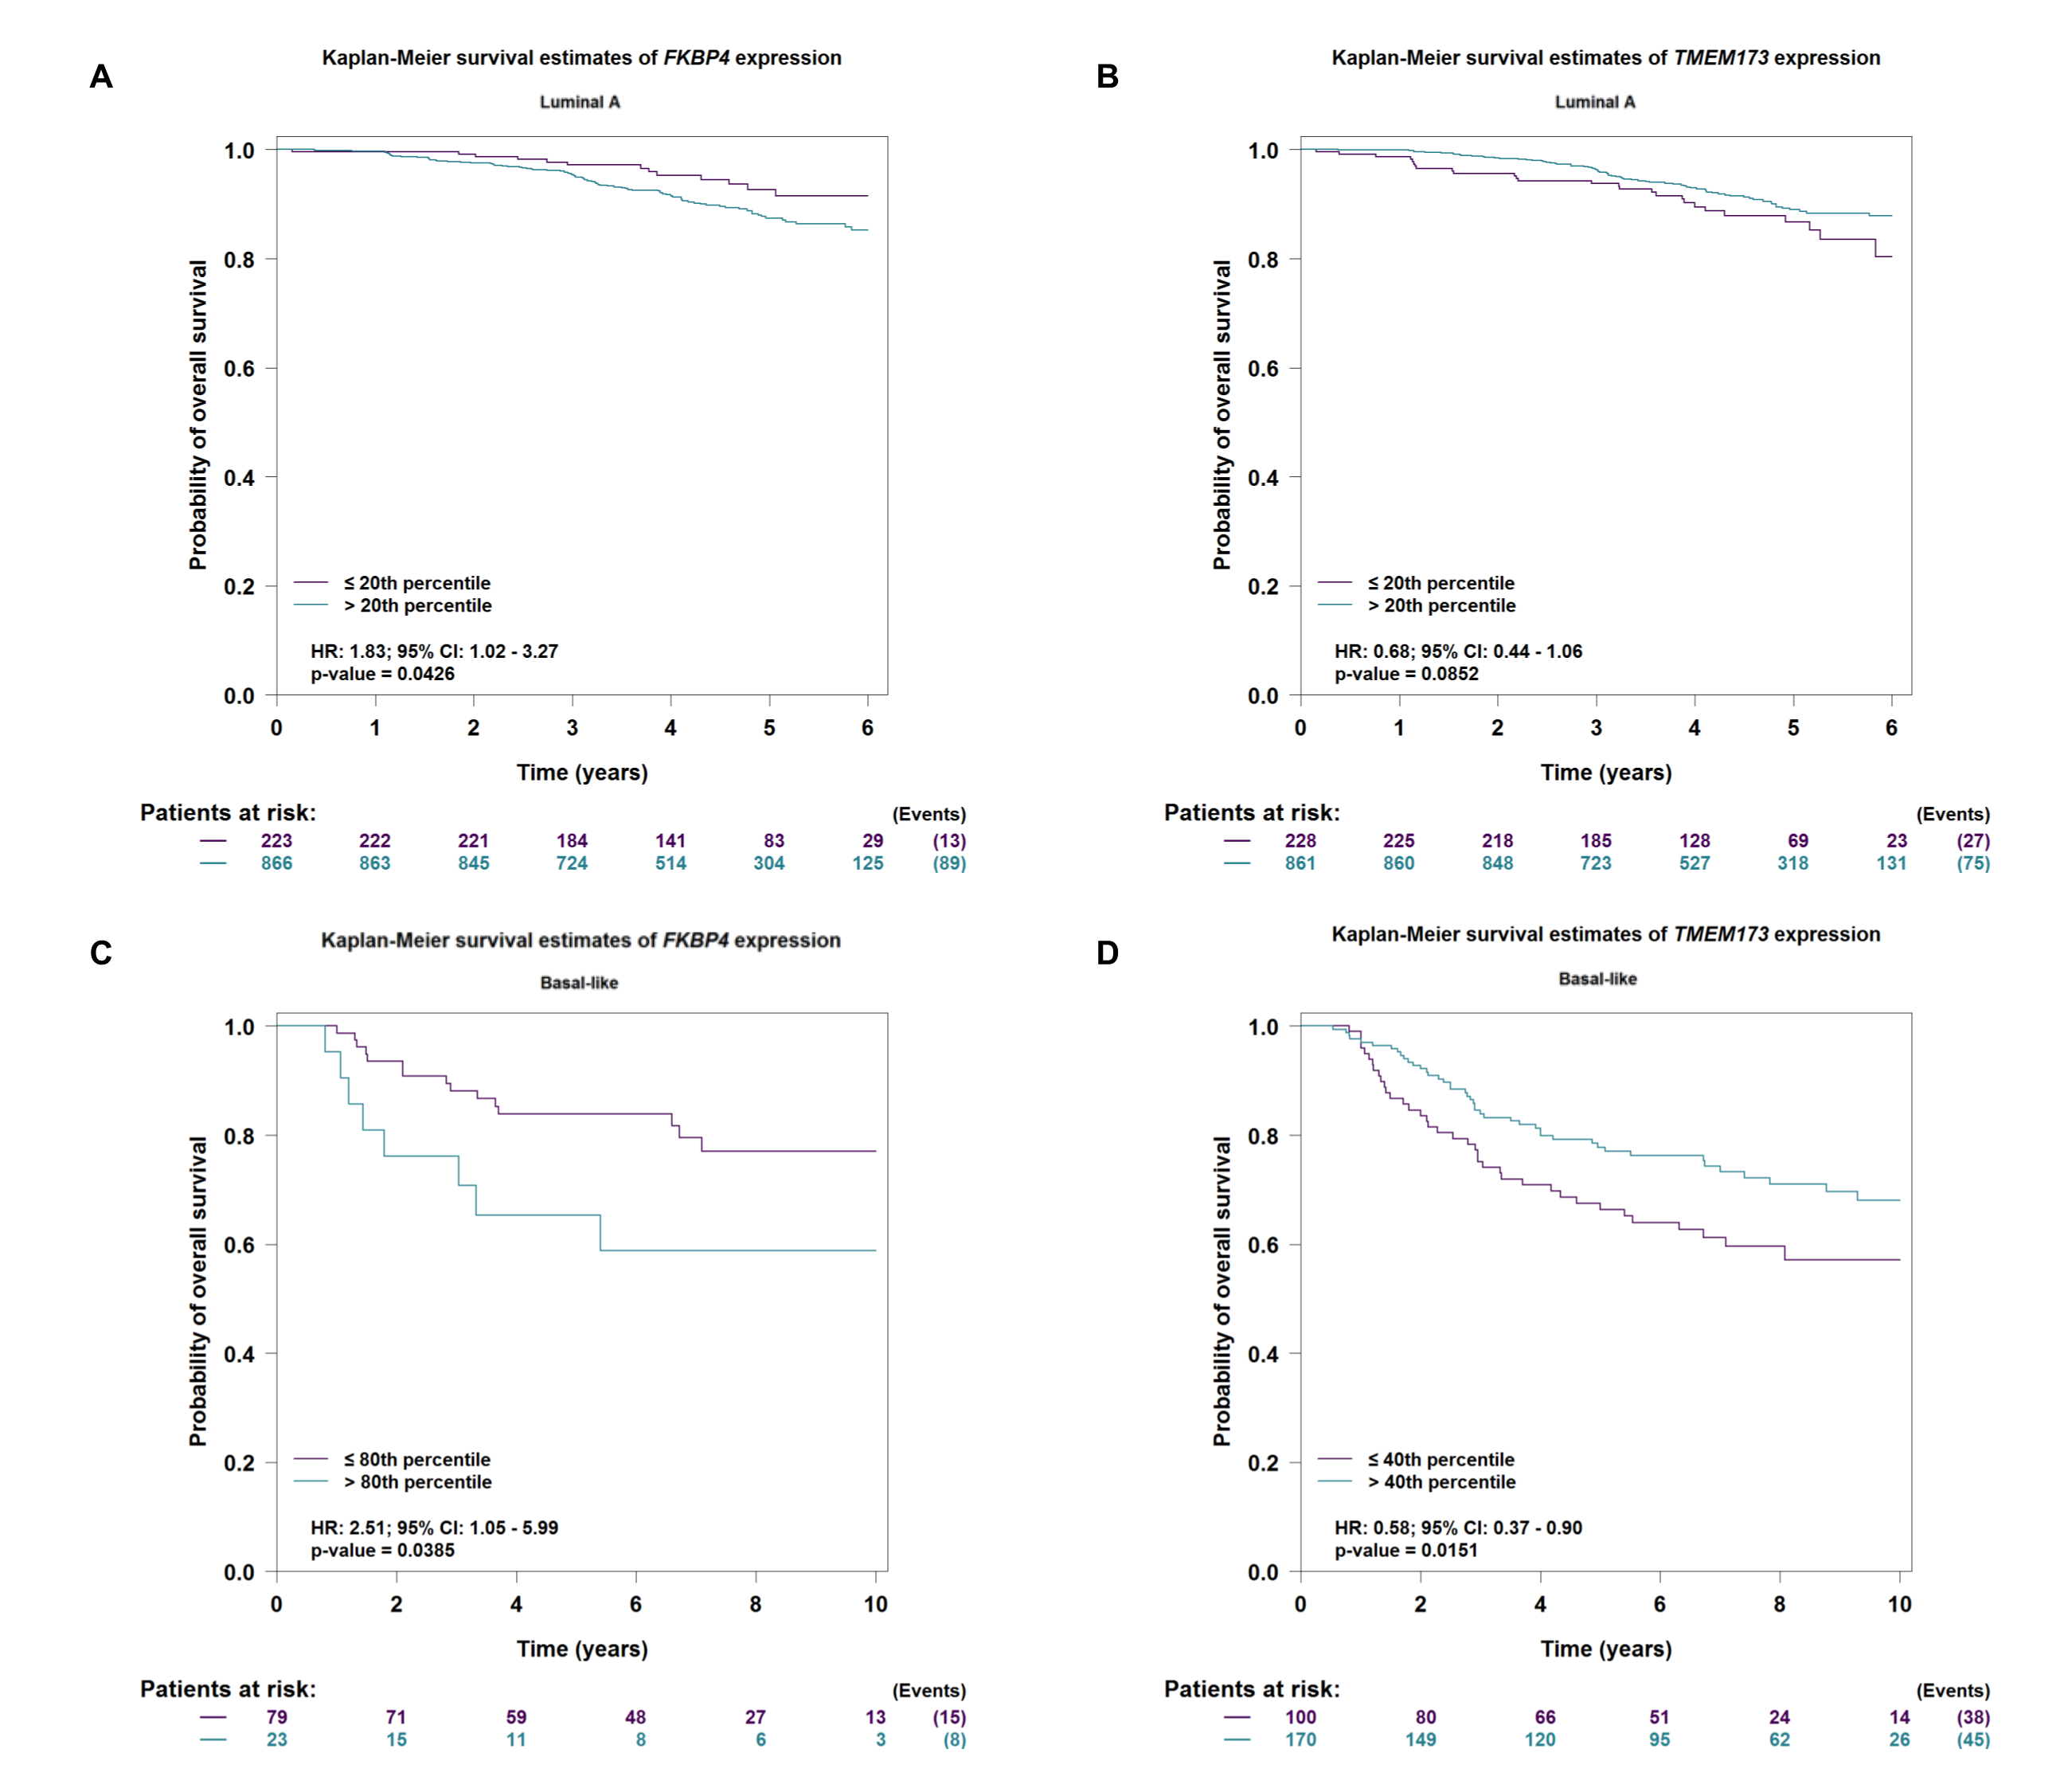
Firstly, we used bc-GenExMiner v4.4[36], an online public tool focused on BC, to explore the clinicopathological characteristics of FKBP4 and TMEM173. Upregulated FKBP4 was found significantly related to luminal A, luminal B and basal-like subtype of BC patients than the normal group (Figure 1A), and downregulated TMEM173 was significantly related to luminal A, luminal B and basal-like subtype patients than the normal group (Figure 1B). Furthermore, we validated a significant negative association between FKBP4 and TMEM173 both in luminal A and basal-like subtype of BC patients (Figure 1C, D), but not in luminal B and HER2-positive subtype of BC patients (Figure S1). Then, the prognostic merits of FKBP4 and TMEM173 in luminal A and basal-like subtype of BC patients were further analyzed by using bc-GenExMiner v4.4, the Kaplan-Meier curve showed that increased levels of FKBP4 and decreased levels of TMEM173 were strongly correlated with worse overall survival both in luminal A and basal-like subtype of BC patients (Figure S2).
We also tested five BC cell lines (MCF7, T47D, BT549, BT474 and SKBR3) as well as normal breast cell line (MCF10A) for expression levels of FKBP4 and TMEM173. As shown in Figure 1E, expression of FKBP4 and TMEM173 were negatively correlated in BC cell lines, especially in T47D (representing luminal A subtype of BC) and BT549 (representing basal-like subtype of BC) cell lines. Since naringenin has been reported involved in immunity regulation[37], we wondered its effect of pharmacologically modulating TMEM173 expression. As shown in Figure 1F, naringenin significantly decreased FKBP4 expression and increased TMEM173 expression in T47D and BT549 cells.
3.2 FKBP4 negatively regulates TMEM173 at protein, mRNA and transcription level
To confirm the specific interaction between FKBP4 and TMEM173 at the molecular level, we firstly used siRNA specifically targeting FKBP4 in T47D and BT549 cells, which led to upregulation of TMEM173 at protein level (Figure 1G). In addition, we transfected FKBP4-HA plasmid in T47D and BT549 cells, which resulted in downregulation of endogenous TMEM173 (Figure 1H). These results clearly indicated that FKBP4 had a role in negatively regulating TMEM173 protein expression. We also found silencing of FKBP4 led to upregulation of TMEM173 at mRNA level in T47D and BT549 cells (Figure 1I). Whereas overexpressed FKBP4 resulted in downregulation of TMEM173 at mRNA level in T47D and BT549 cells (Figure 1J).
To further determine the effect of FKBP4 on TMEM173 transcriptional repression, we constructed TMEM173 promoter luciferase reporter plasmid. As shown in Figure 1K, L, siRNA specifically targeting FKBP4 enhanced TMEM173 promoter activity in T47D and BT549 cells, and FKBP4-HA plasmid inhibited TMEM173 promoter activity in T47D and BT549 cells, therefore FKBP4 was firstly found to have an impact on regulating TMEM173 promoter.
3.3 Negative correlation of FKBP4 and NR3C1 in breast cancer
We then continued to figure out potential factors involved in the FKBP4/TMEM173 axis. Firstly, we used PROMO[38, 39], a virtual laboratory for the identification of putative transcription factors (TFs) binding sites in DNA sequences, to find predicted TFs binding to TMEM173 promoter. After inputting TMEM173 promoter sequence including 1000 bases upstream and 150 bases downstream in PROMO (Table 1), 15 TFs were shown in order of frequency: CEBPB, YY1, ERAL1, NR3C1, TBP, IRF2, FOXA1, FOXP3, STAT4, XBP1, RXRA, PAX5, TP53, GTF2I, GCFC2 (Figure 2A). Besides FKBP4 was shown to connect to NR3C1 with a higher score than FOXA1 in protein to protein interacting network (PPI) on STRING database[40] (Figure 2B) (Table 2), we wondered whether NR3C1 was involved in FKBP4 associated TMEM173 dysregulation.
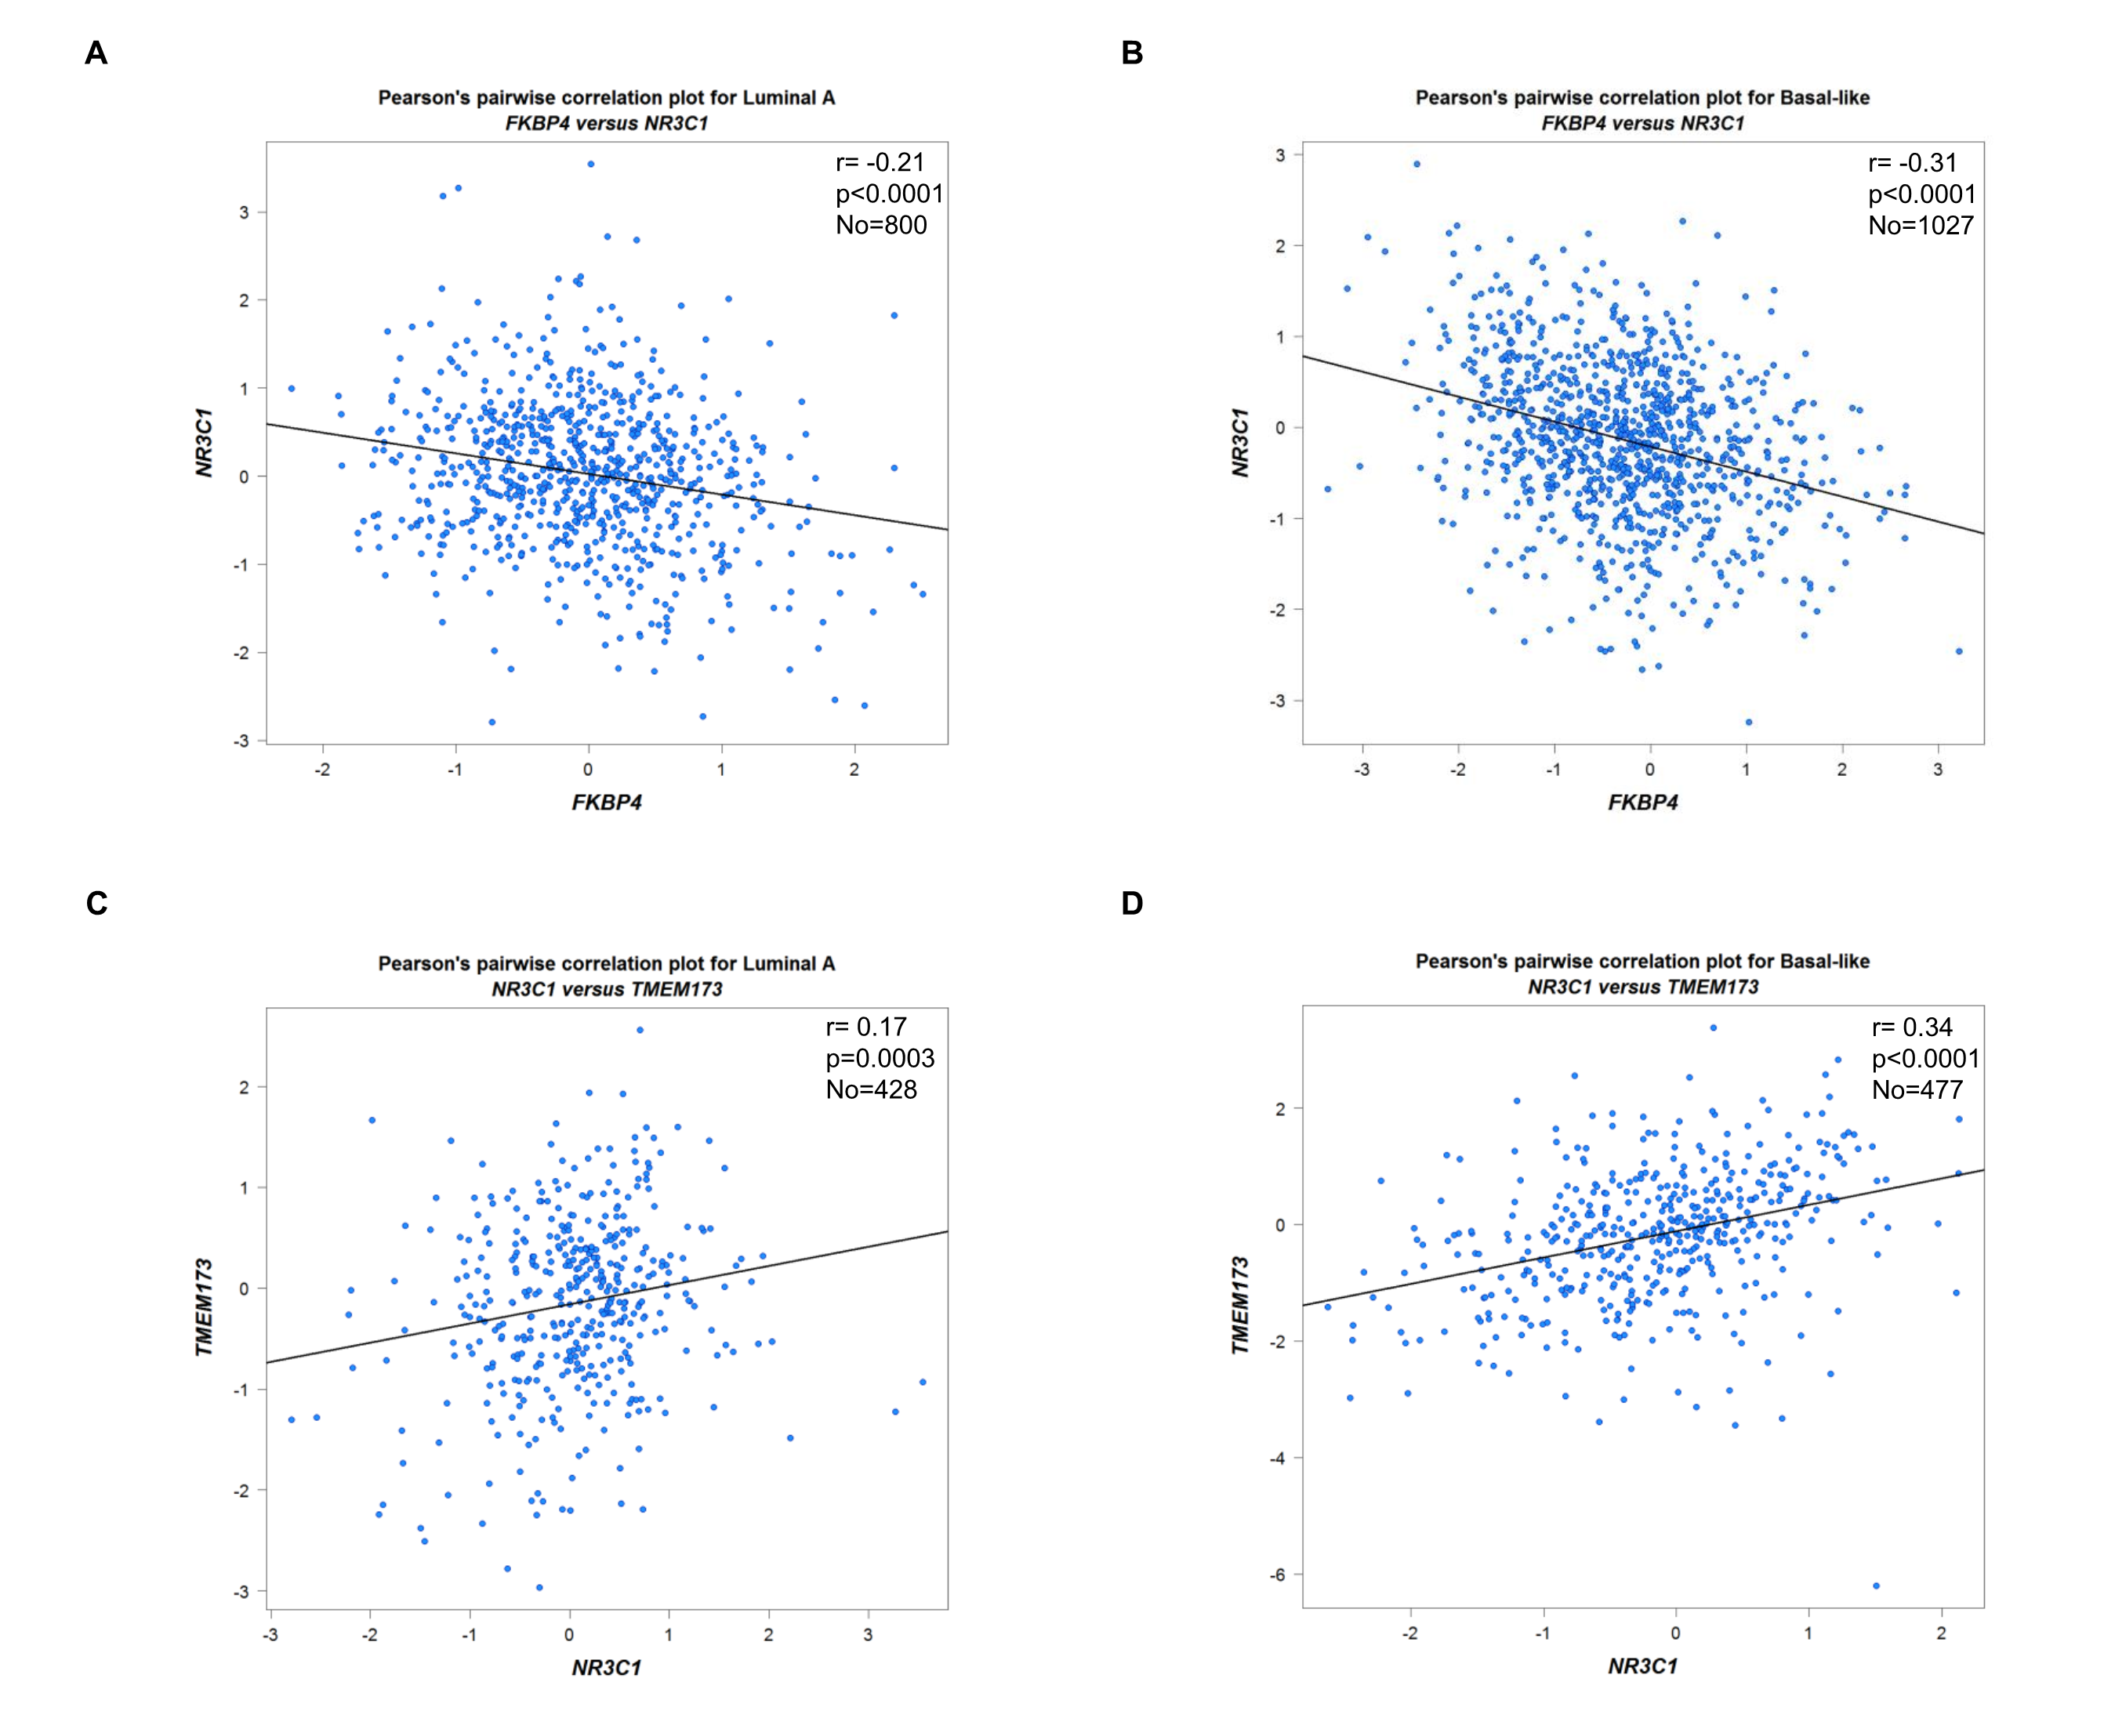
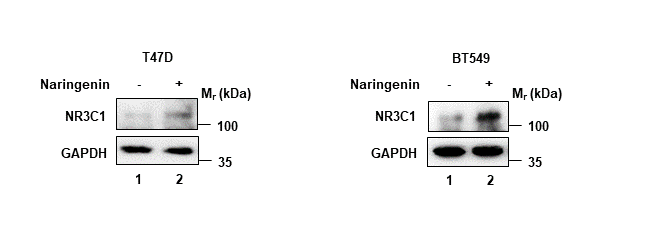
We firstly used siRNA specifically targeting FKBP4 in T47D and BT549 cells, and found it led to upregulation of NR3C1 at protein level (Figure 2C). In addition, we transfected FKBP4-HA plasmid in T47D and BT549 cells, which resulted in downregulation of endogenous NR3C1 (Figure 2D). These results clearly indicated that FKBP4 had a role in negatively regulating NR3C1 protein expression. Bioinformatics results also suggested a significant negative association between FKBP4 and NR3C1 both in luminal A and basal-like subtype of BC patients (Figure S3A, B). Furthermore, we found naringenin could upregulate NR3C1 protein expression in T47D and BT549 cells (Figure S4).
3.4 NR3C1 positively regulates TMEM173 at protein, mRNA and transcription level
We further confirmed the specific interaction between NR3C1 and TMEM173 at the molecular level. We firstly used siRNA specifically targeting NR3C1 in T47D and BT549 cells, which led to downregulation of TMEM173 at protein level (Figure 2E). In addition, we transfected NR3C1-HA plasmid in T47D and BT549 cells, which resulted in upregulation of endogenous TMEM173 (Figure 2F). These results clearly indicated that NR3C1 had a role in positively regulating TMEM173 protein expression. Given NR3C1 was demonstrated to regulate TMEM173 at protein level, we wondered whether it affected the mRNA level of TMEM173. We then found silencing of NR3C1 led to downregulation of TMEM173 at mRNA level in T47D and BT549 cells (Figure 2G). Whereas overexpressed NR3C1 resulted in upregulation of TMEM173 at mRNA level in T47D and BT549 cells (Figure 2H).
At the transcriptional level, siRNA specifically targeting NR3C1 was found to decrease TMEM173 promoter activity in T47D and BT549 cells, while NR3C1-HA plasmid promoted TMEM173 promoter activity in T47D and BT549 cells (Figure 2I, J), therefore NR3C1 was found to have a positive impact on regulating TMEM173 promoter.
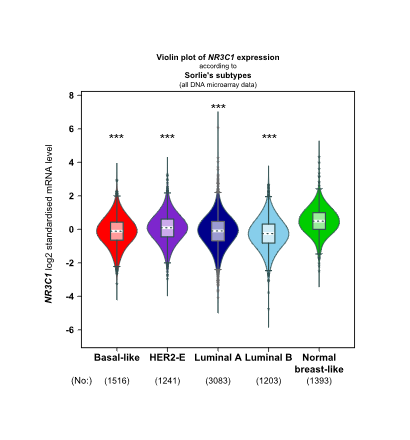
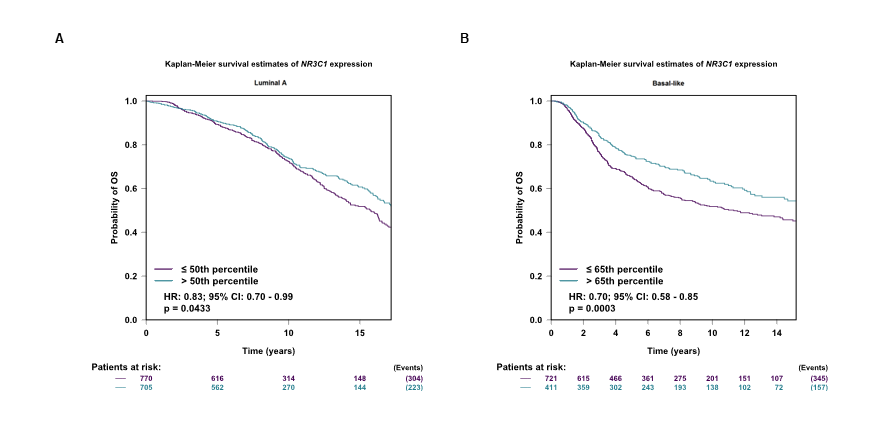
Meanwhile, we verified a significant positive association between NR3C1 and TMEM173 both in luminal A and basal-like subtype of BC patients (Figure S3C, D). Downregulated NR3C1 was significantly related to four molecular subtype patients than the normal group (Figure S5), also strongly correlated with worse overall survival both in luminal A and basal-like subtype of BC patients (Figure S6).
Besides, knockdown of NR3C1 partially prevented siRNA targeting FKBP4 to upregulate TMEM173 expression at protein, mRNA and transcription level in BT549 and T47D cells (Figure 2K, L, M). Hence, our results implied that FKBP4 might downregulate TMEM173 by inhibiting NR3C1.
3.5 FKBP4 binds to NR3C1 and regulates nuclear translocation of NR3C1
As FKBP4 regulates its cellular targets via protein–protein interaction[41, 42], we tested whether FKBP4 bound to NR3C1. We performed co-IP and western blot assays using BT549 and T47D cells, and results showed that FKBP4 and NR3C1 bound with each other (Figure 3A, B). We further observed that nuclear accumulations of NR3C1 were enhanced by siRNA targeting FKBP4 or inhibited by FKBP4-HA plasmid in BT549 and T47D cells by western blot analysis (Figure 3C, D). Silencing FKBP4 mediated promotion of NR3C1 nuclear accumulations were also observed in BT549 and T47D cells by immunofluorescence microscopy (Figure 3E, F).
These observations were consistent with the finding that FKBP4 transcriptionally inhibited TMEM173 through interacting with NR3C1.
3.6 FKBP4/NR3C1/TMEM173 signaling pathway involved in naringenin-induced autophagy
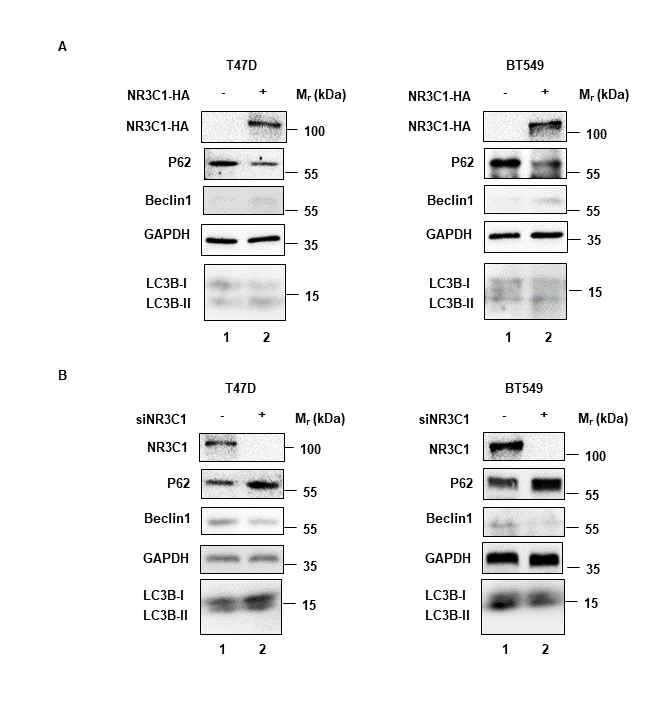
Since naringenin had been used to enhance autophagy[43], we doubted whether naringenin related FKBP4/NR3C1/TMEM173 axis was also involved in autophagy. Western blotting showed that silencing FKBP4 decreased the expression of autophagy associated molecule P62 and increased the expression of Beclin‑1 and LC3B‑II/LC3B-I in T47D and BT549 cells (Figure 4A). Similarly, TMEM173 overexpression in T47D and BT549 cells led to the downregulation of P62 and upregulation of Beclin‑1 and LC3B‑II/LC3B-I (Figure 4B). Meanwhile, western blotting showed that FKBP4 overexpression increased the expression of P62 and decreased the expression of Beclin‑1 and LC3B‑II/LC3B-I in T47D and BT549 cells (Figure 4C), and silencing TMEM173 led to the upregulation of P62 and downregulation of Beclin‑1 and LC3B‑II/LC3B-I (Figure 4D). As shown in Figure S7, NR3C1 had the same effects as TMEM173 on P62, Beclin‑1 and LC3B‑II/LC3B-I. Autophagy flux was also observed decreased in T47D and BT549 cells silencing TMEM173 (Figure 4G, H). Furthermore, knockdown of TMEM173 significantly prevented naringenin-induced promotion of T47D and BT549 cell autophagy (Figure 4E, F).
All together, these results suggested that naringenin enhanced BC cell autophagy partially owing to FKBP4/NR3C1/TMEM173 axis.
3.7 FKBP4/NR3C1/TMEM173 signaling pathway involved in naringenin-restrained cell proliferation
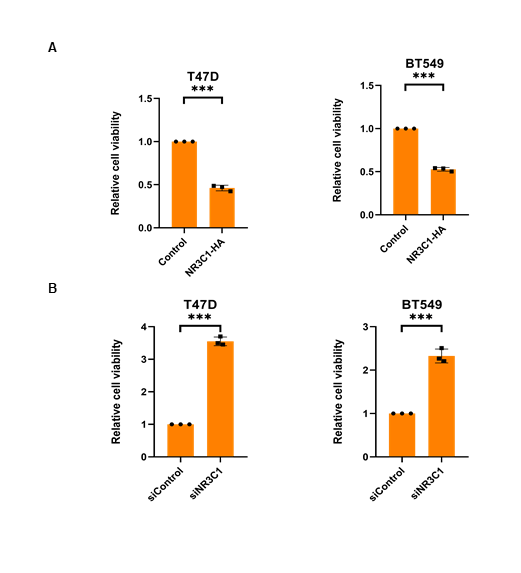
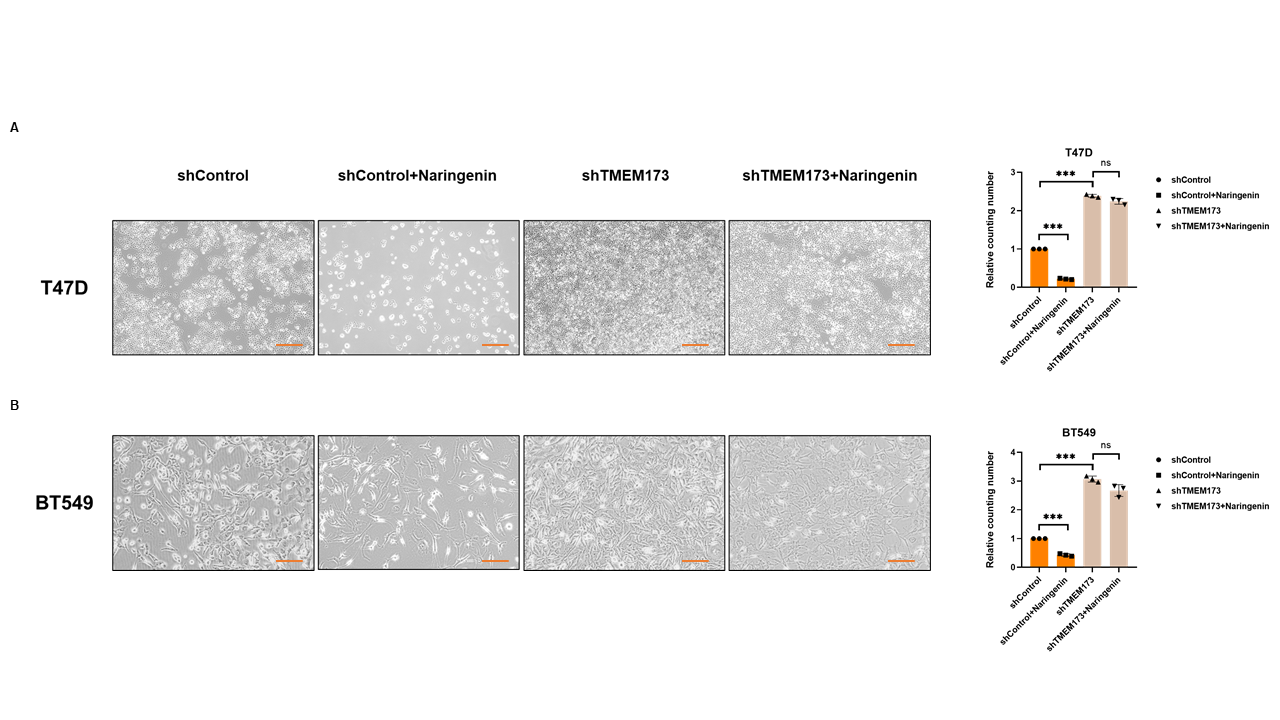
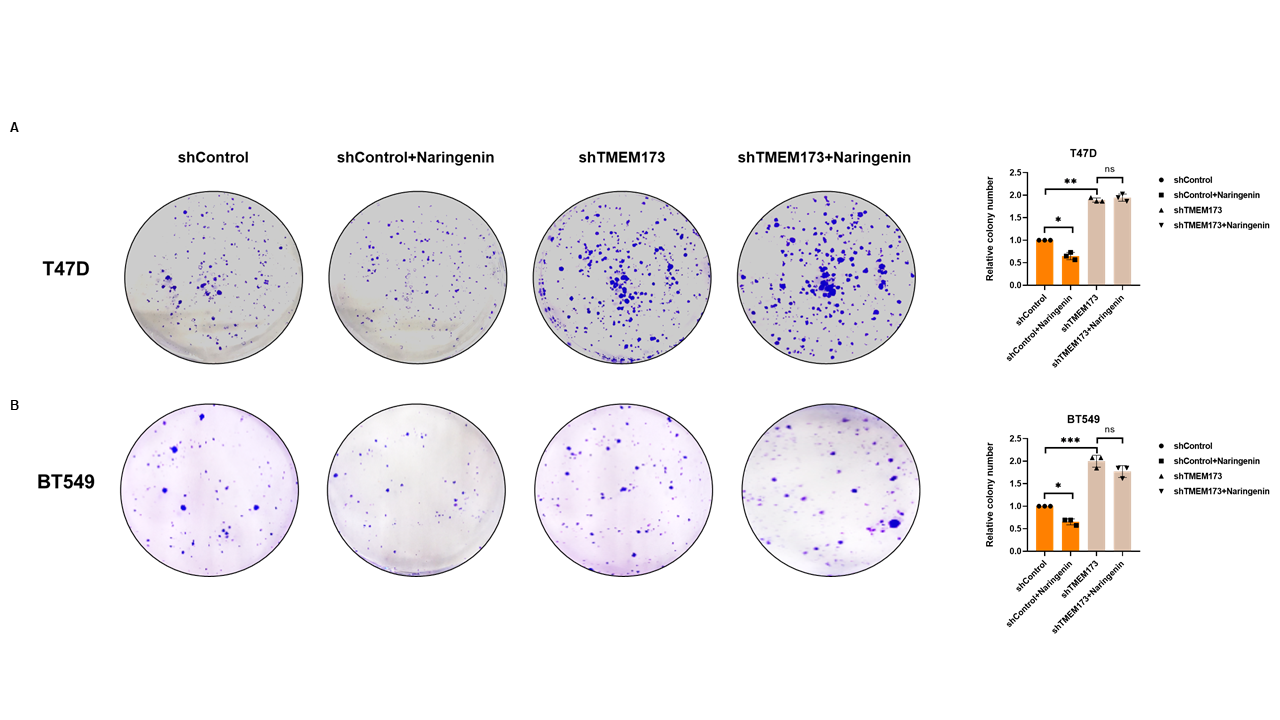
Naringenin was well-known to inhibit cell proliferation[44], we doubted whether naringenin related FKBP4/NR3C1/TMEM173 axis was also involved in cell proliferation. Cell viability assay showed that silencing FKBP4 or overexpressing TMEM173 prevented cell proliferation of both T47D and BT549 cells at 72 h (Figure 5A, B), while overexpressing FKBP4 or silencing TMEM173 promoted cell proliferation of both T47D and BT549 cells at 72 h (Figure 5C, D). Similarly, we observed that silencing NR3C1 promoted cell proliferation and overexpressing NR3C1 prevented cell proliferation of both T47D and BT549 cells at 72 h (Figure S8). Additionally, knockdown of TMEM173 significantly prevented naringenin-restrained cell proliferation of T47D and BT549 cells during 72 h (Figure 5E, F), these findings were further confirmed by cell photography (Figure S9) and colony formation assay (Figure S10).
T47D cells treated with silenced TMEM173 were used to generate subcutaneous xenograft models in nude mice. Results showed that the volume and weight of tumors were significantly reduced in the naringenin treated group than in the control group, whereas those in the naringenin+shTMEM173 group were significantly greater than in the naringenin treated group (Figure 5G, H, I). Immunohistochemical analysis showed that the staining intensity of FKBP4 was significantly lower in subcutaneous tumors in the naringenin treated group, and the expression of TMEM173 was higher than that in the control group (Figure 5J).
Thus, in vivo and in vitro experiments indicated that naringenin inhibited BC proliferation partially owing to its function of increasing TMEM173 expression.
3.8 Exosomes secreted by naringenin treated breast cancer cells induced DC maturation
Exosomes secreted by BC cells had been reported as cell-to-cell mediators of oncogenic or anti-cancer information[45], and further regulated DC maturation[32], we wondered whether naringenin was also involved in exosome secretion among tumor environment. After 72 h naringenin treatment, exosomes were isolated from the supernatants of BC cells using a two-step procedure to achieve a high purity and their morphology verified by Nanoparticle tracking analysis (Figure 6A). Next, purified exosomes derived from T47D and BT549 were further authenticated by the expression of exosome biomarkers (Alix, TSG101, CD81 and CD63) (Figure 6B). The results of Nanoparticle tracking analysis showed that the isolated exosomes had an average size of 100 nm (Figure 6C). Exosomes secreted by various cancer cells had been found to carry RNA and proteins, both western blot assays and RT-qPCR showed that the expression levels of NR3C1 and TMEM173 were higher in naringenin treated T47D exosomes (T47D-ex) and BT549 exosomes (BT549-ex) than in the control group, whereas FKBP4 had the opposite expression (Figure 6D, E).
We next tested the effect of exosomes secreted by naringenin treated BC cells on DC maturation. To this end, primary CD11c+ DCs were isolated from the bone marrow of mice and cultured with exosomes for 72 h. DCs cultured with naringenin treated T47D-ex and BT549-ex showed significantly increased cell surface expression of co-stimulatory molecules CD40, CD80 and CD86 (Figure 6F). We also observed the levels of IL-6, IL-12, TNF-α, IL-18, IL-1β and MCP-1, which reflected the maturation of DCs, were significantly upregulated by T47D-ex and BT549-ex treated with naringenin in the culture supernatant compared with those in the control group (Figure 6G-L). Thus, T47D-ex and BT549-ex exhibited adjuvant properties of promoting DC maturation.
3.9 FKBP4/NR3C1/TMEM173 signaling pathway involved in naringenin-induced TIDC maturation
To confirm FKBP4/NR3C1/TMEM173 axis was also regulated in DC, we co-cultured BC cells and bone marrow cells of mice with GMCSF+IL4 or naringenin, simulated as TIDC (Figure 7A). After GMCSF+IL4 treatment for 72 h, we found that FKBP4 was gradually decreased while NR3C1 and TMEM173 were gradually increased during TIDC differentiation and maturation at both protein and mRNA level (Figure 7B, C). After naringenin treatment for 72 h, we found that FKBP4 was gradually decreased while NR3C1 and TMEM173 were gradually increased according to naringenin concentration at both protein and mRNA level (Figure 7D, E). Flow cytometry analysis results showed that the positive expression percentages of CD11C and CD86 of TIDC were significantly increased in the naringenin group in contrast to those in the control group (Figure 7F). To demonstrate that TMEM173 truly affected the maturation and function of TIDC, we observed the levels of IL-6, IL-12, TNF-α, IL-18, IL-1β and MCP-1 were significantly upregulated by naringenin stimulation in the TIDC culture supernatant compared with those in the control group, opposite results were observed in the groups receiving anti-TMEM173 stimulation (Figure 7G-L). These data suggested that FKBP4/NR3C1/TMEM173 signaling pathway involved in naringenin-induced TIDC maturation.
Taken together, we demonstrated that naringenin mediated pro-autophagy, anti-proliferation of BC cells and pro-TIDC maturation in a new-found FKBP4/NR3C1/TMEM173 dependent way (Figure 8).