Cell lines
All cells were from Cell bank of Chinese Academy of Sciences. HEK 293T (SCSP-502) cells are grown in Dulbecco’s Modified Eagle’s Medium (DMEM; Gibco, 11965118) containing 10% fetal calf serum (FBS; Fetal Bovine Serum) supplemented with penicillin (Sangon Biotech, A603460, 100 U/ mL) and streptomycin (Sangon Biotech A100382, 100 μg/ mL). A549 cells are cultured in 10%FBS-F12K medium (Sigma-Aldrich, N3520) supplemented with penicillin (Sangon Biotech, A603460, 100 U/ mL) and streptomycin (Sangon Biotech A100382, 100 μg/ mL). H1299 cells (SCSP-589) are grown in 10%FBS- RPMI 1640 Medium (Gibco, 11875093) with penicillin (Sangon Biotech, A603460, 100 U/ mL) and streptomycin (Sangon Biotech A100382, 100 μg/ mL). Cells were cultured in 37℃ incubator (Thermo Scientific, BB150) with a humidified atmosphere containing 5% CO2.
Generation of SETD1A silenced cell line
HEK 293T cells were co-transfected with pLKO.1-puro cloning vector (addgene, #8453) encoding SETD1A-specific shRNA (GenScript, shSETD1A-1: CCGGCGGAAGAAGAAGCTCCGATTTCTCGAGAAATCGGAGCTTCTTCTTCCGTTTTTTG, shSETD1A-2: CCGGCTTTGCGGAGAAGAAGCTGTACTCGAGTACAGCTTCTTCTCCGCAAAGTTTTTTG), Gal-pol and the pCMV-VSV-G vector (Addgene, #8454) using polyethylenimine (PEI). 48h later, the supernatant of medium was filtered by 0.45 μm filter, mixed with polybrene (10 μg/ mL) and infected A549/ H1299 cells. 48h later, selected cells with 1 μg/ mL puromycin (Gibco, A1113803) and survival cells were harvested after 3 days.
Western blot
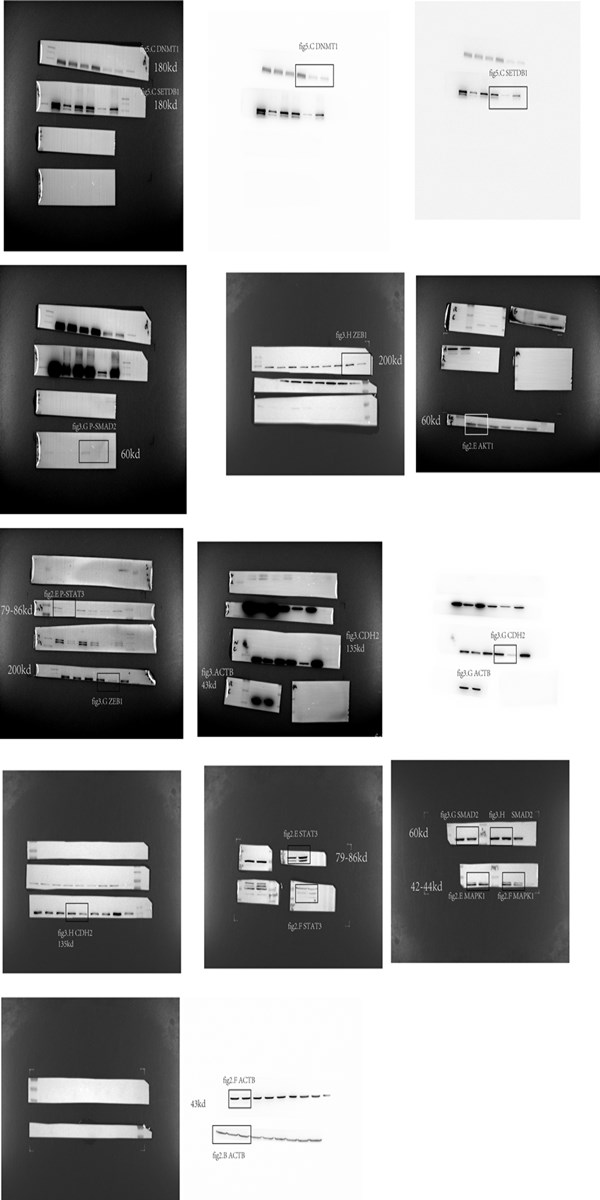
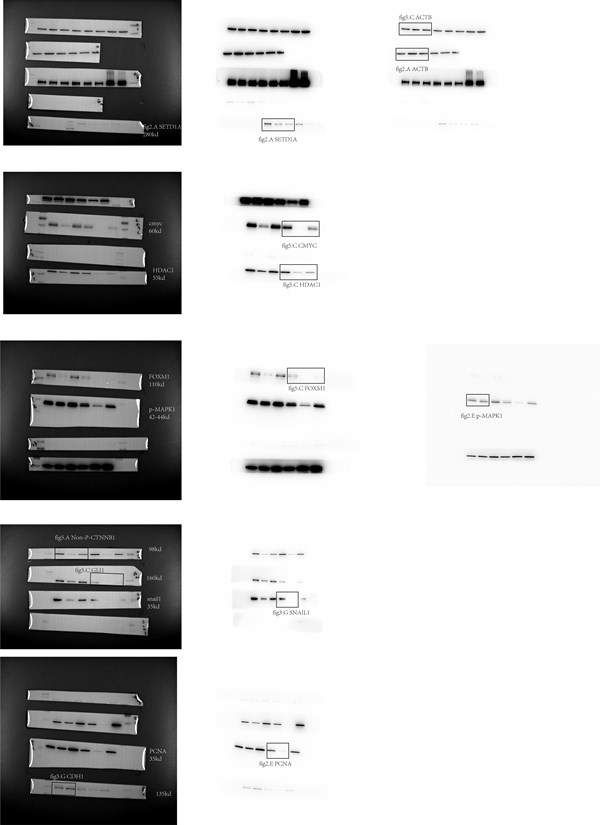
Cells were washed by PBS saline and lysed with RIPA buffer (150 mM NaCl, 2 mM EDTA (pH 8.0), 50 mM Tris-HCl (pH 7.4), 0.1% SDS, 1% Nonidet P-40, 1 mM Na3VO4, 50 mM NaF and protease inhibitor cocktail (Roche, 05892791001)). Protein concentration was measured by BCA Protein Assay Kit (Pierce, 23227) and ~20 μg protein amount for each well of gel. Protein was separated by 10%SDS-PAGE gel (GenScript, M00664) and electrotransferred to PVDF membrane (Millipore, IPVH00005). Next, the membrane was blocked by blocking buffer with 5% non-fat milk in TBS and 0.1% Tween 20 (Sangon Biotech, A100777) for 1h, and incubated overnight at 4℃ with primary antibody diluted in TBS and 0.1% Tween 20. Second day, the membrane was incubated for 1h at room temperature with secondary antibody diluted in blocking buffer (1:1000), combined with substrate (Tanon, #180-5001) and exposed with digital imager (Tanon 4600). Image J software was used for immunoblot densitometric analysis. The primary antibodies were β-Actin (Cell Signaling Technology, #3700. 1:10,000), SET1A(Cell Signaling Technology , #61702. 1:1,000), SNAIL (Cell Signaling Technology, #3879. 1:1,000), p-SMAD2 (Cell Signaling Technology, #18338. 1:1,000, phosphorylated at Ser465/467), SMAD2 (Cell Signaling Technology, #5339. 1:1,000), HDAC1 (Cell Signaling Technology, #5356. 1:2,000), DNMT1 (Cell Signaling Technology, #5032. 1:2,000), FOXM1 (Cell Signaling Technology, #5436. 1:2,000), p-STAT3 (Cell Signaling Technology, #9145. 1:1,000, phosphorylated at Tyr405), STAT3 (Cell Signaling Technology, #9139. 1:2,000), PCNA (Cell Signaling Technology, #13110. 1:3,000), AKT1 (Cell Signaling Technology, #75692. 1:2,000), p-ERK1/2 (Cell Signaling Technology, #4370. 1:3,000, phosphorylated at Thr202/Tyr204), E-Cadherin (Cell Signaling Technology, #3195. 1:1,000), N-Cadherin (Cell Signaling Technology, #13116.1:1,000), ZEB1 (Cell Signaling Technology, #3396. 1:1,000), GLI1 (Cell Signaling Technology, #3538. 1:1,000), c-Myc (Cell Signaling Technology, #5605. 1:3,000), and SETDB1 (Cell Signaling Technology, #2196. 1:1,000). Secondary antibodies conjugated with horseradish peroxidase (HRP) were from Thermo Fisher (31460 and 31430).
Cell proliferation assay
Cells were seeded at a density of 1×10⁵ cells in one 10 cm dish. The number of viable cells was counted every other day.
Wound healing analysis
The same number of A549 or H1299 cells was seeded in a 6 cm dish to ensure >90% density the next day. Then, cells were wounded with a sterile pipette tip, and new culture medium was added. The images of wound healing were randomly captured at the indicated time points (24 h and 48 h). The speed of wound healing was quantified by the wound width. Lecia DM2500 microscope (5×) and Image J software was used to analyzed wound width.
Migration and invasion assay
A Transwell chamber with a porous membrane (Corning, catalog no. 3422) was placed in a 24-well plate. Then, the same number (1×10⁵) of A549 or H1299 cells in 200 µl of serum-free culture medium was added to the upper chamber, and the lower chamber contained 500 µl of growth medium containing 10% FBS. After 12 h, nonmigrated cells on the top of the porous membrane were removed by a cotton swab, and the migrated A549 or H1299 cells on the bottom surface were fixed (4% paraformaldehyde) and stained with 0.5% crystal violet. The cells that passed though the membrane were visualized by the size of the colored area. Each experiment was repeated 3 times.
For the invasion assay, the Matrigel (Corning, catalog no. 354234) was diluted (1:8) with PBS and poured into chambers above which were placed in 24-well plates. Then, 1×10⁶ cells were placed on the Matrigel, and the lower chamber contained 500 µl of growth medium containing 10% FBS. The cells were cultured at 37℃. Then, 24 h later, the cells that passed through the Matrigel and porous membrane were visualized with the same protocol as in the migration assay. Each experiment was repeated 3 times. OLYMPUS SZX10 microscope (8×) and Image J software was used to analyze cell number.
Mouse xenograft models
Six-week-old male nude mice were purchased from The Laboratory Animal Center (XXXX) and randomly divided into two groups. Then, 5×10⁶ A549 or H1299 cells in 100 μl PBS were injected subcutaneously in the back of each mouse, and the tumor size was calculated as length×width2 /2 at the indicated day. At the end point (A549, 35 days; H1299, 25 days), the tumors were collected for weighing and RNA expression analysis. The mice were housed in SPF condition with 12h daytime and 12h night. All experiments were performed according to the guidelines of the Institutional Animal Care and Use Committee of the Shandong University.
Immunofluorescence
Cells were washed with phosphate buffered saline (PBS) three times and fixed with 4% PFA in PBS for 15 min, then cells were permeabilized with 0.1% Triton X-100 in PBS for 10 min, blocked with 0.2% fish skin gelatin (Sigma-Aldrich, #G7041) in PBS for 30 min at room temperature and incubated with primary antibody diluted in PBS at 4℃overnight. Next day, second antibody diluted in PBS was used to combine primary antibody at room temperature for 1h and the location was detected with ZEISS LMF880 laser scanning confocal microscope. The primary antibodies were SET1A (CST, #61702. 1:400) and H3K4me3 (abcam, #ab1012.1:200). The secondary antibody was Cy3-conjugated anti-rabbit IgG (Sigma-Aldrich, #C2306. 1:1,000). Cell nuclei were counterstained with DAPI.
Bioinformatics analysis
Data of SETD1A DNA copy number in lung cancer is from cBioportal (www.cbioportal.org). Gene expression data from GEO DataSets (https://www.ncbi.nlm.nih.gov/gds/) and the accession number is listed in figure legends. Data of cumulative overall survival of patients with lung carcinoma is from TCGA database. SETD1A expression in different cell line is from previous report12. Enhanced H3K4me3 signaling in cell line of lung cancer was confirmed with ENCODE (https://www.encodeproject.org/), the database collects and verifies CHIP-seq results.
Statistical analysis
Data are presented as the mean ± SD, except for description in figure legends. Number of biological repetition are also stated in figure legends. The difference between unpaired groups was confirmed with two-tailed Welch's t test. Log-rank (Mantel-Cox) test was performed in analysis of survival curves. For comparation of cell number and ratio, log transformation was used for statistical test. The confidence level was 95%. All statistical analysis was performed by GraphPad Prime 7.00 software.