CKI-predicted target network
Basic information on the 16 active ingredients in CKI is shown in Table 1. The active compound-predicted target network (Figure 2) consists of 301 nodes (16 compound points and 285 gene points) that constitute 635 active compound-predicted target linkages.

Screening of differential miRNA in GC
In this study, GSE23739 and TCGA was adopted to analysis the DEMs in GC. |log2FC| ≥ 1, P value < 0.05 and adjust P value < 0.05 were considered statistically significant for the DEMs. For GSE23739, a total of 13 up-regulated gene and 15 down-regulated genes were found. And there are 107 up-regulated genes and 56 down-regulated genes in the TCGA analysis (Figure 3). Overlapping DEMs (hsa-miR-20a, hsa-miR-30a, hsa-miR-21, hsa-miR-145) between the GSE23739 and TCGA analysis were retained for further study. From miRWALK2.0, 9431 mRNA and 31879 ncRNA targeted by DEMs (hsa-miR-20a-3p, hsa-miR-20a-5p, hsa-miR-30a-3p, hsa-miR-30a-5p, hsa-miR-21-3p, hsa-miR-21-5p, hsa-miR-145-3p, hsa-miR-145-5p) in GC predicted by more than half of total algorithms were obtained (Supplemental Table S1 to 2).
Construction and Screening of WGCNA Key Modules
After normalization, no outlier samples were eliminated in present study. In order to build a scale-free network, the power of β = 6 (scale free R2 = 0.85) was selected as the soft-thresholding parameter (Figure 4A and B). A total of 9 modules were identified via the average linkage hierarchical clustering. Clinical traits including vital status, new tumor events, cancer status, pathologic T, pathologic N, pathologic M, stage, H pylori, barretts esophagus were selected to calculate the correlation between the module and the Pearson test. Assessed by the Pearson test when P <0.05, the module and clinical characteristics were considered statistically significant. As shown in Figure 4C, the blue, turquoise and brown modules were highly correlated with clinical traits and were identified as key modules. Figure 4D indicated the topological overlap measurement (TOM) heat map of adjacency or topological overlap. TOM plot was made up by randomly selected 400 genes. Each row and column represented a module and the genes of the module. The TOM of co-expressed RNA in key modules was high, and the internal RNA correlation was also stronger. The network building the key modules was filtered with a weight Cutoff = 0.1 between the genes. The blue module consists of 632 genes and 74485 gene linkages. The turquoise module consists of 1239 genes and 126102 gene linkages and the brown module consists of 232 genes and 11316 gene linkages. (Supplemental Table S3 to 5)
Prediction of ceRNA network of CKI intervention in GC
The intersection of the WGCNA key module network and the hub DEMs prediction target constitutes the ceRNA Network of lncRNA-miRNA-mRNA Axis in GC. Furthermore, the ceRNA network and CKI-predicted target network were merged through Cytoscape to obtain prediction of ceRNA network of CKI intervention in GC (Figure 5A). As is shown in Figure 5B, the prediction of ceRNA network of CKI intervention in GC involved 73 nodes and 203 linkages between genes. The overlapping targets (AKR1B1, TLR4, ESR1, PRKCQ, PIK3CD, CTSK, MMP2, ADRB2, PDE1C, ITGB3, PDE10A, PTGFR, AR and PTGER3) were considered to be the key genes for the CKI treatment of GC.
Go and Kegg pathway enrichment analysis
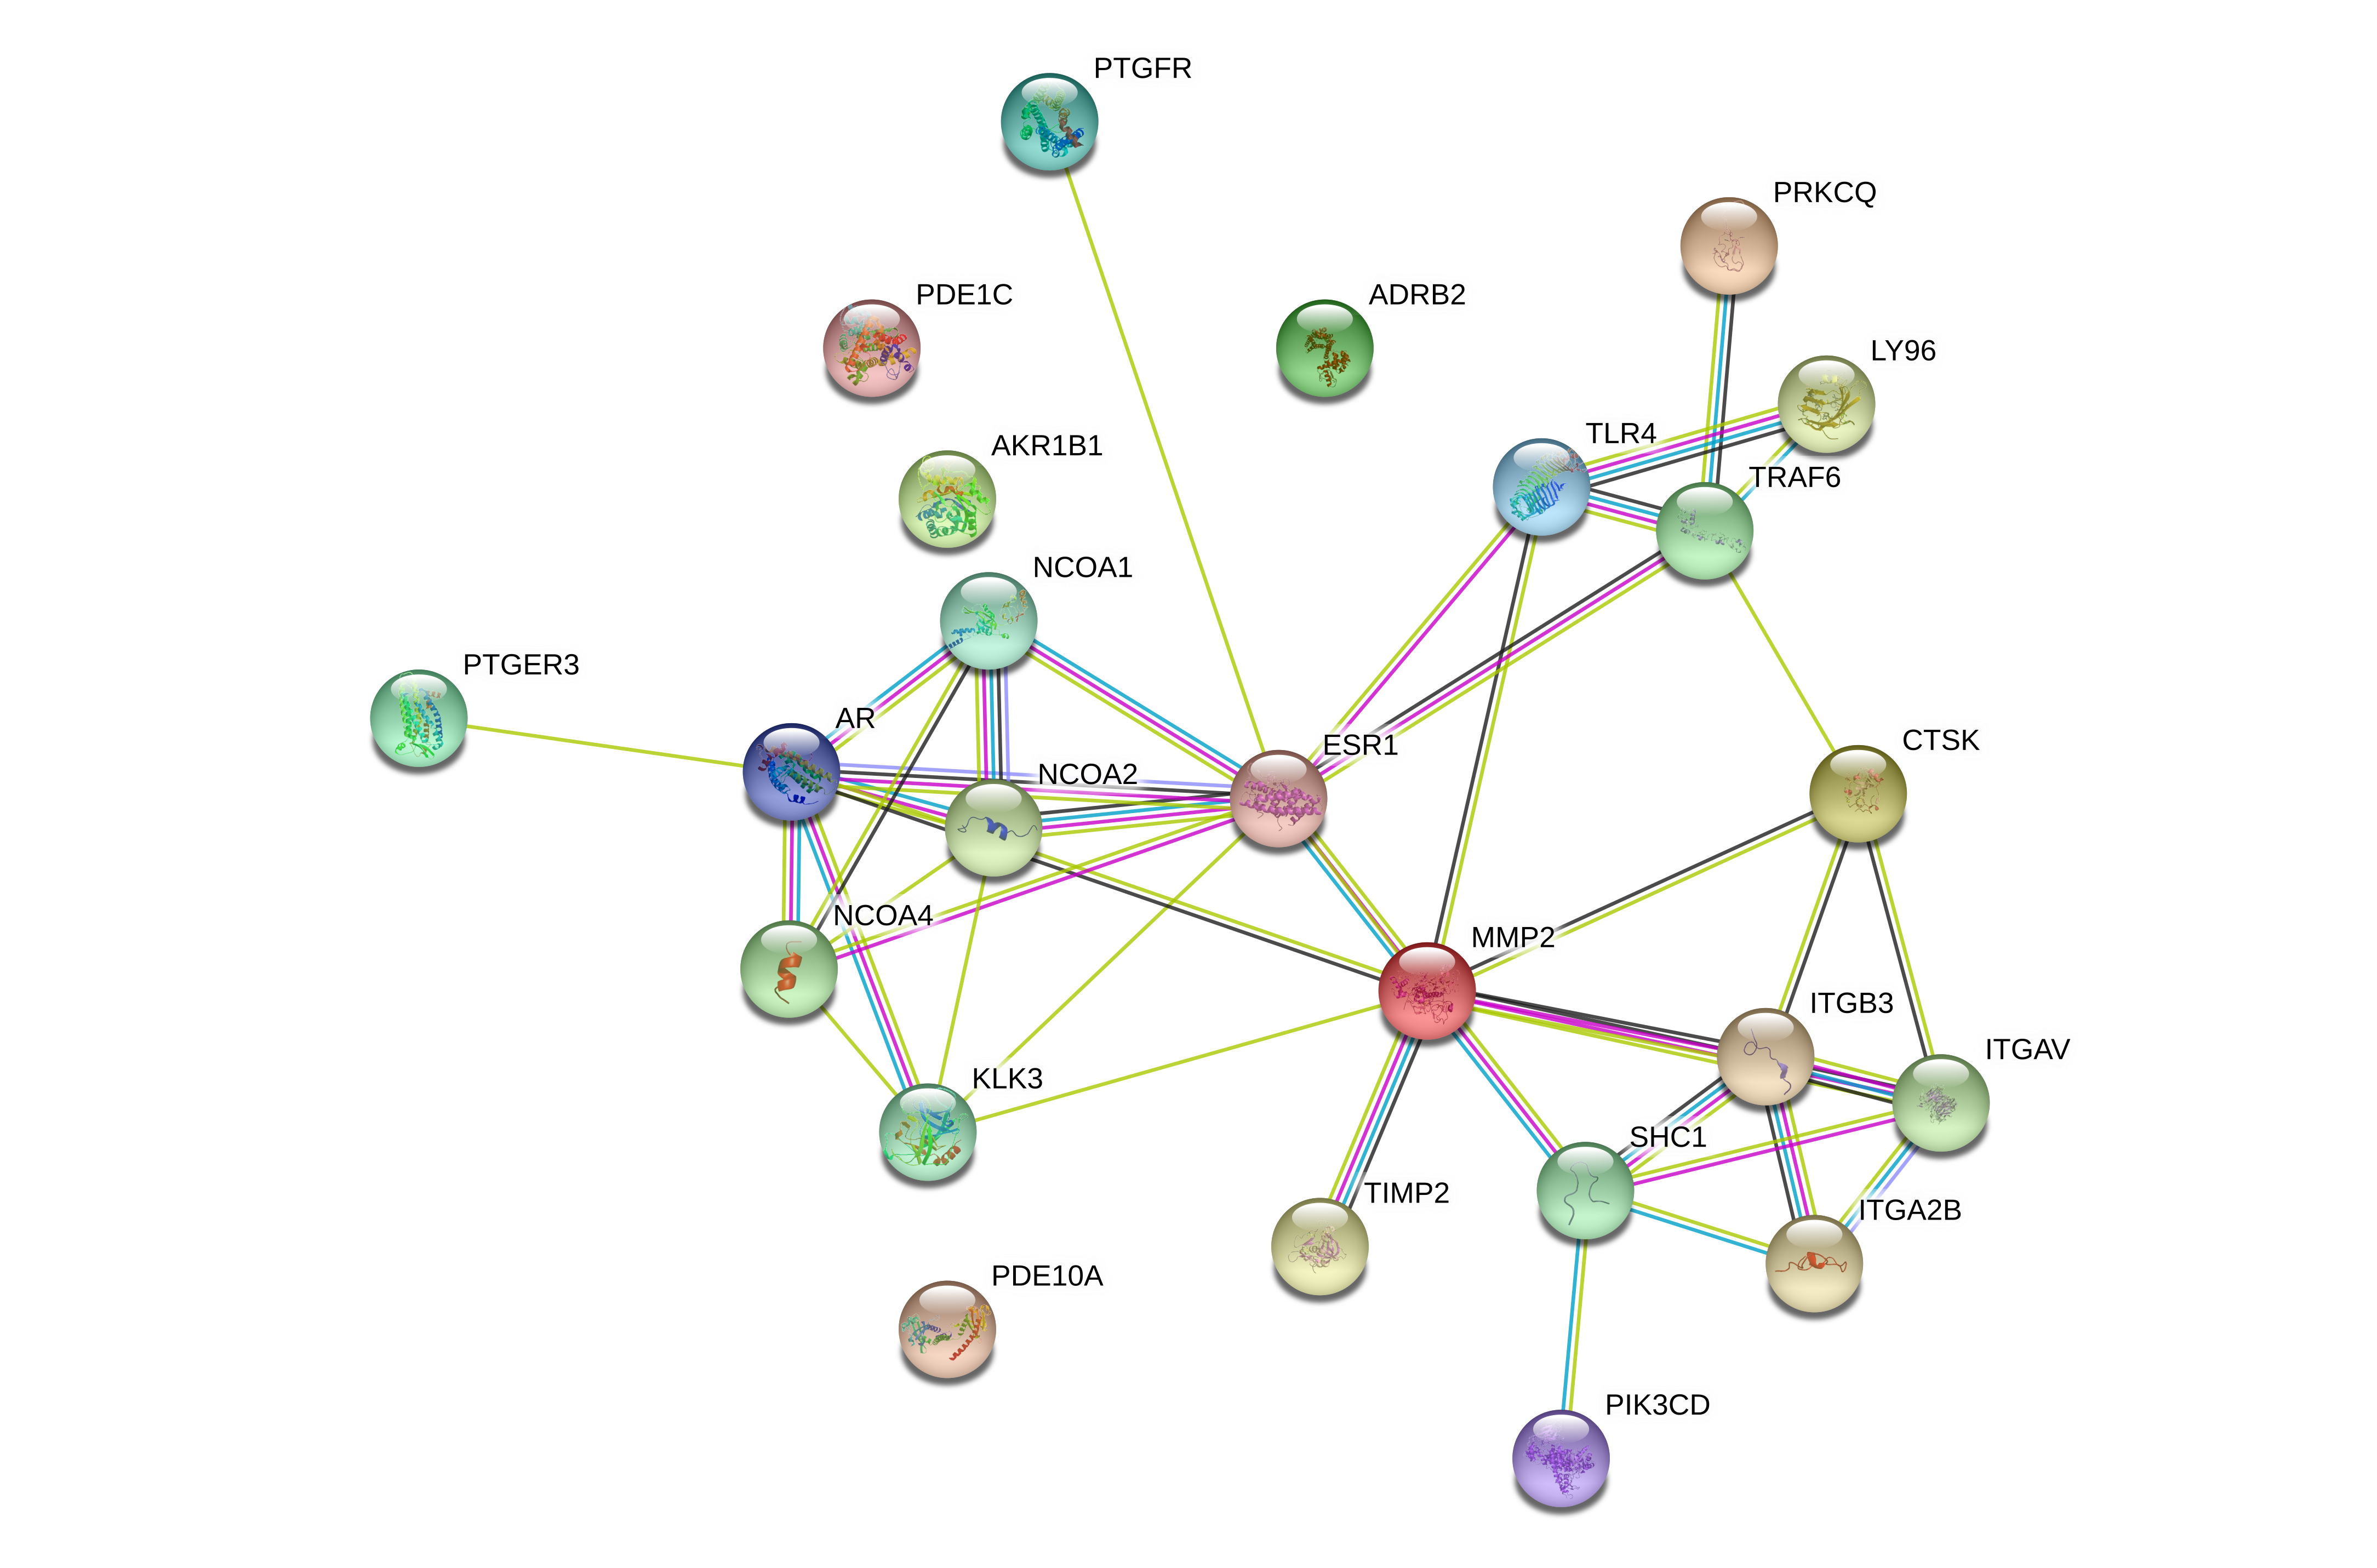
A total of 14 putative targets were uploaded to the STRING database to identify the functional partnerships and interactions between them. The key genes and their interacting proteins form the PPI network for functional enrichment analysis (Supplemental Fig.1). For further interpretation of the function of the key gene, KEGG and GO annotations were performed in R software. A total of 127 GO entries were identified, including 93 biological process (BP), 25 molecular function (MF), and 9 cellular component (CC) (FDR < 0.01 and P < 0.01). The top ten GO terms were tissue homeostasis, anatomical structure homeostasis, toll-like receptor signaling pathway, bone resorption, intracellular receptor signaling pathway, multicellular organismal homeostasis, integrin complex, protein complex involved in cell adhesion, tissue remodeling, response to ketone (Figure6A-C). The KEGG results demonstrated that 37 entries satisfy FDR < 0.05 and P < 0.05 (Figure 6D). These targets were significantly enriched in many pathways related to cancer and signaling pathways, such as the PI3K-Akt signaling pathway. In addition, there was also Toll-like receptor signaling pathway related to immunity significantly enriched (Figure 7).
We also conducted a modular analysis of lncRNA-miRNA-mRNA Axis intervened by CKI in Cytoscape by Mcode. A total of key modules were analyzed including CTSK, ITGB3, PTGER3, hsa-miR-20a-5p and hsa-miR-30a-5p five targets (Figure 8A). To gain insights into the pharmacological mechanisms of CKI on GC, we performed KEGG analysis for two key miRNAs. The results illustrated that the validated targets of hsa-miR-20a-5p and hsa-miR-30a-5p were both associated with the pathways closely related to the occurrence and development of cancer, such as Pathways in cancer, Hippo signaling pathway and p53 signaling pathway (Figure 8B).
Results of meta-analysis
A total of 8 microarrays from the GEO database met the entry criteria. The features of the included GEO datasets are depicted in Table 2. The expression data from the tumor and control groups were collected on the basis of the GEO database. A meta-analysis was conducted on the basis of expression data of the 8 included microarrays. The results (Figure 9) demonstrated that 7 of the key genes were remarkable abnormal regulation in the stomach cancer groups. Given the apparent heterogeneity, a random effects model was applied. On the one hand, ADRB2 (SMD = − 1.46; 95% CI – 2.02, − 0.91; p <0.01), PDE1C (SMD = − 0.75; 95% CI – 1.11, − 0.39; p <0.01) and PTGER3 (SMD = −0.58; 95% CI −1.08; −0.07; p <0.01) were down-regulation in the cancer groups which might be the tumor suppressor gene. On the other hand, AKR1B1 (SMD = 0.3; 95% CI 0.01; 0.60; p <0.01), CTSK (SMD = 1.52; 95% CI 0.98; 2.06; p <0.01), MMP2 (SMD = 1.02; 95% CI 0.51; 1.53; p <0.01), TLR4 (SMD = 0.85; 95% CI 0.34; 1.37; p <0.01) were up-regulation in the cancer groups which might be the tumor proto-oncogene. A sensitivity analysis was later conducted to explore whether a particular microarray played a vital role in significant heterogeneity. No study was found to have played a crucial role in any of the enrolled studies. A funnel plot was generated to estimate publication bias (Figure 10). The points in the funnel were distributed asymmetrically on both sides of the midline, indicating that the bias was mainly related to publication bias, but there might also be other reasons such as the lack of included literature (Figure 11).
Table 2. Features of the enrolled Gene Expression Omnibus datasets
|
Accession
|
GPL
|
Year
|
GC-count
|
Control-count
|
Source
|
|
GSE2685
|
GPL80
|
2005
|
22
|
8
|
tissue
|
|
GSE19826
|
GPL570
|
2010
|
12
|
12
|
tissue
|
|
GSE27342
|
GPL5175
|
2011
|
80
|
80
|
tissue
|
|
GSE33335
|
GPL5175
|
2012
|
25
|
25
|
tissue
|
|
GSE54129
|
GPL570
|
2017
|
111
|
21
|
tissue
|
|
GSE63089
|
GPL5175
|
2014
|
45
|
45
|
tissue
|
|
GSE79973
|
GPL5175
|
2016
|
10
|
10
|
tissue
|
|
GSE29998
|
GPL6947
|
2012
|
50
|
49
|
tissue
|
Survival analysis of key genes
A Kaplan–Meier curve was later used to identify the effects of the expression of hub genes on survival time. As is shown in Figure 12, AKR1B1 (p=0.000988), AR (p=0.0102), ITGB3 (p=0.0389), MMP2 (p=0.0465), PTGER3 (p=0.0449) and PTGFR (p=0.0439) with the p values were all less than 0.05, thus indicated that these genes may be the key targets affecting the survival of GC patients
Immunohistochemical analysis of hub genes
Through the above analysis, it was found that AKR1B1, MMP2 and PTGER3 were statistically significant in GEO chip meta-analysis and prognostic survival analysis. Therefore, we considered these three genes as the hub genes of CKI in the treatment of GC. Immunohistochemical (IHC) images of human stomach tissue samples stained with antibody were also obtained from the human protein atlas (http://www.proteinatlas.org/) [44]. Furthermore, the IHC profiler Plugin was utilized to automatically score the staining of the sample through the spectral deconvolution method [45]. According to the analysis results, AKR1B1 and MMP2 were negative in normal gastric tissue and low positive in tumor tissue, whereas PTGER3 was low positive in normal tissue and negative in tumor tissue (Figure 13). These results approved our finding.
Results of immunoinfiltration analysis
Analysis using TIMER showed that hub genes was negatively associated with purity, and ADRB2 (cor=-0.275) was most negatively correlated with tumor purity. In addition, the key genes were strongly correlated with macrophages and dendritic cells. Wherein PTGER3 correlation of macrophages (cor=0.637) and CTSK (cor=0.624) for the relevance of dendritic cells was the strongest correlation (Table 3, Figure 14A-C). Univariate Cox survival analysis showed that among the six types of immune cells, only macrophages were associated with the survival of GC patients, which was an indicator of the survival of GC patients (Figure 14D).
Table 3. Immunoinfiltration analysis of key targets in TIMER
|
Gene
|
Purity
|
B Cell
|
CD8+ T Cell
|
CD4+ T Cell
|
Macrophage
|
Neutrophil
|
Dendritic Cell
|
|
ADRB2
|
-0.275
|
0.246
|
0.321
|
0.516
|
0.521
|
0.310
|
0.454
|
|
AKR1B1
|
-0.100
|
-0.099
|
0.337
|
0.245
|
0.419
|
0.359
|
0.495
|
|
AR
|
-0.143
|
0.129
|
0.129
|
0.484
|
0.618
|
0.169
|
0.352
|
|
CTSK
|
-0.229
|
-0.162
|
0.311
|
0.292
|
0.624
|
0.433
|
0.530
|
|
ESR1
|
-0.216
|
0.139
|
0.461
|
0.608
|
0.615
|
0.489
|
0.621
|
|
ITGB3
|
-0.149
|
0.134
|
0.159
|
0.500
|
0.471
|
0.252
|
0.349
|
|
MMP2
|
-0.182
|
-0.123
|
0.183
|
0.285
|
0.513
|
0.273
|
0.361
|
|
PDE10A
|
-0.115
|
0.072
|
0.176
|
0.306
|
0.442
|
0.233
|
0.340
|
|
PDE1C
|
-0.174
|
0.303
|
0.122
|
0.527
|
0.432
|
0.116
|
0.229
|
|
PIK3CD
|
-0.230
|
0.065
|
0.504
|
0.566
|
0.409
|
0.518
|
0.665
|
|
PRKCQ
|
-0.122
|
0.031
|
0.443
|
0.317
|
0.239
|
0.356
|
0.459
|
|
PTGER3
|
-0.130
|
0.061
|
0.194
|
0.448
|
0.637
|
0.199
|
0.398
|
|
PTGFR
|
-0.192
|
0.119
|
0.280
|
0.486
|
0.573
|
0.352
|
0.445
|
|
TLR4
|
-0.146
|
-0.121
|
0.389
|
0.340
|
0.548
|
0.537
|
0.641
|
Molecular docking
Docking studies were carried out between CKI and hub genes, and the 3D protein structures of PTGFR and PDE1C were not found in the PDB database. The molecular docking results were shown in Table 4. AR, ITGB3, AKR1B1, ADRB2 and PTGER3 were top five genes of affinities predicted for the interaction between each of the five protein targets and corresponding CKI components.
As shown in Figure 15A, oxysophocarpine binds to a pocket in AR, which is comprised of Met895, Asn705, Trp741, Leu704, Gly708, Leu707, Gln711, Met745, Met749, Phe764, Val746, Met787 and Leu873. The results in Figure 15B show that interaction between AR and sophocarpine is centered on a stable hydrophobic core consisting of several nonpolar residues (Met787, Asn705, Met895, Leu704, Leu707, Gly708, Gln711, Met745, Met749, Phe764, Met780 and Leu873). The fifteen hydrophobic bonds, including Met780, Leu704, Asn705, Met895, Gly708, Leu707, Trp741, Met745, Gln711, Met749, Phe764, Val746, Leu873, Met787 and Met742 are formed in the interaction between sophoranol and AR (Figure 15C). The action modes baptifoline of and AR are shown in Figure 15D. Hydrophobic interactions with eleven residues in AR (Leu704, Trp741, Met742, Val746, Gln711, Met749, Phe764, Arg752, Leu707, Met745 and Gly708) and one hydrogen bonds (Asn705).
Moreover, the results in Figure 15E show that oxymatrine can bind to ITGB3 by forming a hydrophobic interaction with the surrounding residues Glu536, Arg515, Asn508, Phe547, Tyr571 and Lys548. Oxymatrine could form H-bonds with Tyr571 and Ser507.
The docking results in this study demonstrate that the receptor–ligand interaction between liriodendrin and AKR1B1 involves both hydrophobic interactions and polar interactions. As shown in Figure 15F, their interaction is centered on a stable hydrophobic core consisting of several nonpolar residues in AKR1B1 (Pro24, Gln49, Ala212, Lys21, Val47, Trp20, Cys298, Leu301, Trp219, Pro23 and Asn50). In addition, the hydroxyls within the main chains of Leu300, Ala299, Lys211, Trp20 and Ser22 form five hydrogen bond contacts with the liriodendrin, which further stabilizes the entire interaction region.
According to the analysis shown in Figure 15G, 9α-hydroxymatrine was observed to form hydrophobic interactions with eleven residues in ADRB2 (Phe290, Ser203, Ser204, Phe289, Phe193, Asn312, Asp113, Val117, Val114, Trp286 and Ser207) and one hydrogen bonds with Thr118.
The fifth genes PTGER3 bind to sophoranol with ten hydrophobic bonds, including Gln339, Ser336, Met58, Ile340, Gln103, Thr107, Val110, Met137, Phe133 and Thr106 (Figure 15H).
Table 4. Molecular docking information
|
Protein Name
|
PDB ID
|
Test Compounds
|
Affinity
|
Protein Name
|
PDB ID
|
Test Compounds
|
Affinity
|
|
(kcal/mol)
|
(kcal/mol)
|
|
AKR1B1
|
4JRI
|
liriodendrin
|
-7.8
|
ITGB3
|
6BXJ
|
isomatrine
|
-6.9
|
|
TLR4
|
5IJD
|
oxymatrine
|
-7
|
ITGB3
|
6BXJ
|
lamprolobine
|
-6.4
|
|
ESR1
|
4XI3
|
piscidic acid
|
-6.7
|
ITGB3
|
6BXJ
|
matrine
|
-7.1
|
|
PRKCQ
|
1XJD
|
lamprolobine
|
-7
|
ITGB3
|
6BXJ
|
oxymatrine
|
-8.2
|
|
PIK3CD
|
5IS5
|
adenine
|
-5.2
|
ITGB3
|
6BXJ
|
sophoranol
|
-7.1
|
|
CTSK
|
2FTD
|
isomatrine
|
-6.2
|
ITGB3
|
6BXJ
|
sophoridine
|
-6.8
|
|
CTSK
|
2FTD
|
lamprolobine
|
-6.2
|
PDE10A
|
4MVH
|
9α-hydroxymatrine
|
-6.2
|
|
CTSK
|
2FTD
|
matrine
|
-6.6
|
PDE10A
|
4MVH
|
lamprolobine
|
-6.4
|
|
CTSK
|
2FTD
|
oxymatrine
|
-6.5
|
PDE10A
|
4MVH
|
sophoranol
|
-6.5
|
|
CTSK
|
2FTD
|
sophoridine
|
-6.4
|
AR
|
4OEA
|
9α-hydroxymatrine
|
-7.5
|
|
MMP2
|
1QIB
|
adenine
|
-6.3
|
AR
|
4OEA
|
baptifoline
|
-8.2
|
|
MMP2
|
1QIB
|
matrine
|
-7.3
|
AR
|
4OEA
|
oxysophocarpine
|
-9.8
|
|
ADRB2
|
3NY9
|
9α-hydroxymatrine
|
-7.8
|
AR
|
4OEA
|
sophocarpine
|
-9.4
|
|
ADRB2
|
3NY9
|
sophoranol
|
-6.6
|
AR
|
4OEA
|
sophoranol
|
-9
|
|
PDE1C
|
1LXS
|
lamprolobine
|
-7.8
|
PTGER3
|
6AK3
|
9α-hydroxymatrine
|
-7.4
|
|
ITGB3
|
6BXJ
|
9α-hydroxymatrine
|
-7.3
|
PTGER3
|
6AK3
|
sophoranol
|
-7.7
|