Phenotypic data analysis
The statistical analysis for fiber related traits, including lint percentage (LP), fiber elongation (FE), fiber uniformity (FU), fiber strength (FS), fiber micronaire reading (FM), and fiber length (FL), and the phenotypic data of these six traits from two parents and the RIL population under four different environments were summarized in (Table1). Almost under all environments, the fiber length and fiber strength of Yumian 1 were higher than M11’s. In general, all these six traits were observed to show continuous variation and transgressive segregation. The Skewness and the kurtosis tests granted that all these traits were approximately normally distributed.
One-way ANOVA analysis for all the six traits were carried out and summarized in (Table 2). The result showed that all of them, except fiber uniformity, had significant genetic and environmental effects (p < 0.05).
Correlations among the tested traits, based on phenotypic data from four environments for the RIL population, were shown in (Table 3). Among them, fiber length presented significant correlation with the other four fiber quality traits. Fiber strength was significantly negative correlated with fiber micronaire and was significantly positive correlated with fiber elongation. Lint percentage had significant negative and positive correlations with fiber strength and fiber micronaire respectively.
QTL identification for fiber related traits
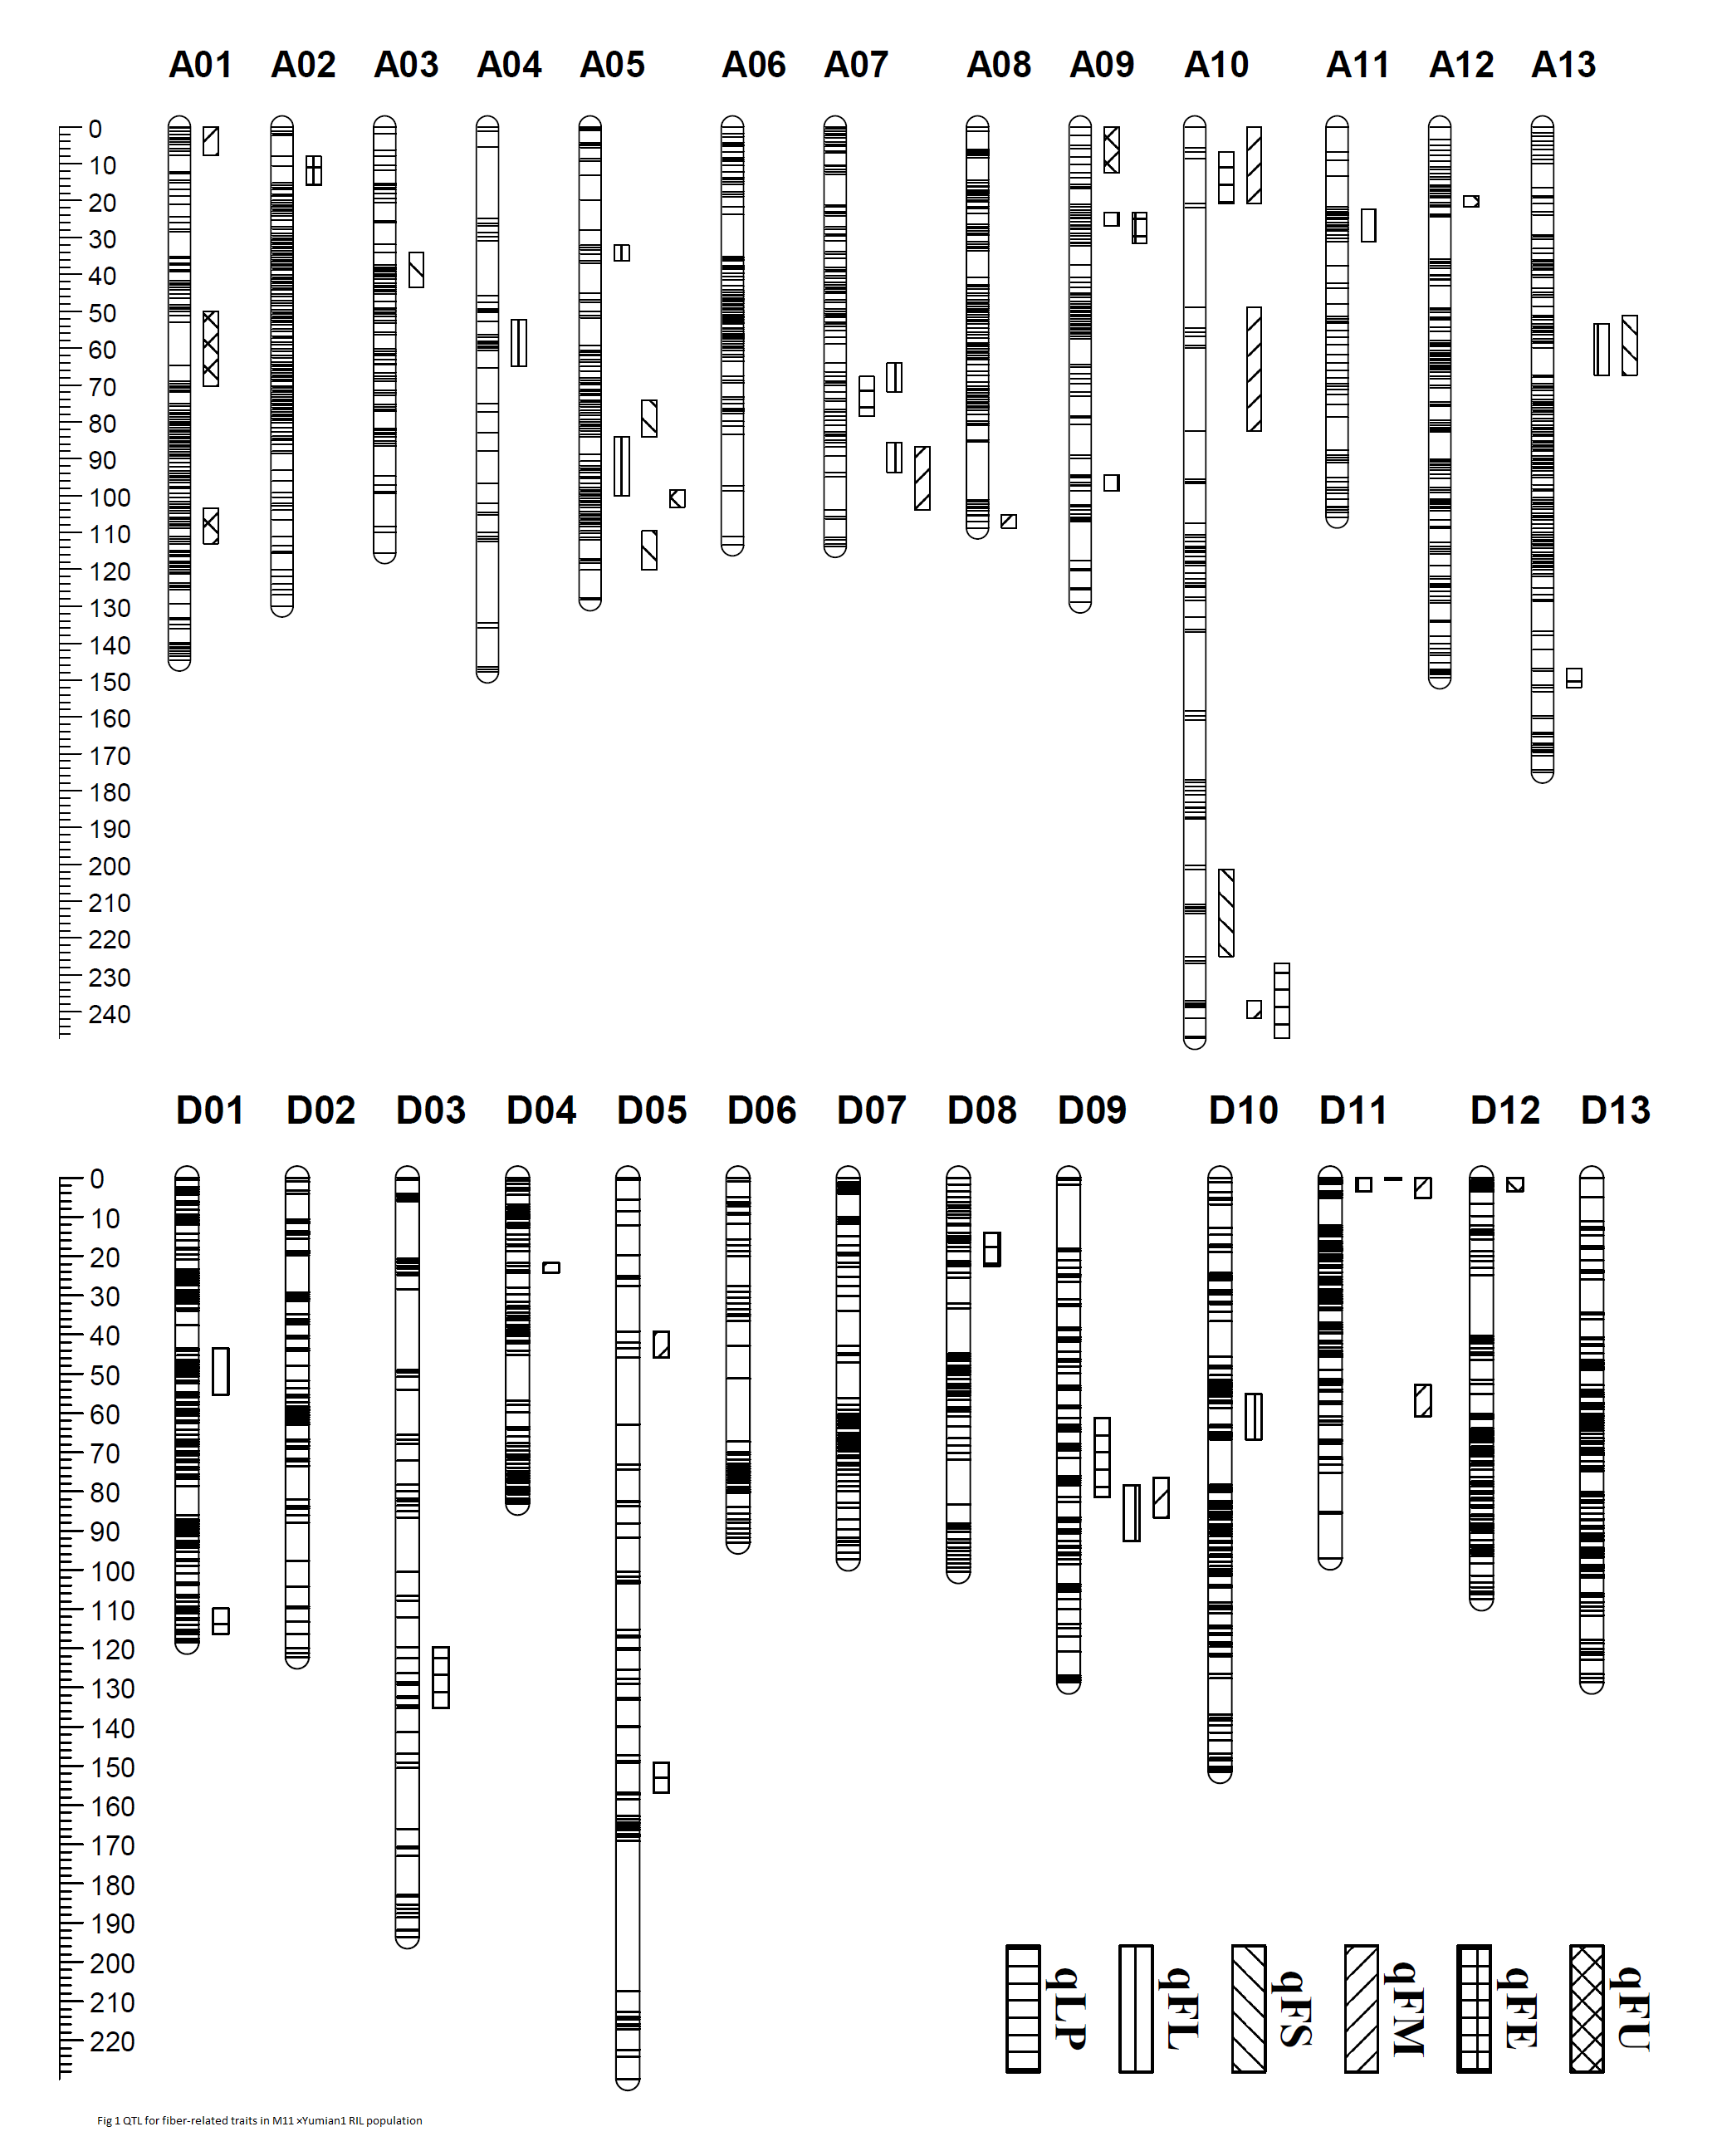
A total of forty-seven QTL for fiber related traits were identified across four environments and distributed on twenty-one chromosomes (Table 4; Fig. 1). The phenotypic variation explained (PVE) value of these QTL ranged from 10.1 to 21.1 %, and their LOD value ranged from 2.0 to 4.4. At subgenome carried thirty-one QTL, while Dt subgenome contained sixteen QTL, and almost all chromosomes carried one or more QTL with the exception of chromosomes A06, D02, D06, D07 and D13. Six stable QTL, including two for lint percentage, two for fiber length and two for fiber micronaire, were identified under more than one environment. These six stable QTL were thought to be environment-stable QTL.
Lint percentage (LP)
Seven QTL for lint percentage were detected on seven chromosomes, with PVE value ranged from 10.1% to 20.6 % and LOD values ranged from 2.0 to 4.3. Notably, favorable alleles of most QTL, except qLP-D05-1, were contributed by Yumian 1. Besides, two QTL were identified in three environments, including qLP-D03-1 and qLP-ChrD09-1.
Fiber Length (FL)
Thirteen QTL for fiber length were identified on 10 chromosomes, with LOD values range from 2.0 to 4.4 and PVE value from 10.1 to 21.1 %. The favorable alleles of qFL-A05-2, qFL-A09-2, qFL-A11-1, qFL-A13-1, and qFL-D11-1 were provided by Yumian 1, and the others were provided by M11. In addition, two QTL (qFL-A07-2 and qFL-D11-1) were identified in two different environments.
Fiber Strength (FS)
Six QTL for fiber strength were detected on five chromosomes, including five QTL on the At subgenome and one QTL on the Dt subgenome. The PVE value of these QTL ranged from 10.6% to 14.9%, and the LOD value of them ranged from 2.1 to 3.0. M11 provide favorable alleles to qFS-A10-1. The favorable alleles of the other five QTL were contributed by Yumian 1.
Fiber Micronaire (FM)
Eleven QTL for fiber micronaire were identified, with LOD values from 2.0 to 3.6. The PVE values of these QTL ranged from 10.1% to 17.6%. The favorable allele of qFM-A07-1, qFM-A08-1 and qFM-D09-1 were contributed by Yumian 1, and the other eight QTL were provided by M11. Besides, qFM-A08-1 and qFM-D11-1 was detected in two environments.
Fiber Uniformity (FU)
Six QTL for fiber uniformity ratio were identified on five chromosomes. The LOD value of these QTL ranged from 2.1 to 3.0, and the PVE value ranged from 10.5% to 16.2 %. Only the favorable allele of qFU-A05-1 was provided by Yumian 1, while the favorable alleles of the others were contributed by M11.
Fiber Elongation (FE)
Four QTL for fiber elongation were detected on four chromosomes, with PVE values ranged from 10.3 to 16.3 % and LOD values from 2.0 to 3.0. Among them, the favorable alleles of qFE-A02-1 and qFE-D08-1 were contributed by Yumian 1, the other two QTL were derived from M11.
QTL clusters
Four QTL clusters that located on chromosomes A05, A10, D09, and D11 were detected and summarized in (Table 5). The favorable alleles of QTL from cluster-A05 were all contributed by Yumian 1, whereas the favorable alleles of QTL from cluster-A10 were all provided by M11. Remarkably, cluster-D09 contained the stable lint percentage QTL qLP-D09-1 and cluster-D11 contained the stable fiber micronaire QTL qFM-D11-1.
QTL by environment interaction
Through QEI analysis, a total of thirteen QEI were identified, including one QEI for lint percentage, five QEI for fiber length, three QEI for fiber strength, two QEI for fiber micronaire, one QEI for fiber uniformity and one QEI for fiber elongation. The details of each QEI were listed in (Table 6). Except for QEI-FS-A03-2, whose environment effect made higher phenotypic contribution than the additive effect, the other 12 QEI showed stability across environments. By comparing the QEI results with QTL identified through individual environment, QEI-LP-D03-1, QEI-FL-D01-1, QEI-FL-D09-1, QEI-FS-A03-1, QEI-FS-A05-1 and QEI-FM-A08-1 were found to be located in the same region with qLP-D03-1, qFL-D01-1, qFL-D09-1, qFS-A03-1, qFS-A05-1, and qFM-A08-1, respectively. This result indicated that qLP-D03-1 and qFM-A08-1 were environmentally stable QTL with QTL by environment interaction.