Clinical samples and cell cultures
HT-29, SW480, HCT116, CACO-2 and RKO cells (Shanghai Institute of Cell Biology, Chinese Academy of Sciences) were maintained in DMEM medium (HyClone; GE Healthcare Life Sciences, Logan, UT, USA) and SW620 cells (Shanghai Institute of Cell Biology, Chinese Academy of Sciences) were maintained in 1640 medium (HyClone; GE Healthcare Life Sciences, Logan, UT, USA), with 10% fetal bovine serum (HyClone; GE Healthcare Life Sciences, Logan, UT, USA) at 37 °C in 5% CO2.
Lentiviral vectors and transfection
The lentiviral vectors were constructed by GeneChem Co., Ltd. (Shanghai, China). The phU6-EGFP-shRNA-SHP lentiviral vectors and their control vectors were prepared and used to inhibit SHP expression. According to the manufacturer’s protocol, we performed all transfections.
Cell viability assays
Cells were seeded into 96-well culture plates at 5000 cells/well and treated with different doses of GW4064 and Oxaliplatin for 48 h. Based on the manufacturer’s protocol, cell viability was examined using the Cell Counting Kit-8 assay (CCK8, Dojindo, Tokyo, Japan).
Cell apoptosis
Cell apoptosis assay were performed as described previously(31). For apoptosis analysis, cells were stained with Annexin V-APC and 7-ADD (Multi Sciences, Hangzhou, Zhejiang, China) according to the manufacturer's protocol. Cell apoptosis were assessed using flow cytometry (BD Biosciences). Flowjo 10.0 software (FlowJo LLC, Ashland, OR, USA) was used to analyze the data.
Microscopy assay
To examine the morphology of cells, cells were seeded in 6-well plates at approximately 30% confluence and performed to the indicated treatments. A Nikon microscope was used to take the Static bright-field cell images. The pore-forming activity of pyroptosis was observed by transmission electron microscopy (TEM).
Nude mouse xenograft assay
All animal experiments were approved by the Institutional Animal Care and Use Committee of the First Affiliated Hospital of Xi’an Jiaotong University. The 4-week-old female BALB/c-nude mice were purchased from Shanghai SLAC Laboratory Animal Co., Ltd. (Shanghai, China). HT-29 cells (5×10⁶) in logarithmic growth phase were subcutaneously injected into the flanks of nude mice. When the palatable xenograft tumors were established, oxaliplatin (3 mg/kg) and GW4064 (15 mg/kg) as both single agents and in combination was injected intraperitoneally twice a week for 3 weeks. The control group received DMSO by intraperitoneally injection. The tumor width (b) and length (a) were measured using the callipers every 3 days. The tumor volume (V) was obtained as follows: V = ab2/2. The animals were sacrificed and the xenograft tumors were measured at the end of the experiment.
Immunohistochemistry (IHC)
For IHC, the staining procedure was performed using the standard avidin–biotin complex method. According to the extent and intensity of the staining, the stained sections were divided into two groups (negative and positive). The extent of positively stained cells was scored on a scale from 0 to 4: 0–5% (0), 6–25% (1), 26–50% (2), 51–75% (3), and 76–100% (4). The staining intensity was scored on a scale from 0 to 3: negative (0), weakly positive (1), moderately positive (2), and strongly positive (3). The immunoreactivity score (IRS) is defined as the product of the extent score and the intensity score. An IRS of ≤3 was defined as negative, and a score of >3 was defined as positive. Two pathologists evaluated all the specimens in a blinded manner.
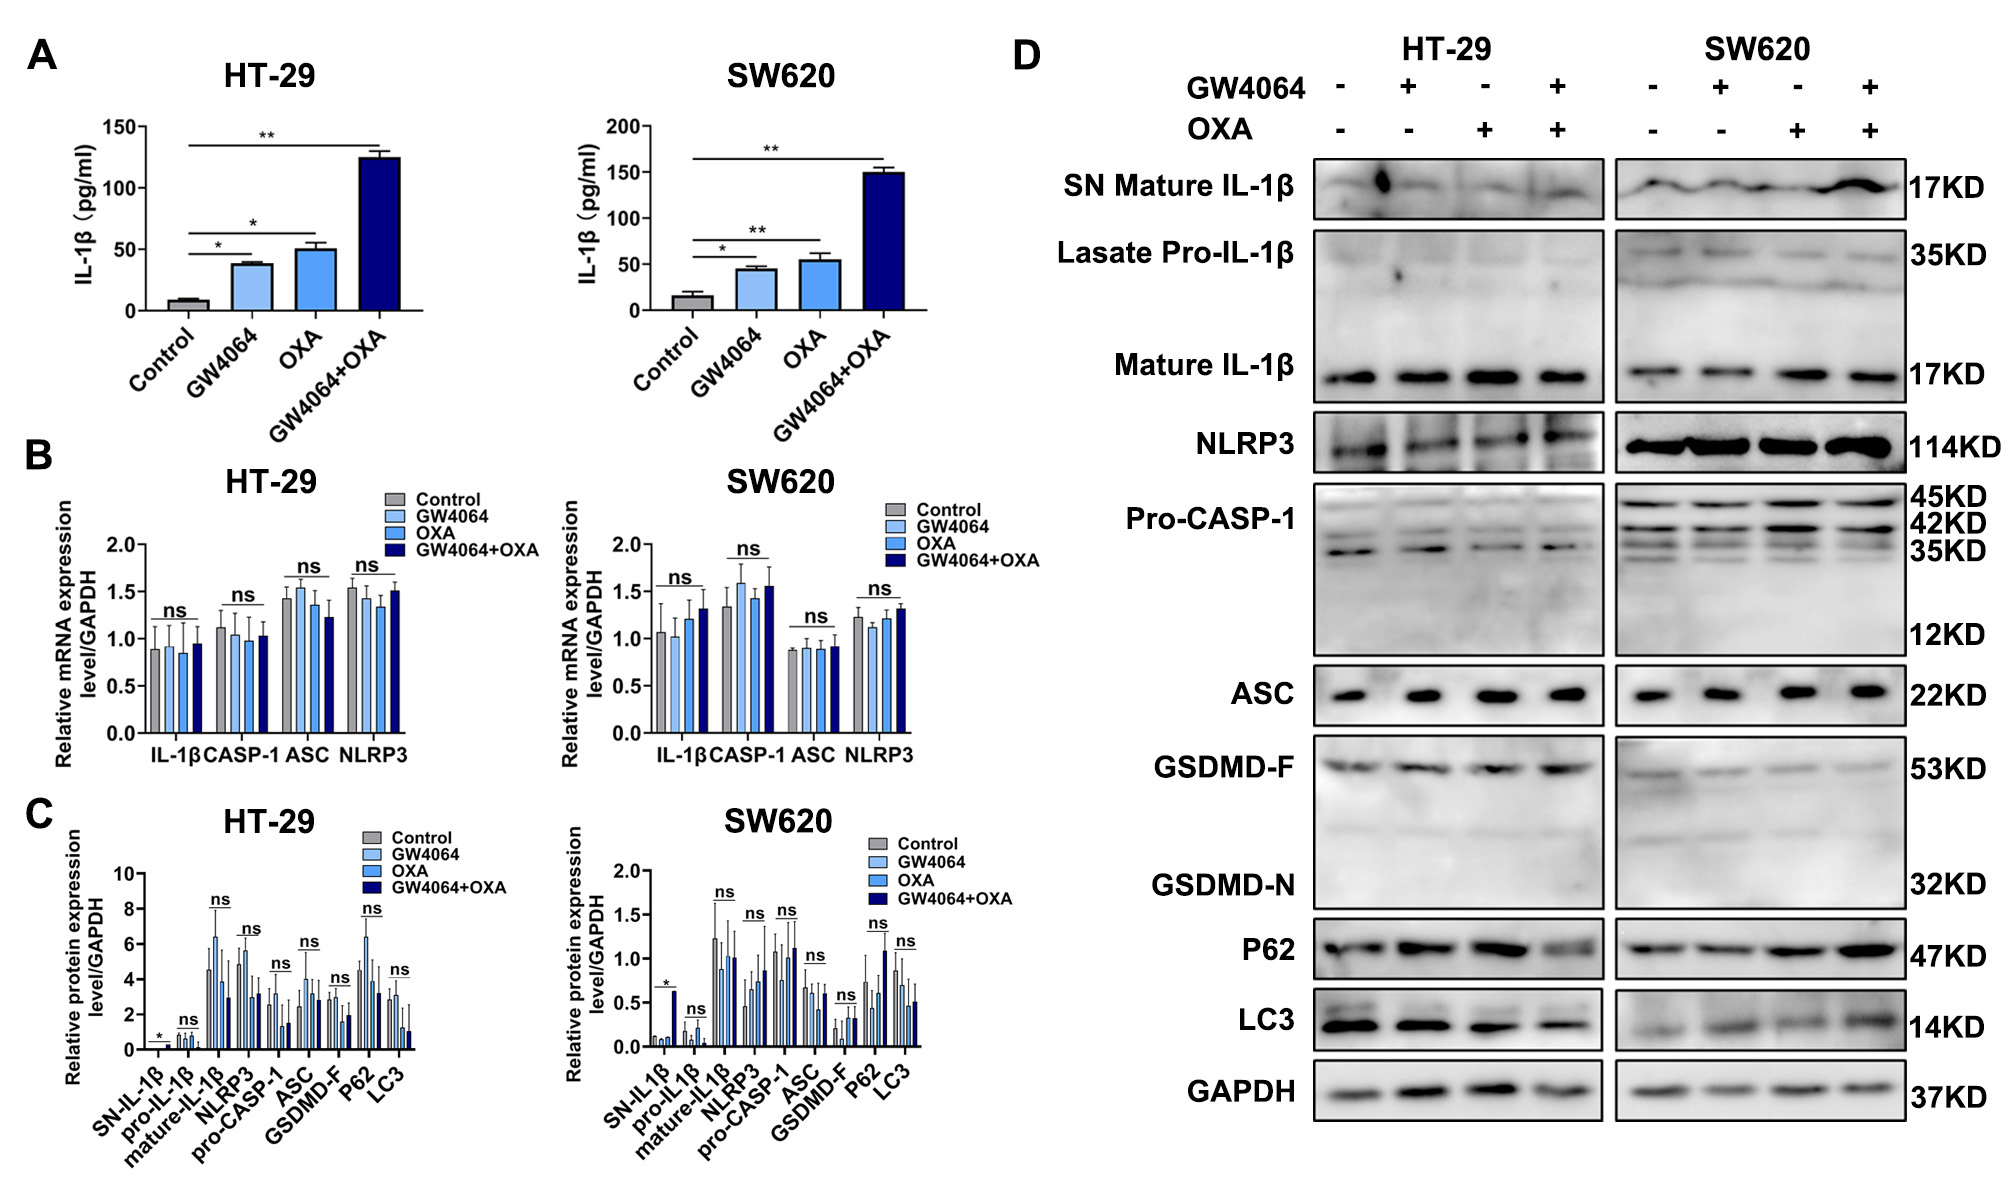
IL-1β release assay
IL-1β was measured using a QuantiCyto IL-1β ELISA kit (Neobioscience, Chenzhen, China) according to the manufacturer’s instructions. The absorbance value at 450 nm was then measured.
RNA isolation and real-time PCR
TRIzol reagent (Invitrogen, Carlsbad, CA, USA) was used to isolate the total RNA. The PrimeScript RT Reagent Kit (TaKaRa, Osaka, Japan) was used to synthesize complementary DNA (cDNA). According to SYBR Green fluorescence signal detection assays (TaKaRa, Osaka, Japan) with primers (Table S1), real-time PCR was performed on an IQ5 instrument (Bio-Rad, CA, USA). The level of specific mRNA expression was quantified by the 2-ΔΔCT method.
Protein extraction and western blotting
RIPA buffer (Heart, Xi’an, China) was used to lyse cells and fresh tissue. Tissue or cell lysates containing 50μg of total protein were then loaded and separated to SDS–PAGE (Beyotime, Shanghai, China) and then transferred to polyvinylidene difluoride membranes (Millipore, Billerica, MA, USA). The membranes were blocked with 5% fat-free dry milk at room temperature for 1 h and incubated with appropriate primary antibodies at 4 °C overnight (anti-GSDME, Bax, Bcl-2, Bcl-xL, Cytochrome C, PARP, caspase-1/3/8/9, GAPDH, SHP, STAT3, p-STAT3, P62, LC3, IL-1β, NLRP3, ASC and GSDMD, 1:1000 dilution). The membrane was then washed four times with TBS-Tween-20 buffer for 8 min each and incubated with a goat anti-rabbit horseradish peroxidase-conjugated secondary antibody for 1 h at room temperature. Chemiluminescent HRP substrate (Millipore, Billerica, MA, USA) was purchased and used to visualize the protein bands. The antibodies against SHP and GAPDH were purchased from Santa Cruz (Dallas, TX, USA), the antibodies against Bax, Bcl-2, Bcl-xL, caspase-1/3/8/9, STAT3, p-STAT3, P62, LC3, IL-1β, NLRP3 and ASC were purchased from Abcam (Cambridge, MA, USA), and the antibodies against Cytochrome C, PARP and GSDMD were purchased from Cell Signaling Technology (Danvers, MA, USA).
Drug combination studies
Cells per well were seeded at a density of 5×10³ in the 96-well plates. The following day, the cells were treated with a single drug or with a combination of oxaliplatin and GW4064 for 48 hours. Cell viability was measured using the CCK-8 assay. Combination index (CI) and fraction affected (Fa) values were calculated using CompuSyn software. CI<1 indicates synergy, CI=1 indicates an additive effect, and CI>1 indicates antagonism.
Statistical analysis
Every experiment was repeated three times. Data are showed as the means ± SD. Student’s t-test or χ2 test was used to compare the differences among the groups. Statistical analyses were performed with SPSS 20.0 software (SPSS Inc, Chicago, IL, USA). A P value less than 0.05 was considered statistically significant.