2.1. Study location and hospitalization data of IBD
Hefei (31.87°N, 117.28°E) is the capital city of Anhui province which has a population of 5.03 million and an area of 7056 km². Hefei, as the economic, financial, cultural, and educational center of this province and the locale of this study, has been facing the problem of air pollution due to the rapid growth in the number of residents and vehicles in the past few years.
The data of the IBD patients were obtained from The First Affiliated Hospital of Anhui Medical University and The Second Affiliated Hospital of Anhui Medical University (from January 1, 2019 to December 31, 2019) in Hefei. The study only included patients living in the urban district of Hefei from January 1, 2019 to December 31, 2019, according to registered address. The IBD cases was diagnosed according to the Consensus on Diagnosis and Treatment of Inflammatory Bowel Disease (IBD) formulated by the Inflammatory Gastroenterology Group of the Chinese Society of Gastroenterology, published in Chinese Journal of Gastroenterology in 2018. We collected the medical information of all IBD cases from January 1, 2019 to December 31, 2019, which including age, gender, home address, clinic date, and the results of auxiliary examination.
2.2. Air pollution and meteorological data
We estimated the association between IBD visits and major ambient air pollutants with the consideration of the influence of meteorological factors. The daily concentrations of major air pollutants in the study period were provided by the Hefei Environmental Protection Bureau (HEPB), based on the average of ten air monitoring stations in Hefei. Daily meteorological factors were obtained from China Meteorological Data Network (http://data.cma.gov.cn). These data included the average temperature (°C), average air humidity (%), average air pressure (kPa), average wind speed (m/s), and average precipitation (mm). The individual exposure level of cases was measured by the average of ten monitoring stations. The pollutants included particulate matter with aerodynamic equivalent diameter < 10μm (PM10), PM2.5, O3, CO , NO2, and SO2, PM10, PM2.5, CO, NO2 and SO2 were 24-hour average concentration; O3 was 8h maximum average concentration. The concentrations of the pollutants were all expressed as μg/m³ except for CO, which was presented as mg/m³.
2.3. Statistical analysis
Spearman rank correlation analysis was performed to assess the correlations among major air pollutants, meteorological factors, and the daily admissions for IBD. The daily reports of IBD admissions are generally regarded as rare events, which follow a Poisson distribution approximately. Previous studies have demonstrated that there is a non-linear relationship between major air pollutants and health outcomes (Chun et al. 2020; Khreis et al. 2017). Therefore, we used the distributed lag nonlinear model (DLNM) based on the Poisson generalized linear model to assess the relationship between major air pollutants concentrations and IBD admission (Bernal et al. 2017; Gasparrini 2014). In this study, we established two models to evaluate the effects of major air pollutants concentrations change metrics, respectively.
First, we established a preliminary model without air pollutants. Since the purpose of this study was to assess the impact of short-term exposure of air pollution on the IBD visits, we adopt a natural cubic spline (ns) function to control the meteorological factors, seasonal variation, and long-term trends (Bhaskaran et al. 2013). "Time" variable (from 1 to 365 days) was used to control the long-term trends and seasonal variation with a 7* "years" degree of freedom (Kim and Lee 2019). Five meteorological factors including mean temperature (℃), air humidity (%), air pressure (kPa), wind speed (m/s), and precipitation (mm) were also controlled by ns function with 3 degrees of freedom (Cheng et al. 2019).
Second, we established cross-basis functions to explore exposure-lag-response bidimensional relationships. We adopt a linear and a natural cubic spline (ns) function to fit the exposure-response relationship and the lag-response relationship, respectively (Huang et al. 2020). As for the lag days, we established a cross-basis function for each pollutant and set the initial maximum lag to 5 days (Huang et al. 2020). Finally, the single-pollutant model was as follows:
Yt ~ Poisson (μt)
Log(μt) = α+ βXt+ ns (time, df) + ns (Zt, df)
In this formula, t is the day of the observation; Yt denotes the number of IBD visits on day t; μt is the expected mean of Yt; α is the interception; β is the regression coefficient for each air pollutants; Xt is pollutant concentrations at day t; ns is a natural smoothing function for nonlinear variables; df is the degree of freedom; Zt is meteorological data on day t (Cheng et al. 2019).
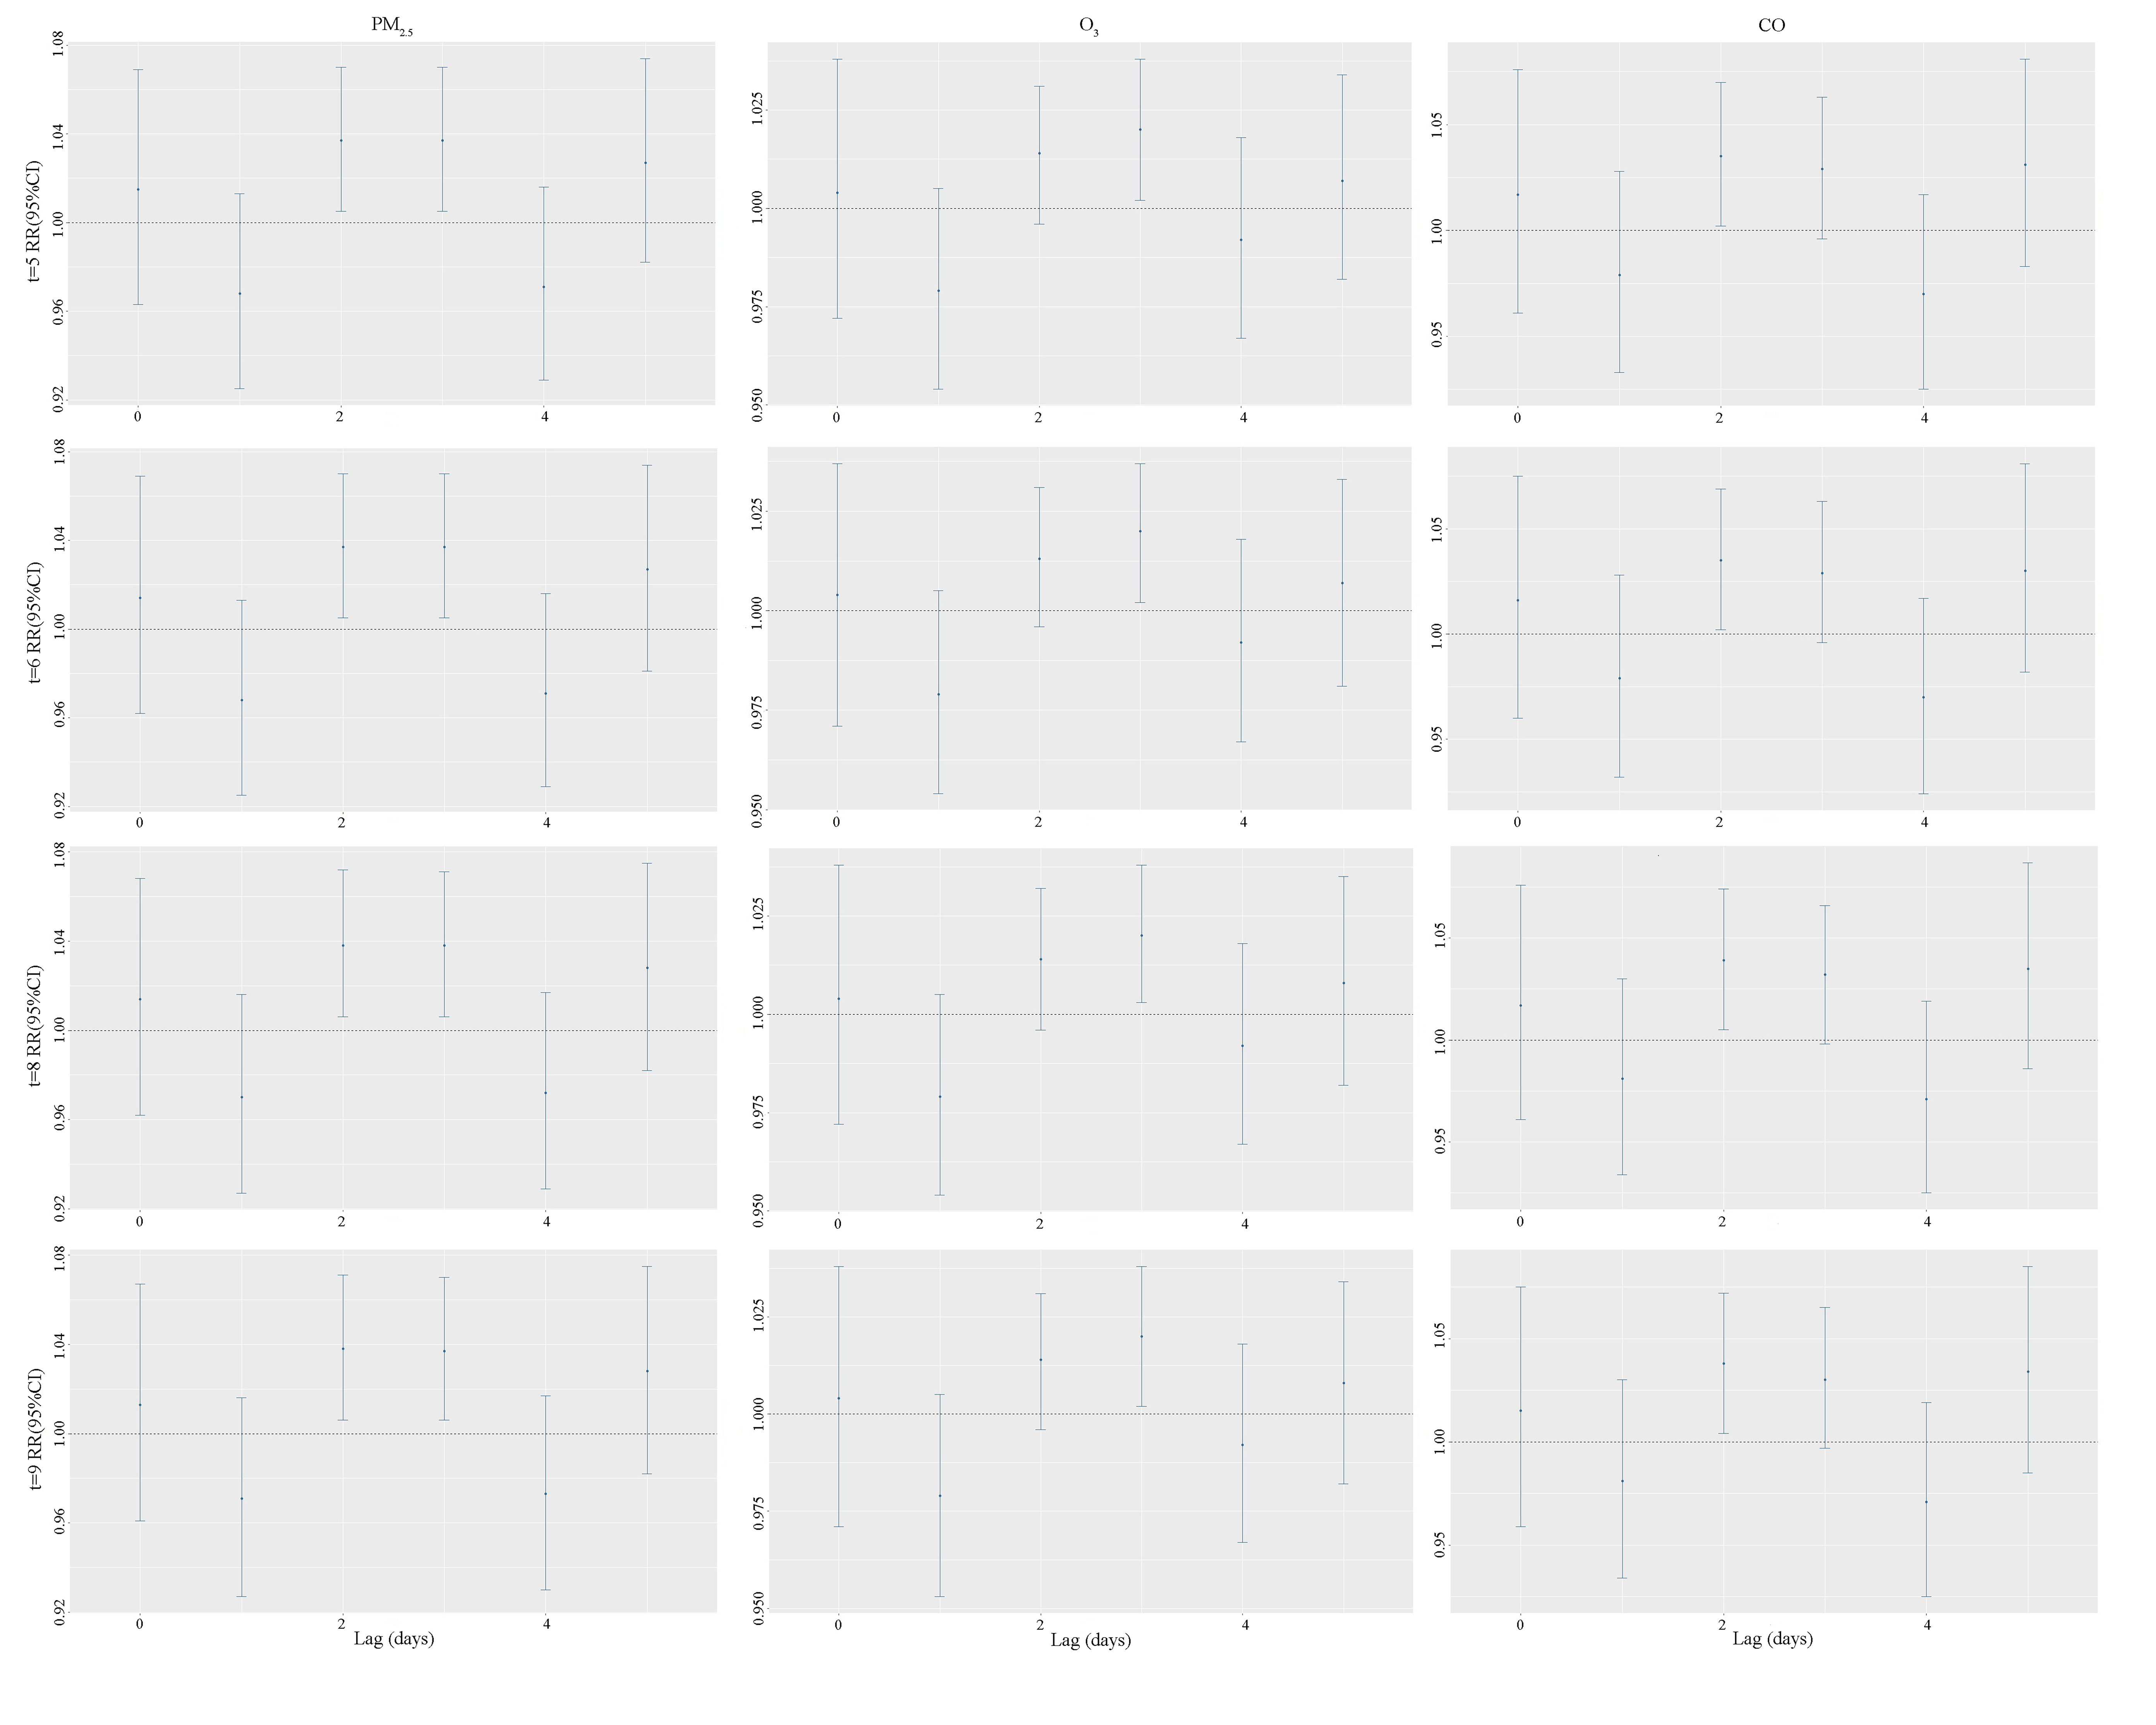
We used relative risk (RR) estimates and 95% confidence interval (CI) to represent the lag-specific of IBD visits 10 μg/m3 increase in PM2.5 and O3, and per 0.1 mg/m3 increase in CO. Besides, stratified analyses were conducted by IBD classification (ulcerative colitis and Crohn's disease), and season (warm and cold) to assess the effects of air pollutants exposure. According to the geographical location and climate type of Hefei, we defined the warm season from April to September and the cold season from October to March of the next year.
Sensitivity analysis was also performed to identify the robustness of the results by changing the degrees of freedom (5–9 df) in the ns function of time.
The data were organized and the database was established by Microsoft Excel software; SPSS 23.0 software was used for general description and chi-square test. R 3.2.3 software was used for the regression analysis of Distributed lag nonlinear model. P < 0.05 was considered statistically significant.