Genome-scale metabolic reconstruction of Lachancea kluyveri
The genome annotation of Lachancea kluyveri NRRL 12651 (Assembly: ASM14922v1, GenBank assembly accession: GCA_000149225.1) using Yeast Genome Annotation Pipeline [30] yielded 5,505 ORFs. The draft model from the annotated genome using Build Fungal Model in Kbase contained 1180 reactions, 1232 metabolites, and 730 genes. The draft model harbored the integration of data from 13 well-curated fungal genome-scale reconstructions. S. cerevisiae was used as the template model due to its high quality and reliability. The homology table generated from the BDBH algorithm for proteome comparison has been incorporated (Table S4, Supplementary Information). This can be used to predict possible duplication, inversion, deletion, insertion or synteny loci between the organisms. This can be used to predict possible duplication, inversion, deletion, insertion and synteny loci between the organisms i.e. L. kluyveri and S. cerevisiae. The details about the fungal templates used for reconstruction have been described in Materials and Methods. In the gene-level data integration statistics obtained from Kbase Build fungal model (Fig 1A), the percentage represented the fraction of protein-coding genes that have an ortholog in a specific fungal template model. S. cerevisiae showed the highest similarity (17%) followed by Candida tropicalis (13.6%) with L. kluyveri. Although it is known that E. gossypii and K. lactis are evolutionarily closer to L. kluyveri than S. cerevisiae and C. tropicalis, we present here a phylogenetic analysis at the gene level to explain the phenomena. The physiophenotypic similarities of L. kluyveri with S. cerevisiae and C. tropicalis are also justified given that both are Crabtree positive and fermenting yeasts. E. gossypii is non-fermenting filamentous fungi [31, 32] and K. lactis is a budding Crabtree negative yeast[25]. The 18S rRNA based phylogenetic tree (Fig 2A) built using the NCBI Taxonomy browser with iTOL visualization and genome-level phylogenetic tree (Fig 2B) constructed through REALPHY server describes the proximity of S. cerevisiae and C. tropicalis to L. kluyveri.
In a metabolic model, correct mass balance in the reactions is critical for the quality of predictive power[7]. Elemental and charge balances can be calculated and analyzed only if the model contains the formula and charge for the metabolites respectively. All the metabolites were assigned formula and charge with reference from CHEBI (Chemical Entities of Biological Interest), PubChem (NIH) and BiGG Database (UCSD)[33]. For metabolites having ambiguous alkyl group (-R), the alkyl group was considered as a conserved moiety “R” in the metabolite formula. The default metabolite ID was replaced by standard nomenclature (MIRIAM) for genome-scale metabolic reconstruction as used elsewhere for well-established models iMM904, iAF1260, etc. The assigned ID captured both the information regarding the chemical name and the compartments of the metabolites. Similar assignment was made for reactions in the reconstruction. Further refinement of the model was necessary with regard to the gaps in the biosynthetic pathways and the ambiguous reversibility of the reactions.
To assign the correct reversibility of the metabolic reactions, the iMM904 model was used as a template and homologous reactions were mapped to the draft model based on modelSEED reaction (Table S5, Supplementary Information). This corrected 82.5 % (1018 of 1232 reactions) of the inconsistencies in the reversibility of the reactions. The remaining inconsistencies were resolved by manual curation using COBRApy[34]. Upper and lower bound for internal reversible reactions were set to a high flux value i.e. 1000 mmol gdw-1 hr-1 to allow unconstrained flux through the internal metabolic network. For irreversible reactions, a lower flux bound of zero was assigned to restrict any flux in the reverse direction. The reversibility information on such ambiguous reactions was obtained from MetaCyc, KEGG and previously published datasets[35] on metabolic reactions. The irreversible reactions comprised of reactions that involve i) ATP as reactant ii) Oxygen as the product and iii) Reactions involving NADH and NADPH. (Fig 1B). These are due to the high enthalpy of the reactions associated with ATP breakdown, NADH/NADPH consumption and the fact that the cell cannot produce oxygen through its metabolism[7]. Through this semi-automated correction of the reversibility, 879 reactions were subject to irreversible flux bounds.
In GEMs, the biomass equation describes the growth of the cells from the biomass precursors like amino acids, carbohydrates, lipids, and ions. There was no natural auxotrophy reported for the organism. Hence, these biomass precursors should be produced from the central carbon pathway rather than uptake reactions from in silico media. The biomass equation comprised of 47 metabolites involved in biomass synthesis. The defects or gaps in biosynthetic pathways for these metabolites would block any biomass synthesis. 54 reactions were added to the model with reference from the KEGG pathway database. This enabled the organism to produce all the biomass precursors i.e. nucleotides, amino acids, carbohydrates, lipids and energy equivalents just from glucose, oxygen, ammonium salt and trace elements. The distribution of these gap filled reactions in different compartments of the metabolic model has been presented in Fig 1C. In internal reactions, the major inconsistencies were in mannan biosynthesis and fatty acid production pathways. Mannan biosynthesis takes place in the endoplasmic reticulum facilitated by dolichol phosphate anchoring[36]. The major gaps in this pathway comprised of transport reactions between the cytoplasm and endoplasmic reticulum. It was rectified manually with reference from KEGG and MetaCyc. Similarly, the fatty acid pathway comprises elongation of long-chain fatty acid with the addition of an even number of carbon through malonyl-CoA [37]. Due to this, any reaction blockage owing to incorrect flux direction or missing metabolites could render no flux through the whole pathway. We therefore, manually checked through the whole pathway to ensure that no reaction is blocked. There were significant inconsistencies in the transport of gases across the compartments. The diffusion of gases from extracellular space to a specific compartment and vice versa was important. The transport of oxygen from the extracellular space to the mitochondria through the cytosol was corrected by adding the transport reactions at the cell membrane and mitochondrial membrane. Any erroneous reaction which consumes oxygen (fatty acids desaturase reactions) were removed or given the proper reaction directionality. This was to avoid the diversion of oxygen to these reactions in the cytosol which is physiologically irrelevant. The numerical confidence on the reactions in the model was assigned based on the gene-protein reaction (GPR) and observed flux through it (Table S2, Supplementary Information). This will help the users to ascertain the confidence in predictions made using the model for metabolic flux analysis.
Although S. cerevisiae is phylogenetically very close to L. kluyveri¸ it has significantly different model statistics (Table 1). S. cerevisiae has a higher number of duplicate genes compared to L. kluyveri which has been reflected in the total number of genes in their respective metabolic models i.e. 904 vs 730. For example, S. cerevisiae has fatty acyl-CoA synthetases i.e. FAA1 (Gene symbol: YOR317) and FAA4 (Gene symbol: YMR246W) whereas L. kluyveri has just one that encodes for a fatty acyl-CoA synthetase. Similarly in the annotated genome, 527 instances showed that multiple S. cerevisiae genes were mapped to a single locus in L. kluyveri (Fig 1D).
The GEM for L. kluyveri was derived from the consensus reconstruction of different published metabolic models (Materials and Methods). The physiologically relevant characteristics i.e. formula, charge, and reversibility were assigned to metabolites and reactions. Incomplete biosynthetic pathways derived from the genome annotation were corrected to enable the synthesis of all essential biomass precursors. This qualified the model for further downstream applications to predict the flux distribution in the pathway in physiological conditions. The species-specific reactions like ethyl acetate metabolism and pyrimidine degradation routes were incorporated into the model. The model also mapped the genotype of the organism to a complex phenotype like flux distribution in the metabolic network which can be used to predict the phenotypic changes in the organism in response to combinatorial genetic perturbations.
Model validation through flux balance analysis
Flux Balance Analysis (FBA) solves a linear optimization problem with the objective as the specific growth of the cell i.e. flux through the biomass equation. This assigns fluxes to active reactions in the model given the constraints. The constraints of the optimization are defined by the bounds on the flux through the reactions and the uptake rate of substrates and other media components. This is further dictated by the thermodynamic Gibbs free energy (∆G) of the metabolic reactions.
From the previously generated experimental data[18, 41, 42], the accuracy of the prediction of the model was evaluated. Using the similar substrate and oxygen uptake rate as measured in the experiment, the specific growth rate and the product secretion rates were evaluated in silico by FBA. In the experiments reported previously, for a glucose uptake rate of 2.28 mmol gdw-1hr-1 and an oxygen uptake rate of 6.2 mmol gdw-1hr-1, a specific growth rate of 0.2 hr-1 were observed[18]. This corresponded to a carbon dioxide production rate of 6.4 mmol gdw-1hr-1 and a respiratory quotient (RQ) (the ratio of the volume of carbon dioxide evolved to that of oxygen consumed) of 1.03. To this, the predicted specific growth rate and the respiratory quotient were compared to the experimentally measured values[18, 43] (Table S1, Supplementary Information). For the specific growth rate, the analysis yielded a Pearson’s correlation coefficient of 0.96 and a p-value of 0.0021 (Fig 3A). For the respiratory quotient, the Pearson’s correlation coefficient value was 0.97 and a p-value of 0.033 (Fig 3B). Usually, the respiratory quotient depends on the respiratory and the fermentative metabolism of the cell. The RQ values vary in aerobic and anaerobic conditions depending on the metabolic state of the cell. A high correlation between experimental and in silico measurements validated the correct behaviour of the model in the span of all possible metabolic states. The bi-modal nature of the distribution in histograms of growth rate and RQ values is due to the growth of the organism lying in the aerobic and anaerobic growth regimes (Fig 3A and Fig 3B). The growth rate in aerobic conditions is higher compared to anaerobic conditions.
The in-silico growth and the viability of the model were evaluated in different carbon sources (Fig 4A). The carbon sources considered were glucose, galactose, maltose, sucrose, trehalose, melibiose, arabinose, ethanol, and citrate. The in vivo ability of L. kluyveri to grow in multiple carbon sources was procured from MycoBank[44]. The in-silico viability showed agreement with the reported in vivo viability (Fig 4A). With an uptake rate of 1 g gdw-1 hr-1, the in-silico growth rate on various carbon sources like glucose, galactose, maltose, sucrose, melibiose, ethanol and glycerol was evaluated in aerobic and anaerobic conditions (Fig 4B). The highest in silico growth rate in aerobic conditions was for ethanol followed by glycerol and glucose. The lowest growth rate was for galactose. The growth rate in anaerobic conditions was proportional to aerobic conditions for glucose, galactose, maltose, sucrose and melibiose. In an interesting observation, the growth rate on glycerol and ethanol was higher compared to others in aerobic conditions but the lowest in anaerobic conditions. This can be explained by the redox chemistry of ethanol and glycerol utilization. Both of them are products of the central carbon metabolism formed by reduction of glycolytic intermediates i.e. dihydroxyacetone phosphate[45] and acetaldehyde respectively. Ethanol and glycerol are non-fermentable carbon sources due to the redox imbalance caused during the anaerobic conditions. NADH redox imbalance in anaerobic glycerol metabolism impedes the growth[46]. Similarly, metabolic assimilation of ethanol in anaerobic conditions causes NADH imbalances due to the production of excess NADH which cannot be oxidized due to the absence of oxygen. We also performed batch growth experiments to validate the prediction of the growth rates on various carbon sources. The organism failed to grow on glycerol as the sole carbon source in shake flask experiment. This could be due to requirement of complete aerobic conditions in shake flask experiment. We could grow the organism on maltose, sucrose and galactose (Table S6, Supplementary Information) and measured the specific growth rate and substrate uptake rates (materials and methods). Using this, we showed a high correlation between the experimental growth rate and the predicted growth rate (Fig 4C).
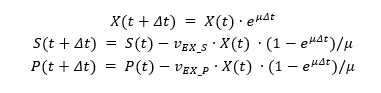
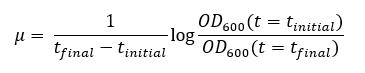
The substrate consumption, growth and product formation profiles were obtained from dynamic flux balance analysis (DFBA). DFBA [29] comprises of iterative flux balance analysis on a given amount of carbon source. It was important to confirm whether the experimentally observed metabolite production and growth rate tallied with the simulation results. A glucose uptake rate of 2.28 mmol gdw-1hr-1 was considered as reported to be a realistic uptake rate [18]. In aerobic conditions with an oxygen uptake rate of 1000 mmol gdw-1hr-1, the model did not produce any significant metabolite apart from biomass (Fig 5A). It agrees with the experimental results as L. kluyveri in aerobic conditions produces insignificant amounts of ethanol due to weak Crabtree positive nature. In semi-aerobic conditions with an oxygen uptake rate of 2 mmol gdw-1hr-1, the model produced ethyl acetate and ethanol apart from biomass (Fig 5B). The production of ethyl acetate as a major overflow has been reported in previous studies[2]. The ethanol concentration increased to a point until glucose was present in the medium after which it was consumed as a carbon source to fuel the growth. In anaerobic conditions with a very low oxygen uptake rate of 0.25 mmol gdw-1hr-1, the ethanol production increased significantly while ethyl acetate production was lowered compared to semi-aerobic conditions (Fig 5C). Similar to semi-aerobic conditions, the ethanol was used as the sole carbon source once glucose was exhausted in the medium. The reduction in the production of ethyl acetate both in complete aerobic conditions and in anaerobic conditions can be attributed to a reduction in the production of either of its precursors i.e. acetate and ethanol. Ethanol production was reduced in aerobic condition and acetate production was reduced in anaerobic conditions due to diversion of glycolytic flux towards ethanol. Rate of ethanol production increased and acetate production decreased with a decrease in oxygen uptake rate (Fig 5D). An optimal point was reached where ethyl acetate production was maximized against an uptake rate of about 3.125 mmol gdw-1 hr-1.
The model was able to predict the growth rate and the respiratory quotient with good accuracy in comparison to the experiments. The ability to grow and ferment on melibiose differentiates the organism from the related yeasts[3]. The variation in growth rate while growing on different carbon sources can be attributed to the energetic cost and the benefit of metabolizing them. Ethyl acetate and ethanol production phenotype observed in in silico growth kinetics showed agreement with the reported overflow metabolite production. This model can be potentially leveraged to generate hypotheses in relation to the metabolism and physiology of the organism.
In silico single knockout analysis shows an agreement with experimental data.
Genome-scale metabolic models map the genotype of an organism i.e. gene information to the metabolic flux phenotypes of the cell. Each gene encodes for protein/subunit of a protein that catalyzes a specific reaction[22]. Each of the reactions is assigned a flux solution space through FBA. This enables the metabolic model to predict the changes in flux phenotypes with respect to perturbation in genotype i.e. single knockout or combinatorial knockout analysis. To gain a high degree of confidence, it was imperative to validate such predictive power of the model in comparison to experimentally established datasets. The genotype information was mapped to the reaction information through Boolean logic. For encoding a protein complex, either all genes or only some of them are required. This is well presented by the Boolean logic using AND or OR to map the genes to the protein. The viability should remain unaffected by the deletion of genes that do not have obligatory functions. Two large scale gene knockout studies in S. cerevisiae were used to evaluate the predictive power of the model. Comparative gene knockout analysis of the model with reference to the published datasets[47, 48] for homologous genes in S. cerevisiae was performed. Statistical analysis was performed in terms of sensitivity, specificity, F1 score and Mathews correlation coefficient (MCC) (Fig 6A). FBA and MOMA[49] (Minimization of Metabolic Adjustment) were performed to assess the viability of the model based on single-gene knockouts. Due to the similar performance of both the approaches i.e. FBA and MOMA, only FBA was considered for any further discussion.
When cells grow in minimal medium where only carbon source, ammonium salts, phosphate and trace elements are present, it requires all the enzymes necessary for synthesizing amino acids, nucleotides, lipids and carbohydrates. In rich media, the cells are supplied with all the growth precursors in a platter so the cells relax the biosynthesis of those precursors [50]. In the genome-wide single-gene knockout analysis, the metabolic model supplemented with all growth precursors has significantly fewer essential genes i.e. true positives compared to growth on minimal media (Fig 6B). The total number of true essential genes were calculated with reference to the corresponding single knockout dataset of S. cerevisiae (Table S3, Supplementary Information) [28, 48]. Only 74.93 % (547) genes had a homolog in S. cerevisiae. The model had a sensitivity of 0.58 for rich media and 0.32 for the minimal media. It had almost equal specificity scores of 0.84 in rich and minimal media. For evaluating the performance of the model in classifying essential and non-essential genes, F1 score and Matthews Correlation Coefficient (MCC) were used. F1 score for predictions was 0.324 in rich media, 0.317 in minimal media with glucose. MCC for predictions was 0.28 in rich media, 0.162 in minimal media with glucose. The radar plot (Fig 6A) compared the statistical figures of merit when the single knockout analysis was performed in minimal and rich media. S. cerevisiae single-gene knockout database was used due to the unavailability of extensive knockout analysis for L. kluyveri. A considerable F1 score and MCC being on the higher side for the model validated the confidence in the predictions.
Integration of reported metabolic routes in the model iPN730
In the previous published literature, important metabolic phenotypes for L. kluyveri have been reported. Of the four possible modes of pyrimidine degradation known, the uracil catabolism (URC) pathway has been uniquely characterized in L. kluyveri[1, 4, 51]. Locus URC1-6 and URC8 have been experimentally characterized to be an essential component of the URC pathway for uracil degradation. This enables L. kluyveri to grow on uracil and the intermediates of the degradation pathway as the sole nitrogen source. This ability is supposedly lost in S. cerevisiae after the whole genome duplication event [4]. In the URC pathway, the gene products of URC1 and URC6 degrade Uracil to 3-hydroxypropionate and ribosylurea through multiple steps that have not been characterized. The gene product of URC4 degrades ribosylurea to urea. The urea is further broken down by the action of gene products of URC3 and URC5 to ammonia and carbon dioxide. The ammonia/ammonium then replenishes the nitrogen pool for amino acid and nucleotide biosynthesis. This enables the organism to grow on uracil and urea as the sole nitrogen source. The whole pathway (Fig 7A) was incorporated into the metabolic model iPN730. The permeases/transporters for the intermediates of the pathway were incorporated into the model to enable their uptake. The ability of the model to show in silico growth on uracil and urea as a nitrogen source was evaluated. The model was able to incorporate nitrogen from uracil and urea into its metabolism. The uptake rate for uracil and urea per unit uptake flux of glucose in complete aerobic conditions was 1.009 mmol gdw-1 hr-1 and 0.261 mmol gdw-1 hr-1 respectively. With ammonium as the sole nitrogen source, the uptake rate per unit uptake flux of glucose was 0.526 mmol gdw-1 hr-1 (Fig 7B). We also found a high agreement between the in silico growth rate (0.097 hr-1) and the experimental growth rate (0.0962 hr-1) (Table S6, Supporting Information).
The ethyl acetate biosynthesis pathway was reconstructed in iPN730 which was reported earlier. Its production was highest in the semi-aerobic condition when ethanol production and acetate production were optimal. The production of ethyl acetate from its precursors was putatively facilitated by the cytoplasmic esterase. A transport reaction for ethyl acetate was incorporated into the metabolic model that enabled its secretion. The pathways for phenyl acetate, 2-methylbutanol and isobutanol were also present in the reconstructed metabolic model which are important industrial chemicals[52]. Their yields can be estimated in silico per unit mole of glucose consumed for metabolic engineering purposes.
Pyrimidine degradation pathway in L. kluyveri has been discussed in relation to anti-cancer drug design as understanding pyrimidine homeostasis directly affects the DNA replication machinery[4]. Although the pyrimidine catabolism pathway has been sufficiently characterized, iPN730 will give an opportunity to understand the genotype to flux phenotype relations and its interaction with other pathways at a systems level.